Global E-House Market (2017-2023) | Size, Analysis, Revenue, Trends, Growth, Forecast, industry, Outlook & COVID-19 IMPACT
Market Forecast by Voltage Type (Low Voltage and Medium Voltage), Applications (Oil & Gas, Industrial, Infrastructure & Transportation, Power Utilities, Mining and Others, Regions (North America (US, Canada and Mexico), Europe (UK, France, Germany, Russia and Others), Asia-Pacific (China, Australia, Indonesia and Others), Middle-East (Saudi Arabia, UAE, Turkey and Others), Africa (South Africa, Kenya, Nigeria, and Others) and South America (Brazil, Argentina, Others)) and Competitive Landscape
| Product Code: ETC000368 | Publication Date: Nov 2021 | Updated Date: Apr 2023 | Product Type: Report | |
| Publisher: 6Wresearch | No. of Pages: 190 | No. of Figures: 120 | ||
Latest 2023 Developments of the Global E-House Market
The Global E-House Market is rising enormously and it will continue to attain remarkable growth in the years to come. Rising demand for energy systems that are renewable across many sectors is the major development of the market. Since more players are shifting towards clean energy sources, they need efficient and reliable power distribution solutions which can accommodate their requirements and this presents significant growth opportunities for E-Houses. The emergence of advanced infrastructure technologies is another trend in the Global E-House Industry. There is a rising requirement for intelligent electric systems which can optimize performance and decrease costs. With advancements in automation and digitalization, there is a rising requirement for intelligent electrical systems which have the potential to reduce costs and optimize performance. These factors are helping fuel the Global E-House Market Growth.
Global E-House Market Synopsis
Increasing offshore oil & gas exploration activity, growth in mining, and power infrastructure have increased the demand for electrical houses globally. This has been further amplified by the increasing demand for E-Houses arising from the renewable energy sector. The global increase in the rail infrastructure, with dedicated freight corridors being constructed around the world, would also fuel the E-House business globally. The growth of the E-House market is primarily driven by investments in the oil & gas sector and power sector.
According to 6Wresearch, the Global E-House market size is projected to grow at a CAGR of 8.5% during 2017-23. The development of smart grids and the establishment of nuclear and renewable energy power plants would fuel the market for E-House in the forecast period. The offshore oil & gas sector accounted for the majority of the revenue share in the global E-House market. The mining, rail infrastructure & transportation segments would drive the Global E-House market forecast revenues over the next six years. The global E-House market is dominated by the gas-insulated medium voltage segment in 2016.
The Global Electrical House (E-House) market analysis the market and provide international market including development trends, competitive landscape analysis, and key regions' development status. Development policies and plans were discussed as well as manufacturing processes and cost structures were also planned.
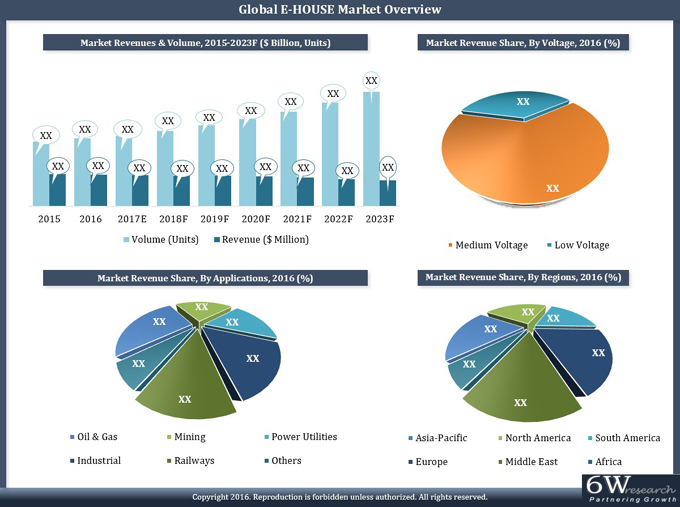
Amongst all the applications, the oil & gas sector accounted for the highest Global E-House market share in 2016. Power utility, mining, and industrial sector are other key revenue-generating segments.
The Global E-House market report thoroughly covers the market by voltage, applications, and regions. The Global E-House market outlook report provides an unbiased and detailed analysis of the Global E-House market trends, opportunities/ high growth areas, and market drivers, which would help stakeholders to device and align market strategies according to the current and future market dynamics.
The global e-house market is projected to witness substantial growth in the coming timeframe backed by the rising potential growth of the oil and gas sector in developed and developing countries. Middle East countries are estimated to act as a growth proliferating owing to the increasing production of oil where Saudi Arabia be the leading oil producer and exporter of crude oil, therefore, the growth of the e-house is simultaneously increasing as a power backup along with the easy installation and cost-efficient are the silent feature which is estimated to boost the growth of the e house market in the middle east region, as a result, it would benefit the growth of the e house market. Top key players operating in the global e-house market include general electric CG power, ABB Ltd, Schneider, and Mcidensha.
Key Highlights of the Report:
• Global E-House Market Overview
• Global E-House Market Outlook
• Global E-House Market Size & Global E-House Market Forecast of Revenues & Volume until 2023
• Historical Data of Global E-House Market Revenues & Volume for the Period 2012-2016
• Historical Data of Asia-Pacific, North America, South America, Europe, Africa, and the Middle East
E House Market Revenues & Volume for the Period 2012-2016
• Market Size & Forecast of Asia-Pacific, North America, South America, Europe, Africa, and Middle
East E-House Market Revenues & Volume until 2023
• Historical Data of E-House Countries Market Revenues & Volume for the Period 2012-2016
• Market Size & Forecast of E-House Countries Market Revenues & Volume until 2023
• Global E-House Market Revenues & Volume Until 2023
• Global E-House Market Drivers and Restraints
• Global E-House Market Trends and Developments
• Global E-House Market Opportunity Assessment
• Global E-House Market Share by Players
• Global E-House Market Overview on Competitive Landscape
• Company Profiles
• Key Strategic Recommendation
Markets Covered
The Global E-House market report provides a detailed analysis of the following market segments
By Voltage:
- Medium Voltage E-House
- Low Voltage E-House
By Applications:
- Oil & Gas
- Industrial
- Infrastructure & Transportation
- Power Utilities
- Mining
- Others
By Regions:
o the Asia Pacific
? China
? Australia
? Indonesia
? Others
o Africa
? South Africa
? Nigeria
? Kenya
? Others
o Europe
? UK
? France
? Germany
? Russia
? Others
o the Middle East
? Saudi Arabia
? UAE
? Turkey
? Others
o North America
? US
? Canada
? Mexico
o South America
? Brazil
? Argentina
? Others
Global E-House Market: FAQs
An e-house is a pre-fabricated solution which contains all required equipment as well as systems for power control and distribution. It can be custom-designed in order to meet specific requirements as well as installed in a number of locations.
E-houses have many advantages over conventional on-site construction methods, like reduced installation cost and time, increased flexibility and scalability, and improved safety. They also provide better safety against environmental hazards or harsh conditions.
E-houses are used in sectors that need efficient and reliable power supply solutions, like oil & gas, utilities, and mining. They can also be used for emergency backup power.
The development of smart grids and the establishment of nuclear and renewable energy power plants would fuel the market for E-House in the forecast period.
Yes, we provide customisation as per your requirements. To learn more, feel free to contact us on sales@6wresearch.com
1. Executive Summary
2. Introduction
2.1. Report Description
2.2. Key Highlights of the Report
2.3. Market Scope & Segmentation
2.4. Methodology Adopted and Key Data Points
2.5. Assumptions
3. Global E-House Market Overview
3.1. Global E-House Market Revenues Vs Volume (2015-2023F)
3.2. Global E-House Market Revenue Share, By Regions, 2016
3.3. Global E-House Market Revenue Share, By Voltage (2016-2023F)
3.4. Global E-House Market Revenue Share, By Applications (2016-2023F)
3.5. Industry Life Cycle
3.6. Porter's Five Forces
4. Global E-House Market Dynamics
4.1. Impact Analysis
4.2. Market Drivers
4.3. Market Restraints
5. Global E-House Market Trends
5.1. Replacement of SF6
5.2. Digitalization of E-House
5.3. Solar E-HOUSE and Standardization of E-House
6. Asia Pacific E-House Market Overview
6.1. Asia Pacific E-House Market Revenues (2015-2023F)
6.2. Asia Pacific E-House Market Volume (2015-2023F)
6.3. Asia Pacific E-House Market Revenue Vs Volume Share, By Voltage (2016)
6.4. Asia Pacific E-House Market Revenue Share, By Applications (2016)
7. Asia Pacific E-House Market Overview, By Country
7.1. China E-House Market Overview
7.1.1. China E-House Market Revenues (2015-2023F)
7.1.2. China E-House Market Volume (2015-2023F)
7.1.3. China Major Upcoming Project
7.2. Australia E-House Market Overview
7.2.1. Australia E-House Market Revenues (2015-2023F)
7.2.2. Australia E-House Market Volume (2015-2023F)
7.2.3. Australia Major Upcoming Project
7.3. Indonesia E-House Market Overview
7.3.1. Indonesia E-House Market Revenues (2015-2023F)
7.3.2. Indonesia E-House Market Volume (2015-2023F)
7.3.3. Indonesia Major Upcoming Project
8. North America E-House Market Overview
8.1. North America E-House Market Revenues (2015-2023F)
8.2. North America E-House Market Volume (2015-2023F)
8.3. North America E-House Market Revenue Vs Volume Share, By Voltage (2016)
8.4. North America E-House Market Revenue Share, By Applications (2016)
9. North America E-House Market Overview, By Country
9.1. USA E-House Market Overview
9.1.1. USA E-House Market Revenues (2015-2023F)
9.1.2. USA E-House Market Volume (2015-2023F)
9.1.3. USA Major Upcoming Project
9.2. Canada E-House Market Overview
9.2.1. Canada E-House Market Revenues (2015-2023F)
9.2.2. Canada E-House Market Volume (2015-2023F)
9.2.3. Canada Major Upcoming Project
9.3. Mexico E-House Market Overview
9.3.1. Mexico E-House Market Revenues (2015-2023F)
9.3.2. Mexico E-House Market Volume (2015-2023F)
9.3.3. Mexico Major Upcoming Project
10. South America E-House Market Overview
10.1. South America E-House Market Revenues (2015-2023F)
10.2. South America E-House Market Volume (2015-2023F)
10.3. South America E-House Market Revenue Vs Volume Share, By Voltage (2016)
10.4. South America E-House Market Revenue Share, By Applications (2016)
11. South America E-House Market Overview, By Country
11.1. Brazil E-House Market Overview
11.1.1. Brazil E-House Market Revenues (2015-2023F)
11.1.2. Brazil E-House Market Volume (2015-2023F)
11.1.3. Brazil Major Upcoming Project
11.2. Argentina E-House Market Overview
11.2.1. Argentina E-House Market Revenues (2015-2023F)
11.2.2. Argentina E-House Market Volume (2015-2023F)
11.2.3. Argentina Major Upcoming Project
12. Europe E-House Market Overview
12.1. Europe E-House Market Revenues (2015-2023F)
12.2. Europe E-House Market Volume (2015-2023F)
12.3. Europe E-House Market Revenue Vs Volume Share, By Voltage (2016)
12.4. Europe E-House Market Revenue Share, By Applications (2016)
13. Europe E-House Market Overview, By Country
13.1. UK E-House Market Overview
13.1.1. UK E-House Market Revenues (2015-2023F)
13.1.2. UK E-House Market Volume (2015-2023F)
13.1.3. UK Major Upcoming Project
13.2. Germany E-House Market Overview
13.2.1. Germany E-House Market Revenues (2015-2023F)
13.2.2. Germany E-House Market Volume (2015-2023F)
13.2.3. Germany Major Upcoming Project
13.3. Russia E-House Market Overview
13.3.1. Russia E-House Market Revenues (2015-2023F)
13.3.2. Russia E-House Market Volume (2015-2023F)
13.3.3. Russia Major Upcoming Project
14. Africa E-House Market Overview
14.1. Africa E-House Market Revenues (2015-2023F)
14.2. Africa E-House Market Volume (2015-2023F)
14.3. Africa E-House Market Revenue Vs Volume Share, By Voltage (2016)
14.4. Africa E-House Market Revenue Share, By Applications (2016)
15. Africa E-House Market Overview, By Country
15.1. South Africa E-House Market Overview
15.1.1. South Africa E-House Market Revenues (2015-2023F)
15.1.2. South Africa E-House Market Volume (2015-2023F)
15.1.3. South Africa Major Upcoming Project
15.2. Nigeria E-House Market Overview
15.2.1. Nigeria E-House Market Revenues (2015-2023F)
15.2.2. Nigeria E-House Market Volume (2015-2023F)
15.2.3. Nigeria Major Upcoming Project
15.3. Kenya E-House Market Overview
15.3.1. Kenya E-House Market Revenues (2015-2023F)
15.3.2. Kenya E-House Market Volume (2015-2023F)
15.3.3. Kenya Major Upcoming Project
16. Middle East E-House Market Overview
16.1. Middle East Market Revenues (2015-2023F)
16.2. Middle East E-House Market Volume (2015-2023F)
16.3. Middle East E-House Market Revenue Vs Volume Share, By Voltage (2016)
16.4. Middle East E-House Market Revenue Share, By Applications (2016)
17. Middle East E-House Market Overview, By Country
17.1. Saudi Arabia E-House Market Overview
17.1.1. Saudi Arabia E-House Market Revenues (2015-2023F)
17.1.2. Saudi Arabia E-House Market Volume (2015-2023F)
17.1.3. Saudi Arabia Major Upcoming Project
17.2. UAE E-House Market Overview
17.2.1. UAE E-House Market Revenues (2015-2023F)
17.2.2. UAE E-House Market Volume (2015-2023F)
17.2.3. UAE Major Upcoming Project
17.3. Turkey E-House Market Overview
17.3.1. Turkey E-House Market Revenues (2015-2023F)
17.3.2. Turkey E-House Market Volume (2015-2023F)
17.3.3. Turkey Major Upcoming Project
18. Global E-House Market Opportunity Assessment
18.1. Global E-House Market Region Wise Opportunity
18.2. Global E-House Market Opportunity in Renewable Energy Sector
19. Competitive Landscape
19.1. Global E-House Market Share, By Company
20. Company Profiles
20.1. ABB Ltd.
20.2. General Electric Company
20.3. Schneider Electric SE
20.4. Siemens AG
20.5. Eaton Corporation
20.6. Powell Industries Inc.
20.7. TGOOD Global Ltd.
20.8. Zest Weg Group
20.9. Electroinnova Installations and Maintenance SL
21. Key Strategic Pointers
22. Disclaimer
List of Figures
Figure 1 Global E-House Market Revenues, 2015-2023F ($ Billion)
Figure 2 Global E-House Market Volumes, 2015-2023F (Thousand Units)
Figure 3 Global E-House Market Revenue Share, By Region, 2016
Figure 4 Global E-House Market Revenue Share, By Voltage, 2016
Figure 5 Global E-House Market Revenue Share, By Voltage, 2023F
Figure 6 Global E-House Market Revenue Share, By Application, 2016
Figure 7 Global E-House Market Revenue Share, By Application, 2023F
Figure 8 Global E-House Market Industry Life Cycle
Figure 9 Global E-House Market Porter's Five Forces
Figure 10 Global Railway Industry Development 2013-2015
Figure 11 Europe Major Railway Projects
Figure 12 North America Major Railway Projects
Figure 13 Asia pacific Major Railway Projects
Figure 14 the Middle East and Africa Major Railway Projects
Figure 15 Global Colocation Market Regional Share 2016
Figure 16 Hyperscale Data Centers, By Country 2016
Figure 17 Cost-Saving From E-House
Figure 18 Contribution to CO2 Equivalent Emissions
Figure 19 Asia Pacific E-House Market Revenues, 2015-2023F ($ Billion)
Figure 20 Asia Pacific E-House Market Volume, 2015-2023F (Units)
Figure 21 Asia Pacific E-House Market Revenue Share, By Voltage, 2016
Figure 22 Asia Pacific E-House Market Revenue Share, By Voltage, 2023F
Figure 23 Asia Pacific E-House Market Volume Share, By Voltage, 2016
Figure 24 Asia Pacific E-House Market Volume Share, By Voltage, 2023F
Figure 25 Asia Pacific E-House Market Revenue Share, By Applications, 2016
Figure 26 Asia Pacific E-House Market Revenue Share, By Applications, 2023F
Figure 27 China E-House Market Revenues, 2015-2023F ($ Billion)
Figure 28 China E-House Market Revenues, 2015-2023F ($ Billion)
Figure 29 China Major Upcoming Projects
Figure 30 Australia E-House Market Revenues, 2015-2023F ($ Billion)
Figure 31 Australia E-House Market Volume, 2015-2023F (Units)
Figure 32 Australia Major Upcoming Projects
Figure 33 Indonesia E-House Market Revenues, 2015-2023F ($ Billion)
Figure 34 Indonesia E-House Market Volume, 2015-2023F (Units)
Figure 35 Indonesia Major Upcoming Projects
Figure 36 North America E-House Market Revenues, 2015-2023F ($ Billion)
Figure 37 North America E-House Market Volume, 2015-2023F (Units)
Figure 38 North America E-House Market Revenue Share, By Voltage, 2016
Figure 39 North America E-House Market Revenue Share, By Voltage, 2023F
Figure 40 North America E-House Market Volume Share, By Voltage, 2016
Figure 41 North America E-House Market Volume Share, By Voltage, 2023F
Figure 42 North America E-House Market Revenue Share, By Applications, 2016
Figure 43 North America E-House Market Revenue Share, By Applications, 2023F
Figure 44 USA E-House Market Revenues, 2015-2023F ($ Billion)
Figure 45 USA E-House Market Volume, 2015-2023F (Units)
Figure 46 USA Major Upcoming Projects
Figure 47 Canada E-House Market Revenues, 2015-2023F ($ Billion)
Figure 48 Canada E-House Market Volume, 2015-2023F (Units)
Figure 49 Canada Major Upcoming Projects
Figure 50 Mexico E-House Market Revenues, 2015-2023F ($ Billion)
Figure 51 Mexico E-House Market Volume, 2015-2023F (Units)
Figure 52 Mexico Major Upcoming Projects
Figure 53 South America E-House Market Revenues, 2015-2023F ($ Billion)
Figure 54 South America E-House Market Volume, 2015-2023F (Units)
Figure 55 South America E-House Market Revenue Share, By Voltage, 2016
Figure 56 South America E-House Market Revenue Share, By Voltage, 2023F
Figure 57 South America E-House Market Revenue Share, By Volume, 2016
Figure 58 South America E-House Market Revenue Share, By Volume, 2023F
Figure 59 South America E-House Market Revenue Share, By Applications, 2016
Figure 60 South America E-House Market Revenue Share, By Applications, 2023F
Figure 61 Brazil E-House Market Revenues, 2015-2023F ($ Billion)
Figure 62 Brazil E-House Market Volume, 2015-2023F (Units)
Figure 63 Brazil Major Upcoming Projects
Figure 64 Argentina E-House Market Revenues, 2015-2023F ($ Billion)
Figure 65 Argentina E-House Market Volume, 2015-2023F (Units)
Figure 66 Argentina Major Upcoming Projects
Figure 67 Europe E-House Market Revenues, 2015-2023F ($ Billion)
Figure 68 Europe E-House Market Volume, 2015-2023F (Units)
Figure 69 Europe E-House Market Revenue Share, By Voltage, 2016
Figure 70 Europe E-House Market Revenue Share, By Voltage, 2023F
Figure 71 Europe E-House Market Revenue Share, By Volume, 2016
Figure 72 Europe E-House Market Revenue Share, By Volume, 2023F
Figure 73 Europe E-House Market Revenue Share, By Applications, 2016
Figure 74 Europe E-House Market Revenue Share, By Applications, 2023F
Figure 75 UK E-House Market Revenues, 2015-2023F ($ Billion)
Figure 76 UK E-House Market Volume, 2015-2023F (Units)
Figure 77 UK Major Upcoming Projects
Figure 78 Germany E-House Market Revenues, 2015-2023F ($ Billion)
Figure 79 Germany E-House Market Volume, 2015-2023F (Units)
Figure 80 Germany Major Upcoming Projects
Figure 81 Russia E-House Market Revenues, 2015-2023F ($ Billion)
Figure 82 Russia E-House Market Volume, 2015-2023F (Units)
Figure 83 Russia Major Upcoming Projects
Figure 84 Africa E-House Market Revenues, 2015-2023F ($ Billion)
Figure 85 Africa E-House Market Volume, 2015-2023F (Units)
Figure 86 Africa E-House Market Revenue Share, By Voltage, 2016
Figure 87 Africa E-House Market Revenue Share, By Voltage, 2023F
Figure 88 Africa E-House Market Revenue Share, By Volume, 2016
Figure 89 Africa E-House Market Revenue Share, By Voltage, 2023F
Figure 90 Africa E-House Market Revenue Share, By Applications, 2016
Figure 91 Africa E-House Market Revenue Share, By Applications, 2023F
Figure 92 South Africa E-House Market Revenues, 2015-2023F ($ Billion)
Figure 93 South Africa E-House Market Volume, 2015-2023F (Units)
Figure 94 South Africa Major Upcoming Projects
Figure 95 Nigeria E-House Market Revenues, 2015-2023F ($ Billion)
Figure 96 Nigeria E-House Market Volume, 2015-2023F (Units)
Figure 97 Nigeria Major Upcoming Projects
Figure 98 Kenya E-House Market Revenues, 2015-2023F ($ Billion)
Figure 99 Kenya E-House Market Volume, 2015-2023F (Units)
Figure 100 Kenya Major Upcoming Projects
Figure 101 Middle East E-House Market Revenues, 2015-2023F ($ Billion)
Figure 102 Middle East E-House Market Volume, 2015-2023F (Units)
Figure 103 Middle East E-House Market Revenue Share, By Voltage, 2016
Figure 104 Middle East E-House Market Revenue Share, By Voltage, 2023F
Figure 105 Middle East E-House Market Revenue Share, By Volume, 2016
Figure 106 Middle East E-House Market Revenue Share, By Volume, 2023F
Figure 107 Middle East E-House Market Revenue Share, By Applications, 2016
Figure 108 Middle East E-House Market Revenue Share, By Applications, 2023F
Figure 109 Saudi Arabia E-House Market Revenues, 2015-2023F ($ Billion)
Figure 110 Saudi Arabia E-House Market Volume, 2015-2023F (Units)
Figure 111 UAE Major Upcoming Projects
Figure 112 UAE E-House Market Revenues, 2015-2023F ($ Billion)
Figure 113 UAE E-House Market Volume, 2015-2023F (Units)
Figure 114 UAE Major Upcoming Projects
Figure 115 Turkey E-House Market Revenues, 2015-2023F ($ Billion)
Figure 116 Turkey E-House Market Volume, 2015-2023F (Units)
Figure 117 Turkey Major Upcoming Projects
Figure 118 Global E-House Market Region-Wise Opportunity
Figure 119 Country-wise Renewable Energy Sector Investments, 2016
Figure 120 Global E-House Market Share, By Company, 2016
Pricing
- Single User License$ 4,560
- Department License$ 5,055
- Site License$ 5,595
- Global License$ 6,000

Search
Related Reports
- Saudi Arabia Conductors Market (2024-2030) | Share, Trends, Value, Analysis, Outlook, Forecast, Growth, Industry, Companies, Size & Revenue
- Australia Fire Doors Market (2023-2029) | Share, Trends, Value, Analysis, Outlook, Forecast, Growth, Industry, Companies, Size & Revenue
- UAE Online Gifting Market (2023-2029) | Size, industry, Revenue, Growth, Size, Share, Value, Outlook & COVID-19 IMPACT
- India Baby Product Market (2024-2030) | Share, Trends, Value, Analysis, Outlook, Forecast, Growth, Industry, Companies, Size & Revenue
- India Multiprotocol Label Switching-Transport Profile Market (2024-2030) | Share, Trends, Value, Analysis, Outlook, Forecast, Growth, Industry, Companies, Size & Revenue
- India Plant Protein Market (2023-2029) | Share, Trends, Value, Analysis, Outlook, Forecast, Growth, Industry, Companies, Size & Revenue
- India Switches Market (2024-2030) | Share, Trends, Value, Analysis, Outlook, Forecast, Growth, Industry, Companies, Size & Revenue
- Indonesia System Integrator Market (2024-2030) | Companies, Analysis, Industry, Growth, Forecast, Size, Value, Share, Revenue & Trends
- India LV Switchgear Market (2024-2030) | Share, Trends, Value, Analysis, Outlook, Forecast, Growth, Industry, Companies, Size & Revenue
- Hungary Air Conditioner Market (2024-2030) | Size, Trends, Industry, Forecast, Share, Growth, Value, Revenue, Analysis, Outlook & COVID-19 IMPACT
Industry Events and Analyst Meet

EV INDIA EXPO 2023

3rd Cyber Security for Energy and Utility

The Big 5 Saudi

Media Expo-Mumbai Digital Signage

Meta Cinema Forum- Ghana
Our Clients
Whitepaper
- Middle East & Africa Commercial Security Market Click here to view more.
- Middle East & Africa Fire Safety Systems & Equipment Market Click here to view more.
- GCC Drone Market Click here to view more.
- Middle East Lighting Fixture Market Click here to view more.
- GCC Physical & Perimeter Security Market Click here to view more.
6WResearch In News
- India's Printer Market Faces 20.7% Decline in Q4 2023: Epson and HP Lead Amidst Downturn
- India's Camera Market Sees 8.9% Decline in Q4 2023; Canon Leads with 38.4% Share
- Doha a strategic location for EV manufacturing hub: IPA Qatar
- Demand for luxury TVs surging in the GCC, says Samsung
- Empowering Growth: The Thriving Journey of Bangladesh’s Cable Industry
- The future of gaming industry in the Philippines