Qatar Power Rental Market (2014-2020) | Analysis, Forecast, Companies, Industry, Outlook, Growth, Revenue, Value, Trends, Share & Size
Market Forecast By Gensets Types (Diesel and Non-Diesel Gensets), By KVA Ratings (Below 100 KVA, 100.1 KVA- 350 KVA, 350.1 KVA-750 KVA, 750 KVA-1000 KVA and Above 1000 KVA), By Applications (Utilities, Oil & Gas, Industrial & Construction, Quarrying and Mining, and others) and Regions (North and South)
| Product Code: ETC000218 | Publication Date: Jan 2015 | Product Type: Report | ||
| Publisher: 6Wresearch | Author: Ravi Bhandari | No. of Pages: 53 | No. of Figures: 6 | No. of Tables: 01 |
Upcoming FIFA World Cup 2022, rising public & private infrastructure, construction of hotels & stadiums, and increasing flow of investments in the country are exhibited to fuel the growth of Qatar's power rental market. The share of Qatar's power rental market, when compared with other Middle East countries such as Saudi Arabia and UAE, is relatively small; however, in the forecast period, its market is anticipated to increase owing to mega construction activities.
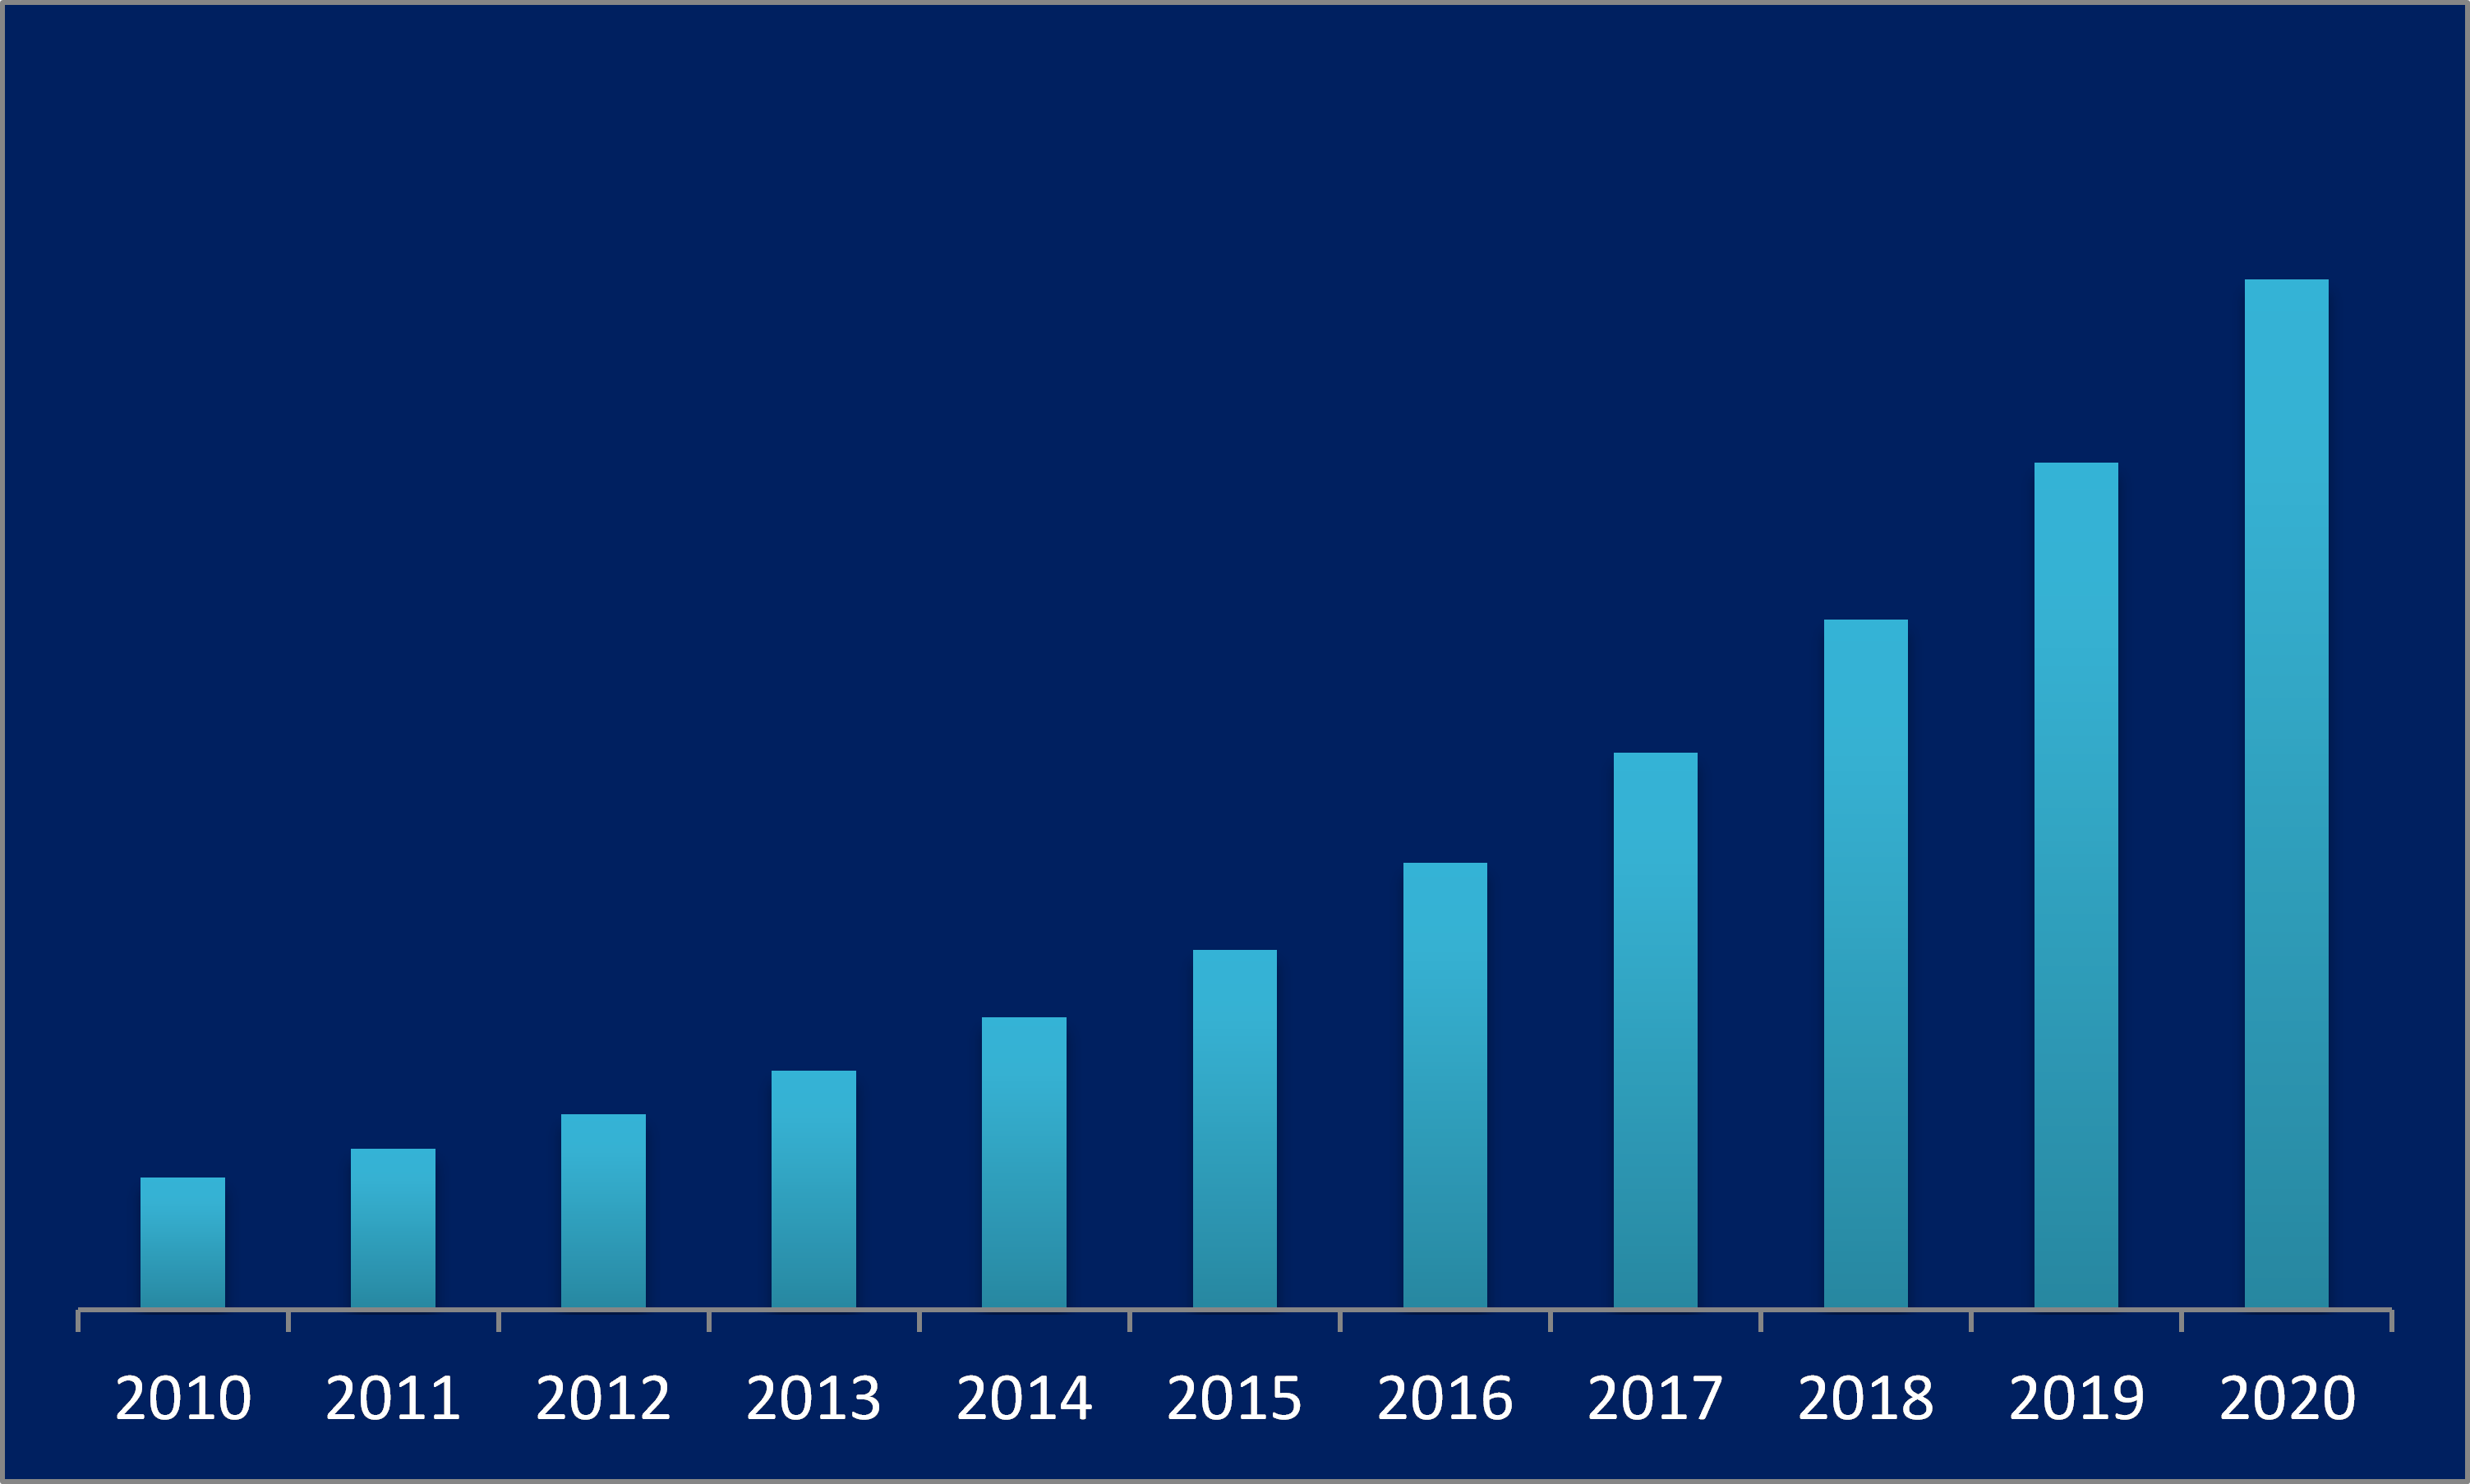
According to 6Wresearch, the Qatar power rental market is projected to grow at a CAGR of 23.3% during 2014-20. In Qatar's power rental market, the diesel gen-sets rental segment accounted for the majority of the market share. With the increasing demand for Gensets and rising environmental concerns, the growth of non-diesel Gensets can be exhibited in the coming years. Qatar being a natural gas-rich country is expected to adopt gas-based gensets in the forecast period.Amongst all applications, utilities, oil & gas, and construction & industrial applications dominated the market, where major growth is projected from construction and industrial application. With more than $200 billion to be invested across various applications for the upcoming world cup, the tremendous growth of rental equipment would be witnessed in the country.
Qatar power rental market is anticipated to register sound revenues in the upcoming six years on the back of the rising substantial growth of the oil and gas sector. As the country is attributed as an oil-rich country due to its large-scale production base and also with the increase in the oil and petroleum export practices in the country. In line with this, is leading to increased oil refineries set up for refining and exploration process tends to require high energy, therefore, the adoption for a power source is increasing on rent steadily and is estimated to leave a positive impact on the power rental market growth in the country in the upcoming six years.
Key Highlights of the Report:
• Historical data of Middle East Power Rental Market for the Period 2010-2013.
• Market Size & Forecast of Middle East Power Rental Market until 2020.
• Historical data of Qatar Power Rental Market for the Period 2010-2013.
• Market Size & Forecast of Qatar Power Rental Market until 2020.
• Market Size & Forecast of Qatar Power Rental Market by Genset Types until 2020.
• Market Size & Forecast of Qatar Power Rental Market by KVA ratings until 2020.
• Market Size & Forecast of Qatar Power Rental Market by Applications until 2020.
• Market Size & Forecast of Qatar Power Rental Market by Regions until 2020.
• Market Drivers and Restraints.
• Market Trends.
• Competitive Landscape.
• Key Strategic Pointers.
Markets Covered
The report provides a detailed analysis of the following market segments:
• Gensets Types:
o Diesel Gensets
o Non-Diesel Gensets
• Genset By KVA Ratings:
o Below 100 KVA
o 100.1 KVA- 350 KVA
o 350.1 KVA-750 KVA
o 750 KVA-1000 KVA
o Above 1000 KVA
• Applications:
o Utilities
o Oil & Gas
o Industrial & Construction
o Quarrying and Mining
o Others
• Regions:
o North
o South
Frequently Asked Questions About the Market Study (FAQs):
6Wresearch actively monitors the Qatar Power Rental Market and publishes its comprehensive annual report, highlighting emerging trends, growth drivers, revenue analysis, and forecast outlook. Our insights help businesses to make data-backed strategic decisions with ongoing market dynamics. Our analysts track relevent industries related to the Qatar Power Rental Market, allowing our clients with actionable intelligence and reliable forecasts tailored to emerging regional needs.
Yes, we provide customisation as per your requirements. To learn more, feel free to contact us on sales@6wresearch.com
TABLE OF CONTENTS
Executive Summary
1 Introduction
1.1 Key Highlights of the Report
1.2 Report Description
1.3 Market Scope & Segmentation
1.4 Assumptions and Methodology
2 Middle East Power Rental Market Overview
2.1 Middle East Power Rental Market Revenues
3 Qatar Power Rental Market Overview
3.1 Qatar Power Rental Market Revenues
3.2 Industry Life Cycle
3.3 Porter's 5 Forces Model
3.4 Qatar Power Rental Market Share, By Genset Types
3.5 Qatar Power Rental Market Share, By Genset Ratings
4 Qatar Power Rental Market Dynamics
4.1 Market Drivers
4.1.1 Sports Infrastructure Development
4.1.2 Increasing Construction Market
4.1.3 Increasing Energy Demand
4.2 Market Restraints
4.2.1 High Rental Cost
5 Qatar Power Rental Market Trends
5.1 Growing ICT Industry
5.2 Growing Market for Silent Gensets
5.3 Import of Gensets
5.4 Adoption of Green Gensets
6 Qatar Diesel Genset Rental Market Overview
6.1 Qatar Diesel Genset Rental Market Revenues
7 Qatar Non-Diesel Genset Rental Market Overview
7.1 Qatar Non-Diesel Genset Rental Market Revenues
8 Qatar Power Rental Application Market Overview
8.1 Qatar Power Rental Market Share, By Applications
8.2 Utility Application Market Revenues
8.3 Oil & Gas Application Market Revenues
8.4 Industrial & Construction Application Market Revenues
8.5 Quarrying and Mining Application Market Revenues
8.6 Other Application Market Revenues
9 Qatar Power Rental Regional Market
9.1 Qatar Power Rental Market Share, By Regions
9.2 Northern Region Power Rental Market Revenues
9.3 Southern Region Power Rental Market Revenues
10 Power Rental Trends
10.1 Below 100KVA Gensets Average Rental Price Trend
10.2 100.1KVA-350KVA Gensets Average Rental Price Trend
10.3 350.1KVA-750KVA Gensets Average Rental Price Trend
10.4 750.1KVA-1000KVA Gensets Average Rental Price Trend
10.5 Above 1000KVA Gensets Average Rental Price Trend
11 Company Profiles
11.1 Aggreko Middle East Ltd.
11.2 Byrne Investments Qatar Limited
11.3 Al Reyami Construction Equipment Rental
11.4 Hertz Dayim Equipment Rental
11.5 Nixon Hire Middle East
11.6 Jassim Transport & Stevedoring Co. W.L.L.
11.7 Rental Solutions & Services LLC
11.8 Qatar Building Company Heavy Equipment
11.9 Qatari Industrial Equipment W.L.L.
12 Key Strategic Pointers
13 Disclaimer
List of Figures
Figure 1 Middle East Power Rental Market Revenues, 2010-2020 ($ Million)
Figure 2 GCC Construction Market Share, By Country, 2013 ($ Billion)
Figure 3 Qatar Power Rental Market Revenues, 2010 - 2013 ($ Million)
Figure 4 Qatar Power Rental Market Revenues, 2014 - 2020 ($ Million)
Figure 5 Qatar Power Rental Market- Industry Life Cycle
Figure 6 Qatar Power Rental Market- Porters 5 Forces Model
Figure 7 Qatar Power Rental Market Share, By Revenue, By Genset Types (2013)
Figure 8 Qatar Power Rental Market Share, By Revenue, By Genset Types (2020)
Figure 9 Qatar Oil Production, 2009 - 2013 (Thousand Barrels Per Day)
Figure 10 Qatar Natural Gas Proved Reserves, 2005 - 2013 (Trillion Cubic Meters)
Figure 11 Qatar Power Rental Market Share, By Revenue, By Genset Ratings (2013)
Figure 12 Qatar Power Rental Market Share, By Revenue, By Genset Ratings (2020)
Figure 13 Qatar IT Market Revenues, 2011 - 2020 ($ Billion)
Figure 14 Qatar Power Rental Market Dynamics
Figure 15 Qatar Expected Project Value, 2012-2020 ($ Billion)
Figure 16 Qatar Announced Project Composition (%)
Figure 17 Qatar Electricity Production, 2005-2013 (TWh)
Figure 18 Qatar Power Rental Market Trends
Figure 19 Qatar ICT Market Revenues, 2011-2020 ($ Billion)
Figure 20 Qatar Diesel Genset Rental Revenues, 2010 - 2013 ($ Million)
Figure 21 Qatar Diesel Genset Rental Revenues, 2014 - 2020 ($ Million)
Figure 22 Qatar Hospitality Sector Revenues, 2012-2020 ($ Billion)
Figure 23 Qatar Non-Diesel Gas Genset Rental Revenues, 2010 - 2013 ($ Million)
Figure 24 Qatar Non-Diesel Genset Rental Revenues, 2014 - 2020 ($ Million)
Figure 25 Qatar Natural Gas Production, 2008-2013 (Bcm)
Figure 26 Qatar Power Rental Market Share, By Revenue, By Applications (2013)
Figure 27 Qatar Power Rental Market Share, By Revenue, By Applications (2020)
Figure 28 Qatar Power Rental Market, By Utilities, 2010 - 2013 ($ Million)
Figure 29 Qatar Power Rental Market, By Utilities, 2014 - 2020 ($ Million)
Figure 30 Qatar Electricity Generation, 2005-2013 (Terawatt-hours)
Figure 31 Qatar Power Rental Market, By Oil & Gas, 2010 - 2013 ($ Million)
Figure 32 Qatar Power Rental Market, By Oil & Gas, 2014 - 2020 ($ Million)
Figure 33 GCC Petrochemical Capacity Share, By Country
Figure 34 Qatar Power Rental Market, By I & C , 2010 - 2013 ($ Million)
Figure 35 Qatar Power Rental Market, By I & C , 2014 - 2020 ($ Million)
Figure 36 Qatar Retail Sector Market Revenues, 2012-2019 ($ Billion)
Figure 37 Qatar Power Rental Market Revenues, By Q & M, 2010-2013 ($ Million)
Figure 38 Qatar Power Rental Market Revenues, By Q & M, 2014-2020 ($ Million)
Figure 39 Qatar Mining Sector Contribution in Nominal GDP, 2006-2011 (QR Million)
Figure 40 Qatar Power Rental Market, By Other Application, 2010 - 2013 ($ Million)
Figure 41 Qatar Power Rental Market, By Other Application, 2014 - 2020 ($ Million)
Figure 42 Qatar Mobile Subscribers, 2005-2013 (Million)
Figure 43 Qatar Power Rental Market Share, By Revenue, By Region (2013)
Figure 44 Qatar Power Rental Market Share, By Revenue, By Region (2020)
Figure 45 Northern Qatar Power Rental Market Revenues, 2010 - 2013 ($ Million)
Figure 46 Northern Qatar Power Rental Market Revenues, 2014 - 2020 ($ Million)
Figure 47 Southern Qatar Power Rental Market Revenues, 2010 - 2013 ($ Million)
Figure 48 Southern Qatar Power Rental Market Revenues, 2014 - 2020 ($ Million)
Figure 49 Below 100KVA Gensets Average Rental Price Trend, 2014 - 2020 ($)
Figure 50 100.1KVA-350KVA Gensets Average Rental Price Trend, 2014 - 2020 ($)
Figure 51 350.1KVA-750KVA Gensets Average Rental Price Trend, 2014 - 2020 ($)
Figure 52 750.1KVA-1000KVA Gensets Average Rental Price Trend, 2014 - 2020 ($)
Figure 53 Above 1000KVA Gensets Average Rental Price Trend, 2014 - 2020 ($)
List of Tables
Table 1 Qatar Major Infrastructure Projects
Table 2 Qatar Power Rental Market Revenues, By KVA Ratings, 2010-2013 ($ Million)
Table 3 Qatar Power Rental Market Revenues, By KVA Ratings, 2014-2020 ($ Million)
Table 4 Qatar Sports Infrastructure Projects
Table 5 Qatar Building Construction Project Completion Rank, By Verticals, 2013-2014
Table 6 Qatar Major Construction Activities
Public and private infrastructure development activities are expected to spur the demand for power rental businesses in Qatar. To develop world-class infrastructure for the upcoming FIFA World Cup 2022, the Qatari government has planned to invest more than $200 billion in the coming years. Major construction activities would be exhibited to expand the rail network, road infrastructure, hospitality sector, and stadiums.
In the country, the market is primarily driven by the diesel Genset rental market due to the easy availability of diesel. Continuous supply of diesel fuel has impacted the growth of the market. The key players in the market include RSS, JTC, Byrne Investments, Hertz, Aggreko, Qatar Building Company, Al Reyami, and Qatari Industrial Equipment. In Qatar, the southern region has captured a major share of the pie in overall Qatar's power rental market. Key cities such as Al-Rayyan, Al-Wakrah, and Doha are playing a vital role in the growth of the southern region market. Growing tourism, increasing investments, construction of hotels, airport, stadiums and hospitals and expansion of transportation infrastructure is expected to fuel power rental market in this region.
“Qatar Power Rental Market (2014-2020)” report estimates and forecasts the overall Qatar power rental market by revenue, by generator types such as diesel and non-diesel generators. Market by KVA ratings- Below 100 KVA, 100.1 KVA- 350 KVA, 350.1 KVA-750 KVA, 750 KVA-1000 KVA and Above 1000 KVA. By applications such as utilities, oil & gas, industrial & construction, quarrying and Mining, and others and by regions such as north and south. The report also gives the insights on competitive landscape, market trends, rental trends, company profiles, market drivers, and restraints.
Global Go To Market Strategy - 2030
Export potential enables firms to identify high-growth global markets with greater confidence by combining advanced trade intelligence with a structured quantitative methodology. The framework analyzes emerging demand trends and country-level import patterns while integrating macroeconomic and trade datasets such as GDP and population forecasts, bilateral import–export flows, tariff structures, elasticity differentials between developed and developing economies, geographic distance, and import demand projections. Using weighted trade values from 2020–2024 as the base period to project country-to-country export potential for 2030, these inputs are operationalized through calculated drivers such as gravity model parameters, tariff impact factors, and projected GDP per-capita growth. Through an analysis of hidden potentials, demand hotspots, and market conditions that are most favorable to success, this method enables firms to focus on target countries, maximize returns, and global expansion with data, backed by accuracy.
By factoring in the projected importer demand gap that is currently unmet and could be potential opportunity, it identifies the potential for the Exporter (Country) among 190 countries, against the general trade analysis, which identifies the biggest importer or exporter.
To discover high-growth global markets and optimize your business strategy:
Click Here
Pricing
- Single User License$ 1,995
- Department License$ 2,400
- Site License$ 3,120
- Global License$ 3,795

Leadership Perspectives from Industry Events
Search
Thought Leadership and Analyst Meet


Our Clients
6WResearch In News
- India Export Attractiveness Tracker 2026
- India Air Conditioner Market Set for Strong Rebound in 2026 After Weather-Led Correction and GST-Driven Recovery: 6Wresearch
- ADAS in India: How Automatic Emergency Braking, Blind Spot Detection & Driver Monitoring are Transforming Road Safety
- Doha a strategic location for EV manufacturing hub: IPA Qatar
- Demand for luxury TVs surging in the GCC, says Samsung
- Empowering Growth: The Thriving Journey of Bangladesh’s Cable Industry
Latest Reports
- Nicaragua RPG Gaming Market (2026-2032)
- New Zealand RPG Gaming Market (2026-2032)
- Netherlands RPG Gaming Market (2026-2032)
- Nauru RPG Gaming Market (2026-2032)
- Namibia RPG Gaming Market (2026-2032)
- Mozambique RPG Gaming Market (2026-2032)
- Montenegro RPG Gaming Market (2026-2032)
- Mongolia RPG Gaming Market (2026-2032)
- Monaco RPG Gaming Market (2026-2032)
- Micronesia RPG Gaming Market (2026-2032)
Industry Events and Analyst Meet

EV India Expo 2026

HIMTEX 2026

India Refining Summit 2026

India EV Show 2026

EV tech India Expo 2026
Whitepaper
- Middle East & Africa Commercial Security Market Click here to view more.
- Middle East & Africa Fire Safety Systems & Equipment Market Click here to view more.
- GCC Drone Market Click here to view more.
- Middle East Lighting Fixture Market Click here to view more.
- GCC Physical & Perimeter Security Market Click here to view more.