Denmark Para Aramid Fibers Market (2026-2032) | Competitive, Challenges, Size, Segmentation, Forecast, Restraints, Share, Revenue, Strategy, Demand, Growth, Outlook, Trends, Value, Pricing Analysis, Companies, Analysis, Opportunities, Competition, Investment Trends, Drivers, Strategic Insights, Segments, Consumer Insights, Industry, Supply
Market Forecast By Type (Meta-Aramid Fibers, Para-Aramid Fibers, Short-Cut Aramid Fibers, Pulp Aramid Fibers), By Form (Staple, Filament, Chopped, Pulp), By Application (Heat-Resistant Clothing, Bulletproof Vests, Composite Materials, Automotive Brake Pads), By End User (Firefighting & Military, Defense & Law Enforcement, Aerospace Industry, Automotive Industry) And Competitive Landscape
| Product Code: ETC13069592 | Publication Date: Apr 2025 | Updated Date: Apr 2026 | Product Type: Market Research Report | |
| Publisher: 6Wresearch | Author: Sachin Kumar Rai | No. of Pages: 65 | No. of Figures: 34 | No. of Tables: 19 |
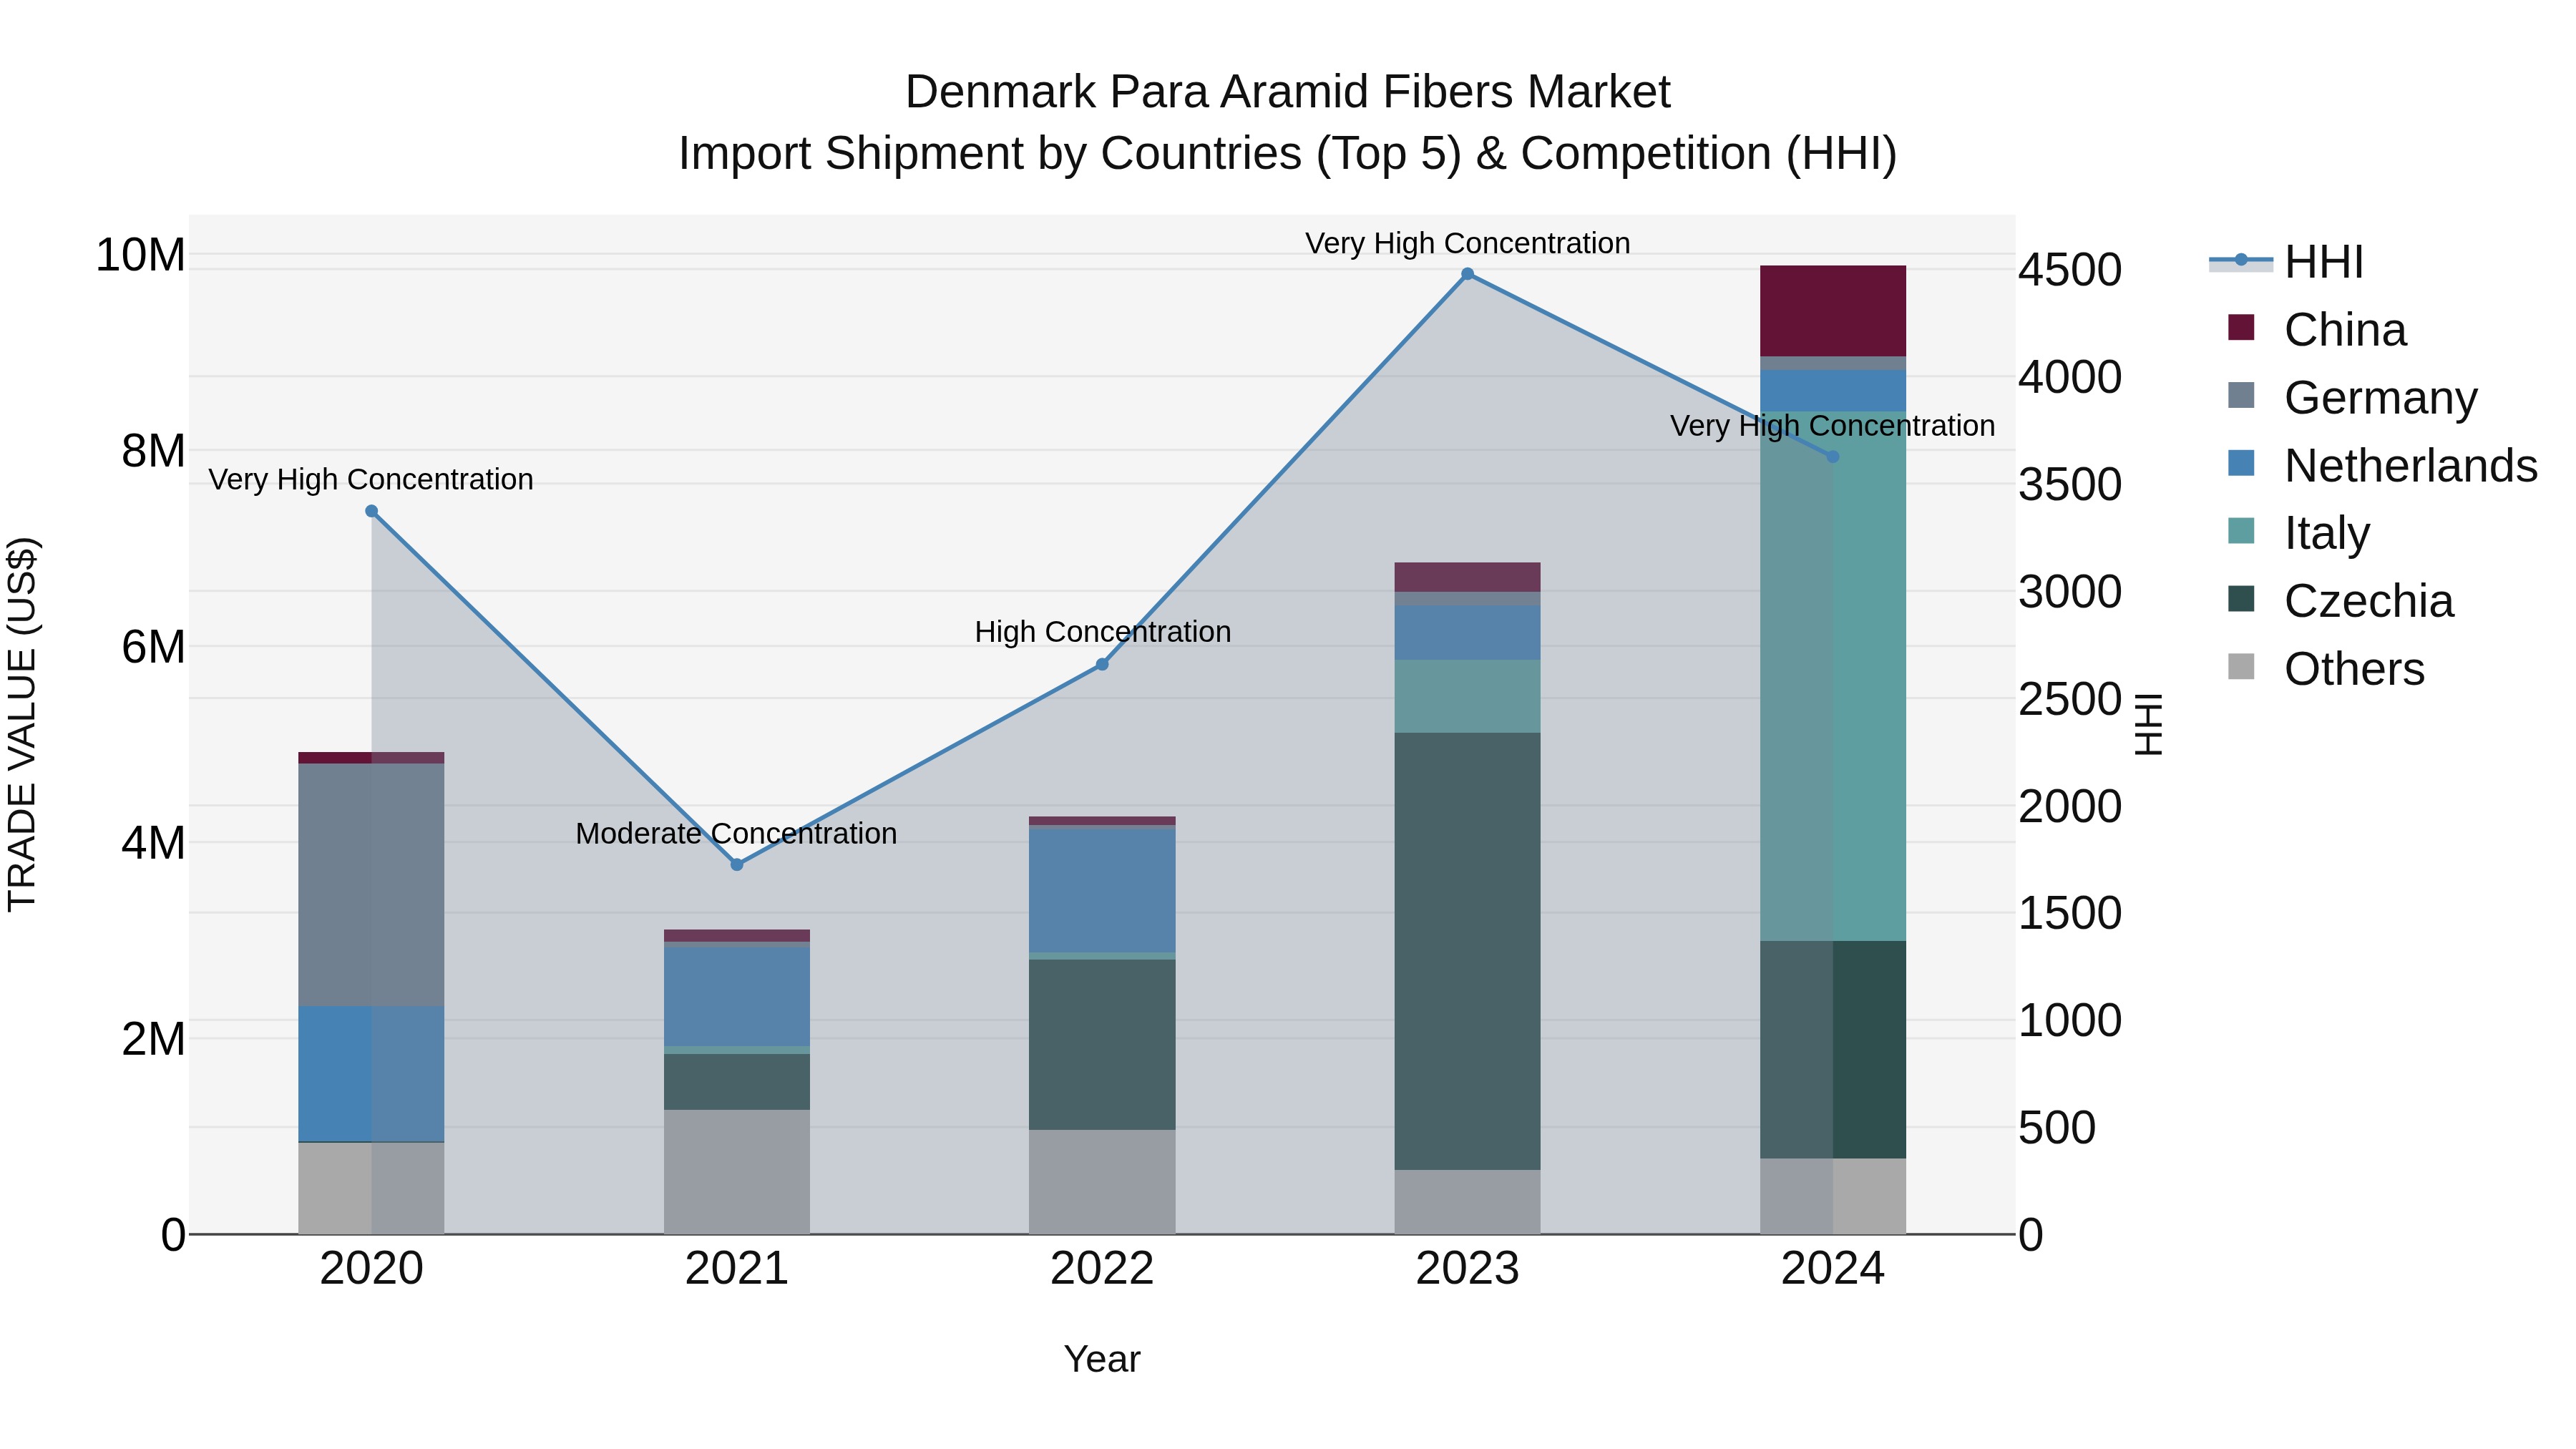
Denmark Para Aramid Fibers Market Top 5 Importing Countries and Market Competition (HHI) Analysis
Denmark para-aramid fibers import market in 2024 saw significant contributions from top exporting countries including Italy, Czechia, China, Spain, and Netherlands. The market displayed a high level of concentration with a high Herfindahl-Hirschman Index (HHI). The compound annual growth rate (CAGR) from 2020 to 2024 stood at an impressive 19.05%, indicating a robust expansion trend. Moreover, the growth rate surged even further from 2023 to 2024, reaching 44.18%, reflecting a rapid acceleration in import shipments of para-aramid fibers into Denmark.
Key Highlights of the Report:
- Denmark Para Aramid Fibers Market Outlook
- Market Size of Denmark Para Aramid Fibers Market, 2025
- Forecast of Denmark Para Aramid Fibers Market, 2032
- Historical Data and Forecast of Denmark Para Aramid Fibers Revenues & Volume for the Period 2022 - 2032F
- Denmark Para Aramid Fibers Market Trend Evolution
- Denmark Para Aramid Fibers Market Drivers and Challenges
- Denmark Para Aramid Fibers Price Trends
- Denmark Para Aramid Fibers Porter's Five Forces
- Denmark Para Aramid Fibers Industry Life Cycle
- Historical Data and Forecast of Denmark Para Aramid Fibers Market Revenues & Volume By Type for the Period 2022 - 2032F
- Historical Data and Forecast of Denmark Para Aramid Fibers Market Revenues & Volume By Meta-Aramid Fibers for the Period 2022 - 2032F
- Historical Data and Forecast of Denmark Para Aramid Fibers Market Revenues & Volume By Para-Aramid Fibers for the Period 2022 - 2032F
- Historical Data and Forecast of Denmark Para Aramid Fibers Market Revenues & Volume By Short-Cut Aramid Fibers for the Period 2022 - 2032F
- Historical Data and Forecast of Denmark Para Aramid Fibers Market Revenues & Volume By Pulp Aramid Fibers for the Period 2022 - 2032F
- Historical Data and Forecast of Denmark Para Aramid Fibers Market Revenues & Volume By Form for the Period 2022 - 2032F
- Historical Data and Forecast of Denmark Para Aramid Fibers Market Revenues & Volume By Staple for the Period 2022 - 2032F
- Historical Data and Forecast of Denmark Para Aramid Fibers Market Revenues & Volume By Filament for the Period 2022 - 2032F
- Historical Data and Forecast of Denmark Para Aramid Fibers Market Revenues & Volume By Chopped for the Period 2022 - 2032F
- Historical Data and Forecast of Denmark Para Aramid Fibers Market Revenues & Volume By Pulp for the Period 2022 - 2032F
- Historical Data and Forecast of Denmark Para Aramid Fibers Market Revenues & Volume By Application for the Period 2022 - 2032F
- Historical Data and Forecast of Denmark Para Aramid Fibers Market Revenues & Volume By Heat-Resistant Clothing for the Period 2022 - 2032F
- Historical Data and Forecast of Denmark Para Aramid Fibers Market Revenues & Volume By Bulletproof Vests for the Period 2022 - 2032F
- Historical Data and Forecast of Denmark Para Aramid Fibers Market Revenues & Volume By Composite Materials for the Period 2022 - 2032F
- Historical Data and Forecast of Denmark Para Aramid Fibers Market Revenues & Volume By Automotive Brake Pads for the Period 2022 - 2032F
- Historical Data and Forecast of Denmark Para Aramid Fibers Market Revenues & Volume By End User for the Period 2022 - 2032F
- Historical Data and Forecast of Denmark Para Aramid Fibers Market Revenues & Volume By Firefighting & Military for the Period 2022 - 2032F
- Historical Data and Forecast of Denmark Para Aramid Fibers Market Revenues & Volume By Defense & Law Enforcement for the Period 2022 - 2032F
- Historical Data and Forecast of Denmark Para Aramid Fibers Market Revenues & Volume By Aerospace Industry for the Period 2022 - 2032F
- Historical Data and Forecast of Denmark Para Aramid Fibers Market Revenues & Volume By Automotive Industry for the Period 2022 - 2032F
- Denmark Para Aramid Fibers Import Export Trade Statistics
- Market Opportunity Assessment By Type
- Market Opportunity Assessment By Form
- Market Opportunity Assessment By Application
- Market Opportunity Assessment By End User
- Denmark Para Aramid Fibers Top Companies Market Share
- Denmark Para Aramid Fibers Competitive Benchmarking By Technical and Operational Parameters
- Denmark Para Aramid Fibers Company Profiles
- Denmark Para Aramid Fibers Key Strategic Recommendations
Frequently Asked Questions About the Market Study (FAQs):
6Wresearch actively monitors the Denmark Para Aramid Fibers Market and publishes its comprehensive annual report, highlighting emerging trends, growth drivers, revenue analysis, and forecast outlook. Our insights help businesses to make data-backed strategic decisions with ongoing market dynamics. Our analysts track relevent industries related to the Denmark Para Aramid Fibers Market, allowing our clients with actionable intelligence and reliable forecasts tailored to emerging regional needs.
Yes, we provide customisation as per your requirements. To learn more, feel free to contact us on sales@6wresearch.com
1 Executive Summary |
2 Introduction |
2.1 Key Highlights of the Report |
2.2 Report Description |
2.3 Market Scope & Segmentation |
2.4 Research Methodology |
2.5 Assumptions |
3 Denmark Para Aramid Fibers Market Overview |
3.1 Denmark Country Macro Economic Indicators |
3.2 Denmark Para Aramid Fibers Market Revenues & Volume, 2022 & 2032F |
3.3 Denmark Para Aramid Fibers Market - Industry Life Cycle |
3.4 Denmark Para Aramid Fibers Market - Porter's Five Forces |
3.5 Denmark Para Aramid Fibers Market Revenues & Volume Share, By Type, 2022 & 2032F |
3.6 Denmark Para Aramid Fibers Market Revenues & Volume Share, By Form, 2022 & 2032F |
3.7 Denmark Para Aramid Fibers Market Revenues & Volume Share, By Application, 2022 & 2032F |
3.8 Denmark Para Aramid Fibers Market Revenues & Volume Share, By End User, 2022 & 2032F |
4 Denmark Para Aramid Fibers Market Dynamics |
4.1 Impact Analysis |
4.2 Market Drivers |
4.2.1 Increasing demand for lightweight and high-performance materials in various industries such as aerospace, automotive, and defense. |
4.2.2 Growing emphasis on safety and protection in the workplace, driving the demand for para-aramid fibers in personal protective equipment (PPE). |
4.2.3 Rising investments in research and development to enhance the properties and applications of para-aramid fibers. |
4.3 Market Restraints |
4.3.1 Fluctuating raw material prices impacting the production cost of para-aramid fibers. |
4.3.2 Intense competition from other high-performance fibers like carbon fiber and high-density polyethylene, limiting market growth. |
4.3.3 Stringent regulations and standards governing the use of para-aramid fibers in different applications, posing challenges for market expansion. |
5 Denmark Para Aramid Fibers Market Trends |
6 Denmark Para Aramid Fibers Market, By Types |
6.1 Denmark Para Aramid Fibers Market, By Type |
6.1.1 Overview and Analysis |
6.1.2 Denmark Para Aramid Fibers Market Revenues & Volume, By Type, 2022 - 2032F |
6.1.3 Denmark Para Aramid Fibers Market Revenues & Volume, By Meta-Aramid Fibers, 2022 - 2032F |
6.1.4 Denmark Para Aramid Fibers Market Revenues & Volume, By Para-Aramid Fibers, 2022 - 2032F |
6.1.5 Denmark Para Aramid Fibers Market Revenues & Volume, By Short-Cut Aramid Fibers, 2022 - 2032F |
6.1.6 Denmark Para Aramid Fibers Market Revenues & Volume, By Pulp Aramid Fibers, 2022 - 2032F |
6.2 Denmark Para Aramid Fibers Market, By Form |
6.2.1 Overview and Analysis |
6.2.2 Denmark Para Aramid Fibers Market Revenues & Volume, By Staple, 2022 - 2032F |
6.2.3 Denmark Para Aramid Fibers Market Revenues & Volume, By Filament, 2022 - 2032F |
6.2.4 Denmark Para Aramid Fibers Market Revenues & Volume, By Chopped, 2022 - 2032F |
6.2.5 Denmark Para Aramid Fibers Market Revenues & Volume, By Pulp, 2022 - 2032F |
6.3 Denmark Para Aramid Fibers Market, By Application |
6.3.1 Overview and Analysis |
6.3.2 Denmark Para Aramid Fibers Market Revenues & Volume, By Heat-Resistant Clothing, 2022 - 2032F |
6.3.3 Denmark Para Aramid Fibers Market Revenues & Volume, By Bulletproof Vests, 2022 - 2032F |
6.3.4 Denmark Para Aramid Fibers Market Revenues & Volume, By Composite Materials, 2022 - 2032F |
6.3.5 Denmark Para Aramid Fibers Market Revenues & Volume, By Automotive Brake Pads, 2022 - 2032F |
6.4 Denmark Para Aramid Fibers Market, By End User |
6.4.1 Overview and Analysis |
6.4.2 Denmark Para Aramid Fibers Market Revenues & Volume, By Firefighting & Military, 2022 - 2032F |
6.4.3 Denmark Para Aramid Fibers Market Revenues & Volume, By Defense & Law Enforcement, 2022 - 2032F |
6.4.4 Denmark Para Aramid Fibers Market Revenues & Volume, By Aerospace Industry, 2022 - 2032F |
6.4.5 Denmark Para Aramid Fibers Market Revenues & Volume, By Automotive Industry, 2022 - 2032F |
7 Denmark Para Aramid Fibers Market Import-Export Trade Statistics |
7.1 Denmark Para Aramid Fibers Market Export to Major Countries |
7.2 Denmark Para Aramid Fibers Market Imports from Major Countries |
8 Denmark Para Aramid Fibers Market Key Performance Indicators |
8.1 Innovation index measuring the introduction of new products or technologies in the para-aramid fibers market. |
8.2 Adoption rate of para-aramid fibers in emerging applications or industries. |
8.3 Environmental sustainability metrics related to the production processes and materials used in para-aramid fiber manufacturing. |
9 Denmark Para Aramid Fibers Market - Opportunity Assessment |
9.1 Denmark Para Aramid Fibers Market Opportunity Assessment, By Type, 2022 & 2032F |
9.2 Denmark Para Aramid Fibers Market Opportunity Assessment, By Form, 2022 & 2032F |
9.3 Denmark Para Aramid Fibers Market Opportunity Assessment, By Application, 2022 & 2032F |
9.4 Denmark Para Aramid Fibers Market Opportunity Assessment, By End User, 2022 & 2032F |
10 Denmark Para Aramid Fibers Market - Competitive Landscape |
10.1 Denmark Para Aramid Fibers Market Revenue Share, By Companies, 2025 |
10.2 Denmark Para Aramid Fibers Market Competitive Benchmarking, By Operating and Technical Parameters |
11 Company Profiles |
12 Recommendations |
13 Disclaimer |
Export potential assessment - trade Analytics for 2030
Export potential enables firms to identify high-growth global markets with greater confidence by combining advanced trade intelligence with a structured quantitative methodology. The framework analyzes emerging demand trends and country-level import patterns while integrating macroeconomic and trade datasets such as GDP and population forecasts, bilateral import–export flows, tariff structures, elasticity differentials between developed and developing economies, geographic distance, and import demand projections. Using weighted trade values from 2020–2024 as the base period to project country-to-country export potential for 2030, these inputs are operationalized through calculated drivers such as gravity model parameters, tariff impact factors, and projected GDP per-capita growth. Through an analysis of hidden potentials, demand hotspots, and market conditions that are most favorable to success, this method enables firms to focus on target countries, maximize returns, and global expansion with data, backed by accuracy.
By factoring in the projected importer demand gap that is currently unmet and could be potential opportunity, it identifies the potential for the Exporter (Country) among 190 countries, against the general trade analysis, which identifies the biggest importer or exporter.
To discover high-growth global markets and optimize your business strategy:
Click Here
Pricing
- Single User License$ 1,995
- Department License$ 2,400
- Site License$ 3,120
- Global License$ 3,795

Search
Thought Leadership and Analyst Meet


Our Clients
Latest Reports
- Philippines Polyhydroxybutyrate-co-Hydroxyvalerate Market (2026-2032) | Trends, Insights, Challenges, Restraints, Competition, Size, Value, Forecast, Pricing, Share, Outlook, Revenue, Investment Opportunities, Strategy, Drivers, Demand, Growth, segmentation, Analysis, Companies
- Peru Polyhydroxybutyrate-co-Hydroxyvalerate Market (2026-2032) | Growth, Demand, Challenges, Share, Trends, Analysis, Pricing, Investment Opportunities, Drivers, Value, Forecast, Competition, Size, Companies, Insights, Outlook, Restraints, segmentation, Revenue, Strategy
- Pakistan Polyhydroxybutyrate-co-Hydroxyvalerate Market (2026-2032) | Restraints, segmentation, Pricing, Forecast, Share, Strategy, Competition, Trends, Insights, Drivers, Challenges, Growth, Revenue, Outlook, Value, Investment Opportunities, Companies, Size, Analysis, Demand
- Oman Polyhydroxybutyrate-co-Hydroxyvalerate Market (2026-2032) | Drivers, segmentation, Insights, Competition, Pricing, Outlook, Size, Revenue, Challenges, Forecast, Analysis, Growth, Value, Share, Trends, Investment Opportunities, Strategy, Restraints, Companies, Demand
- Nigeria Polyhydroxybutyrate-co-Hydroxyvalerate Market (2026-2032) | Value, Investment Opportunities, Analysis, Revenue, Restraints, Pricing, Outlook, Competition, Demand, Growth, Forecast, Companies, Trends, Challenges, segmentation, Drivers, Insights, Share, Size, Strategy
- Nepal Polyhydroxybutyrate-co-Hydroxyvalerate Market (2026-2032) | Insights, Analysis, Drivers, Share, Revenue, Demand, segmentation, Investment Opportunities, Competition, Forecast, Growth, Pricing, Companies, Strategy, Trends, Restraints, Challenges, Outlook, Size, Value
- Myanmar Polyhydroxybutyrate-co-Hydroxyvalerate Market (2026-2032) | Outlook, Revenue, Strategy, Restraints, Drivers, segmentation, Share, Forecast, Competition, Insights, Growth, Pricing, Size, Demand, Value, Companies, Trends, Challenges, Investment Opportunities, Analysis
- Morocco Polyhydroxybutyrate-co-Hydroxyvalerate Market (2026-2032) | Outlook, Investment Opportunities, Restraints, Strategy, Forecast, Challenges, Drivers, Growth, Companies, segmentation, Trends, Size, Competition, Revenue, Demand, Insights, Share, Analysis, Value, Pricing
- Mexico Polyhydroxybutyrate-co-Hydroxyvalerate Market (2026-2032) | Size, Drivers, Outlook, Share, Strategy, Growth, Pricing, Challenges, Companies, Demand, Value, Investment Opportunities, Restraints, Trends, Forecast, segmentation, Analysis, Insights, Competition, Revenue
- Malaysia Polyhydroxybutyrate-co-Hydroxyvalerate Market (2026-2032) | Share, segmentation, Size, Companies, Analysis, Insights, Forecast, Value, Revenue, Drivers, Restraints, Challenges, Investment Opportunities, Trends, Competition, Strategy, Demand, Growth, Outlook, Pricing
Industry Events and Analyst Meet

HIMTEX 2026

India Refining Summit 2026

India EV Show 2026

EV tech India Expo 2026

Auto Tech Asia 2026
Whitepaper
- Middle East & Africa Commercial Security Market Click here to view more.
- Middle East & Africa Fire Safety Systems & Equipment Market Click here to view more.
- GCC Drone Market Click here to view more.
- Middle East Lighting Fixture Market Click here to view more.
- GCC Physical & Perimeter Security Market Click here to view more.
6WResearch In News
- Doha a strategic location for EV manufacturing hub: IPA Qatar
- Demand for luxury TVs surging in the GCC, says Samsung
- Empowering Growth: The Thriving Journey of Bangladesh’s Cable Industry
- Demand for luxury TVs surging in the GCC, says Samsung
- Video call with a traditional healer? Once unthinkable, it’s now common in South Africa
- Intelligent Buildings To Smooth GCC’s Path To Net Zero