Grenada Table linen Market (2025-2031) | Forecast, Size, Value, Companies, Outlook, Revenue, Analysis, Trends, Segmentation, Industry, Growth & Share
Market Forecast By Material (Cotton, Artificial Fibers, Linen Silk, Others), By Application (Residential, Commercial), By Distribution Channel (Hypermarket/Supermarket, Specialty Stores, Online) And Competitive Landscape
| Product Code: ETC5524175 | Publication Date: Nov 2023 | Updated Date: Oct 2025 | Product Type: Market Research Report | |
| Publisher: 6Wresearch | Author: Ravi Bhandari | No. of Pages: 60 | No. of Figures: 30 | No. of Tables: 5 |
Grenada Table Linen Market Top 5 Importing Countries and Market Competition (HHI) Analysis
Grenada`s table linen import market continues to thrive in 2024, with the USA, UK, Jamaica, Trinidad and Tobago, and Panama dominating as the top exporting countries. The high Herfindahl-Hirschman Index (HHI) indicates a concentrated market, suggesting strong competition among these key players. The impressive Compound Annual Growth Rate (CAGR) of 39.67% from 2020 to 2024 reflects the robust expansion of the market. Furthermore, the remarkable growth rate of 115.38% from 2023 to 2024 underscores the accelerating pace of development in the Grenada table linen import industry.
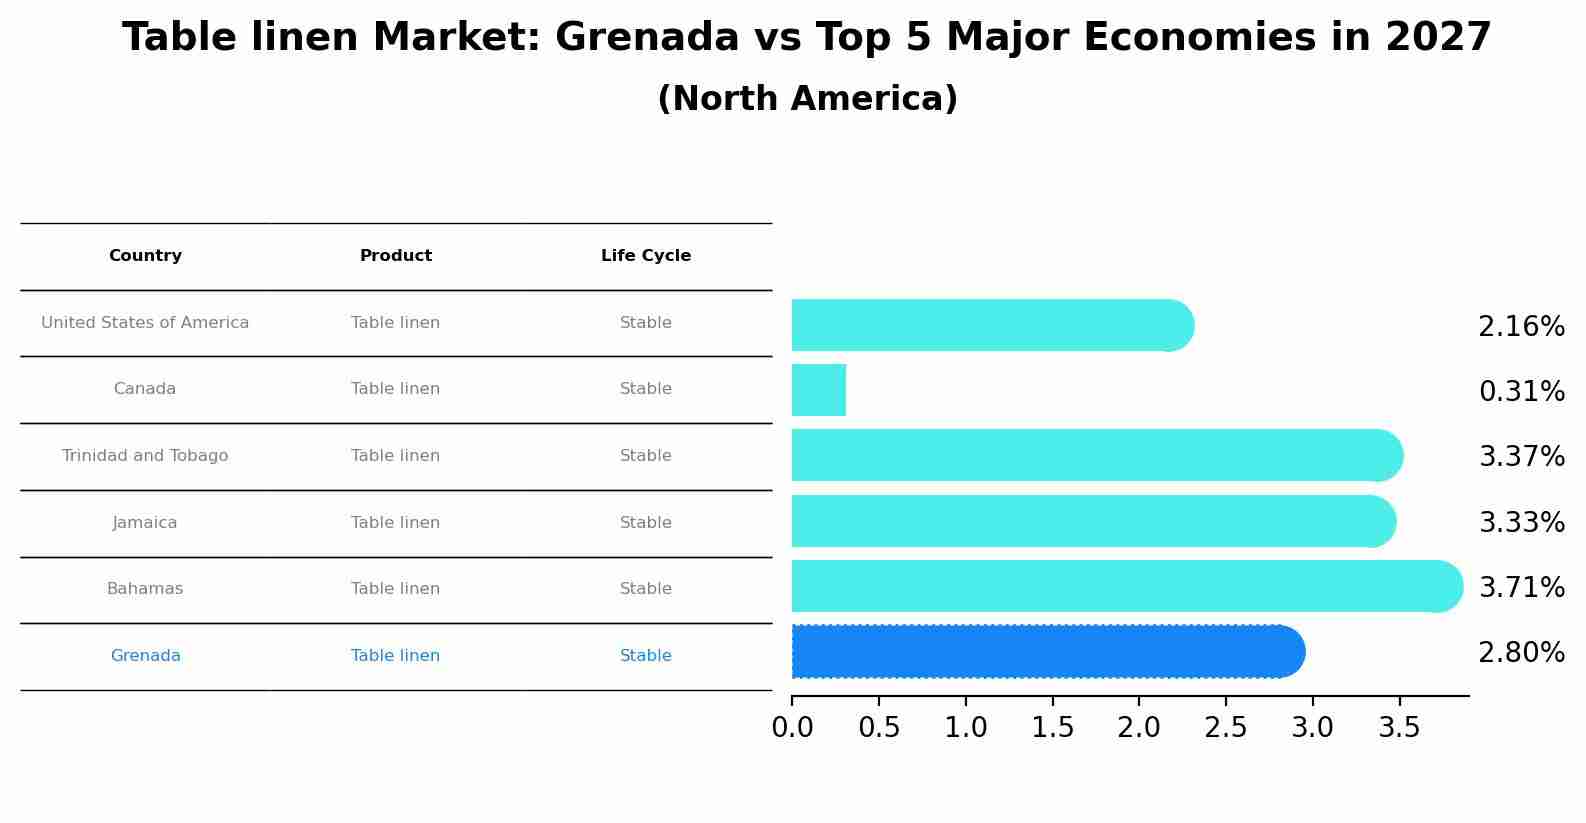
Table linen Market: Grenada vs Top 5 Major Economies in 2027 (North America)
Grenada's Table linen market is anticipated to experience a stable growth rate of 2.80% by 2027, reflecting trends observed in the largest economy United States of America, followed by Canada, Trinidad and Tobago, Jamaica and Bahamas.
Key Highlights of the Report:
- Grenada Table linen Market Outlook
- Market Size of Grenada Table linen Market, 2024
- Forecast of Grenada Table linen Market, 2031
- Historical Data and Forecast of Grenada Table linen Revenues & Volume for the Period 2021-2031
- Grenada Table linen Market Trend Evolution
- Grenada Table linen Market Drivers and Challenges
- Grenada Table linen Price Trends
- Grenada Table linen Porter`s Five Forces
- Grenada Table linen Industry Life Cycle
- Historical Data and Forecast of Grenada Table linen Market Revenues & Volume By Material for the Period 2021-2031
- Historical Data and Forecast of Grenada Table linen Market Revenues & Volume By Cotton for the Period 2021-2031
- Historical Data and Forecast of Grenada Table linen Market Revenues & Volume By Artificial Fibers for the Period 2021-2031
- Historical Data and Forecast of Grenada Table linen Market Revenues & Volume By Linen Silk for the Period 2021-2031
- Historical Data and Forecast of Grenada Table linen Market Revenues & Volume By Others for the Period 2021-2031
- Historical Data and Forecast of Grenada Table linen Market Revenues & Volume By Application for the Period 2021-2031
- Historical Data and Forecast of Grenada Table linen Market Revenues & Volume By Residential for the Period 2021-2031
- Historical Data and Forecast of Grenada Table linen Market Revenues & Volume By Commercial for the Period 2021-2031
- Historical Data and Forecast of Grenada Table linen Market Revenues & Volume By Distribution Channel for the Period 2021-2031
- Historical Data and Forecast of Grenada Table linen Market Revenues & Volume By Hypermarket/Supermarket for the Period 2021-2031
- Historical Data and Forecast of Grenada Table linen Market Revenues & Volume By Specialty Stores for the Period 2021-2031
- Historical Data and Forecast of Grenada Table linen Market Revenues & Volume By Online for the Period 2021-2031
- Grenada Table linen Import Export Trade Statistics
- Market Opportunity Assessment By Material
- Market Opportunity Assessment By Application
- Market Opportunity Assessment By Distribution Channel
- Grenada Table linen Top Companies Market Share
- Grenada Table linen Competitive Benchmarking By Technical and Operational Parameters
- Grenada Table linen Company Profiles
- Grenada Table linen Key Strategic Recommendations
Frequently Asked Questions About the Market Study (FAQs):
6Wresearch actively monitors the Grenada Table linen Market and publishes its comprehensive annual report, highlighting emerging trends, growth drivers, revenue analysis, and forecast outlook. Our insights help businesses to make data-backed strategic decisions with ongoing market dynamics. Our analysts track relevent industries related to the Grenada Table linen Market, allowing our clients with actionable intelligence and reliable forecasts tailored to emerging regional needs.
Yes, we provide customisation as per your requirements. To learn more, feel free to contact us on sales@6wresearch.com
1 Executive Summary |
2 Introduction |
2.1 Key Highlights of the Report |
2.2 Report Description |
2.3 Market Scope & Segmentation |
2.4 Research Methodology |
2.5 Assumptions |
3 Grenada Table linen Market Overview |
3.1 Grenada Country Macro Economic Indicators |
3.2 Grenada Table linen Market Revenues & Volume, 2021 & 2031F |
3.3 Grenada Table linen Market - Industry Life Cycle |
3.4 Grenada Table linen Market - Porter's Five Forces |
3.5 Grenada Table linen Market Revenues & Volume Share, By Material, 2021 & 2031F |
3.6 Grenada Table linen Market Revenues & Volume Share, By Application, 2021 & 2031F |
3.7 Grenada Table linen Market Revenues & Volume Share, By Distribution Channel, 2021 & 2031F |
4 Grenada Table linen Market Dynamics |
4.1 Impact Analysis |
4.2 Market Drivers |
4.2.1 Growing trend towards home dining experiences and entertaining, leading to increased demand for table linens. |
4.2.2 Rising disposable income levels in Grenada, allowing consumers to spend more on luxury and decorative items like table linens. |
4.2.3 Increasing focus on interior decoration and home styling among consumers, driving the demand for aesthetically pleasing table linens. |
4.3 Market Restraints |
4.3.1 Seasonal demand fluctuations due to variations in festive seasons and cultural celebrations impacting the sales of table linens. |
4.3.2 Competition from alternative dining and table setting options such as disposable tableware and synthetic fabrics, affecting the market for traditional table linens. |
5 Grenada Table linen Market Trends |
6 Grenada Table linen Market Segmentations |
6.1 Grenada Table linen Market, By Material |
6.1.1 Overview and Analysis |
6.1.2 Grenada Table linen Market Revenues & Volume, By Cotton, 2021-2031F |
6.1.3 Grenada Table linen Market Revenues & Volume, By Artificial Fibers, 2021-2031F |
6.1.4 Grenada Table linen Market Revenues & Volume, By Linen Silk, 2021-2031F |
6.1.5 Grenada Table linen Market Revenues & Volume, By Others, 2021-2031F |
6.2 Grenada Table linen Market, By Application |
6.2.1 Overview and Analysis |
6.2.2 Grenada Table linen Market Revenues & Volume, By Residential, 2021-2031F |
6.2.3 Grenada Table linen Market Revenues & Volume, By Commercial, 2021-2031F |
6.3 Grenada Table linen Market, By Distribution Channel |
6.3.1 Overview and Analysis |
6.3.2 Grenada Table linen Market Revenues & Volume, By Hypermarket/Supermarket, 2021-2031F |
6.3.3 Grenada Table linen Market Revenues & Volume, By Specialty Stores, 2021-2031F |
6.3.4 Grenada Table linen Market Revenues & Volume, By Online, 2021-2031F |
7 Grenada Table linen Market Import-Export Trade Statistics |
7.1 Grenada Table linen Market Export to Major Countries |
7.2 Grenada Table linen Market Imports from Major Countries |
8 Grenada Table linen Market Key Performance Indicators |
8.1 Average order value (AOV) per customer for table linen purchases. |
8.2 Customer retention rate and repeat purchase frequency of table linens. |
8.3 Social media engagement and online presence metrics indicating consumer interest and trends in table linen designs. |
8.4 Number of partnerships and collaborations with home decor influencers or interior designers to promote table linen products. |
8.5 Sustainability metrics such as percentage of eco-friendly materials used in table linen production and carbon footprint reduction initiatives. |
9 Grenada Table linen Market - Opportunity Assessment |
9.1 Grenada Table linen Market Opportunity Assessment, By Material, 2021 & 2031F |
9.2 Grenada Table linen Market Opportunity Assessment, By Application, 2021 & 2031F |
9.3 Grenada Table linen Market Opportunity Assessment, By Distribution Channel, 2021 & 2031F |
10 Grenada Table linen Market - Competitive Landscape |
10.1 Grenada Table linen Market Revenue Share, By Companies, 2024 |
10.2 Grenada Table linen Market Competitive Benchmarking, By Operating and Technical Parameters |
11 Company Profiles |
12 Recommendations | 13 Disclaimer |
Export potential assessment - trade Analytics for 2030
Export potential enables firms to identify high-growth global markets with greater confidence by combining advanced trade intelligence with a structured quantitative methodology. The framework analyzes emerging demand trends and country-level import patterns while integrating macroeconomic and trade datasets such as GDP and population forecasts, bilateral import–export flows, tariff structures, elasticity differentials between developed and developing economies, geographic distance, and import demand projections. Using weighted trade values from 2020–2024 as the base period to project country-to-country export potential for 2030, these inputs are operationalized through calculated drivers such as gravity model parameters, tariff impact factors, and projected GDP per-capita growth. Through an analysis of hidden potentials, demand hotspots, and market conditions that are most favorable to success, this method enables firms to focus on target countries, maximize returns, and global expansion with data, backed by accuracy.
By factoring in the projected importer demand gap that is currently unmet and could be potential opportunity, it identifies the potential for the Exporter (Country) among 190 countries, against the general trade analysis, which identifies the biggest importer or exporter.
To discover high-growth global markets and optimize your business strategy:
Click Here
Pricing
- Single User License$ 1,995
- Department License$ 2,400
- Site License$ 3,120
- Global License$ 3,795

Search
Thought Leadership and Analyst Meet


Our Clients
Related Reports
- Saudi Arabia Car Window Tinting Film, Paint Protection Film (PPF), and Ceramic Coating Market (2025-2031) | Strategy, Consumer Insights, Analysis, Investment Trends, Opportunities, Growth, Size, Share, Industry, Revenue, Segments, Value, Segmentation, Supply, Forecast, Restraints, Outlook, Competition, Drivers, Trends, Demand, Pricing Analysis, Competitive, Strategic Insights, Companies, Challenges
- South Africa Stationery Market (2025-2031) | Share, Size, Industry, Value, Growth, Revenue, Analysis, Trends, Segmentation & Outlook
- Afghanistan Rocking Chairs And Adirondack Chairs Market (2026-2032) | Size & Revenue, Competitive Landscape, Share, Segmentation, Industry, Value, Outlook, Analysis, Trends, Growth, Forecast, Companies
- Afghanistan Apparel Market (2026-2032) | Growth, Outlook, Industry, Segmentation, Forecast, Size, Companies, Trends, Value, Share, Analysis & Revenue
- Canada Oil and Gas Market (2026-2032) | Share, Segmentation, Value, Industry, Trends, Forecast, Analysis, Size & Revenue, Growth, Competitive Landscape, Outlook, Companies
- Germany Breakfast Food Market (2026-2032) | Industry, Share, Growth, Size, Companies, Value, Analysis, Revenue, Trends, Forecast & Outlook
- Australia Briquette Market (2025-2031) | Growth, Size, Revenue, Forecast, Analysis, Trends, Value, Share, Industry & Companies
- Vietnam System Integrator Market (2026-2032) | Size, Companies, Analysis, Industry, Value, Forecast, Growth, Trends, Revenue & Share
- ASEAN and Thailand Brain Health Supplements Market (2025-2031) | Strategy, Consumer Insights, Analysis, Investment Trends, Opportunities, Growth, Size, Share, Industry, Revenue, Segments, Value, Segmentation, Supply, Forecast, Restraints, Outlook, Competition, Drivers, Trends, Demand, Pricing Analysis, Competitive, Strategic Insights, Companies, Challenges
- ASEAN Bearings Market (2025-2031) | Strategy, Consumer Insights, Analysis, Investment Trends, Opportunities, Growth, Size, Share, Industry, Revenue, Segments, Value, Segmentation, Supply, Forecast, Restraints, Outlook, Competition, Drivers, Trends, Demand, Pricing Analysis, Competitive, Strategic Insights, Companies, Challenges
Industry Events and Analyst Meet

Stationery & Paper Expo Saudi Arabia 2026

Kids & Toys Expo Saudi Arabia 2026

Gifts & Homeware Expo Saudi Arabia 2026

Smart Home Expo 2026

Industrial Facilities Management Expo 2025
Whitepaper
- Middle East & Africa Commercial Security Market Click here to view more.
- Middle East & Africa Fire Safety Systems & Equipment Market Click here to view more.
- GCC Drone Market Click here to view more.
- Middle East Lighting Fixture Market Click here to view more.
- GCC Physical & Perimeter Security Market Click here to view more.
6WResearch In News
- Doha a strategic location for EV manufacturing hub: IPA Qatar
- Demand for luxury TVs surging in the GCC, says Samsung
- Empowering Growth: The Thriving Journey of Bangladesh’s Cable Industry
- Demand for luxury TVs surging in the GCC, says Samsung
- Video call with a traditional healer? Once unthinkable, it’s now common in South Africa
- Intelligent Buildings To Smooth GCC’s Path To Net Zero