Hungary Milk Replacers Market (2025-2031) Outlook | Growth, Share, Forecast, Companies, Value, Size, Revenue, Analysis, Trends & Industry
Market Forecast By Type (Medicated, Non-Medicated), By Livestock (Ruminants, Swine), By Source (Milk-based, Non milk-based, Blended) And Competitive Landscape
| Product Code: ETC4596560 | Publication Date: Jul 2023 | Updated Date: Jan 2026 | Product Type: Report | |
| Publisher: 6Wresearch | Author: Ravi Bhandari | No. of Pages: 85 | No. of Figures: 45 | No. of Tables: 25 |
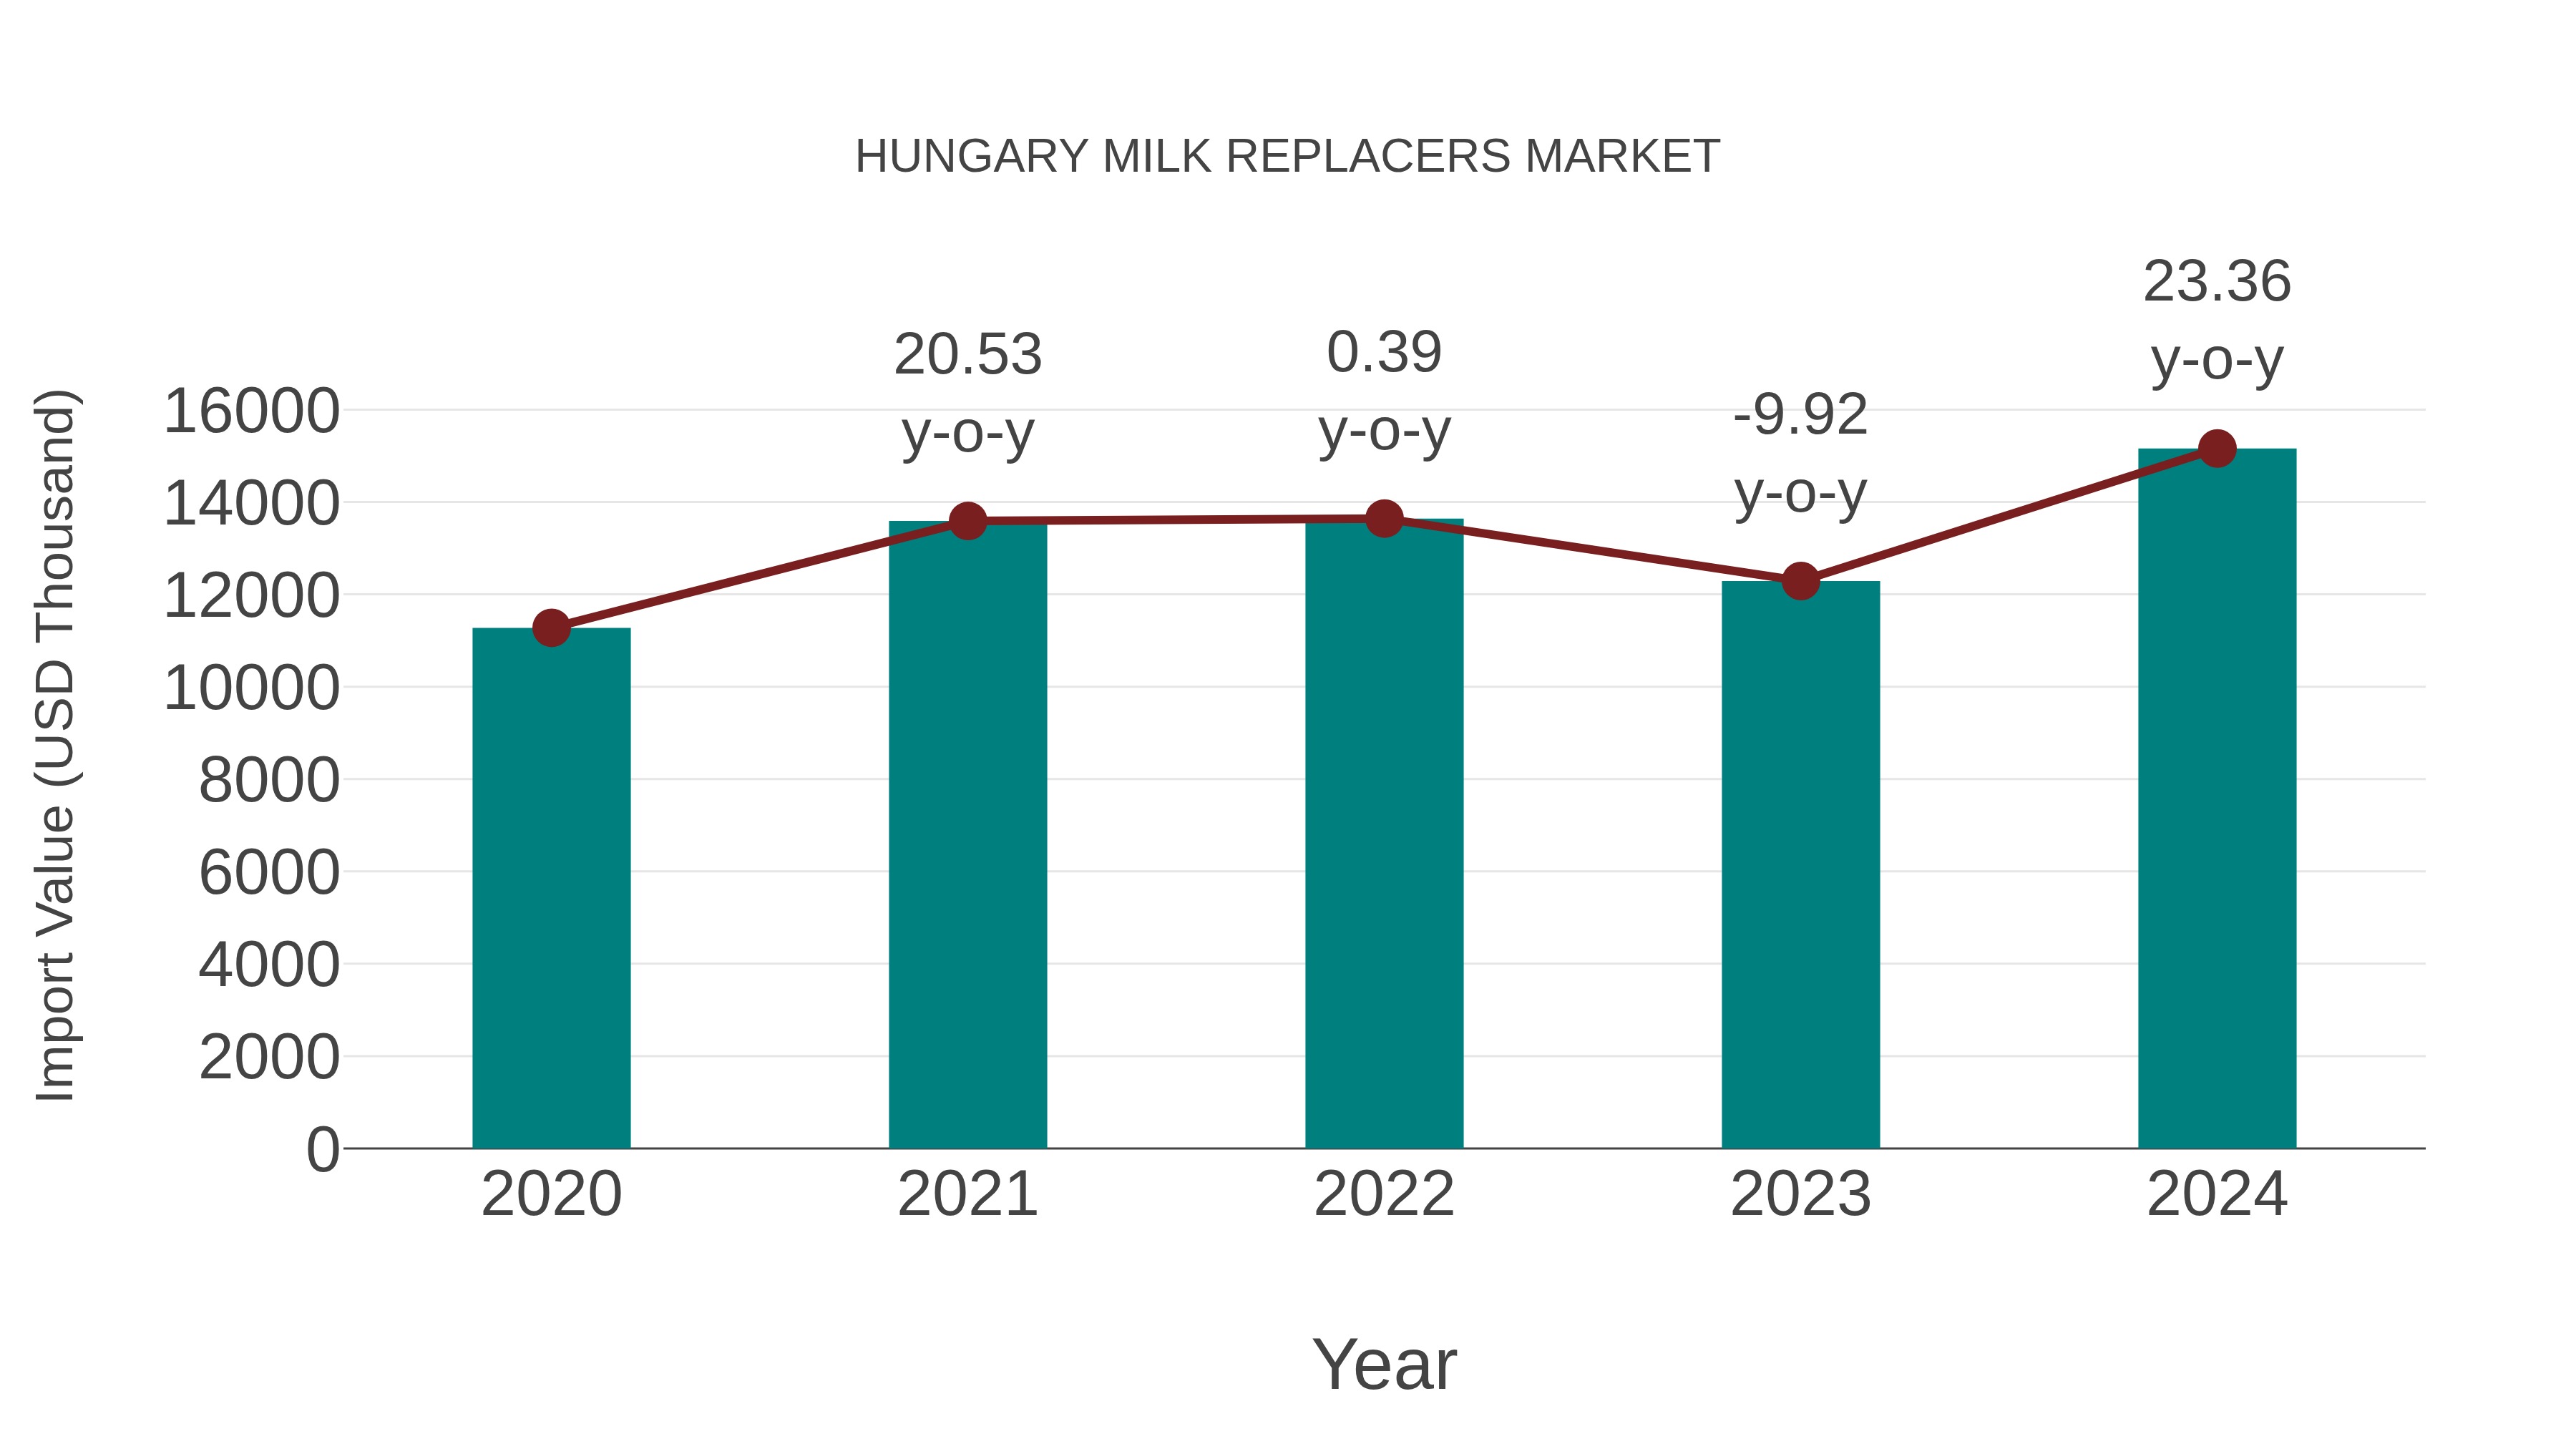
Hungary Milk Replacers Market: Import Trend Analysis
Hungary`s import trend for milk replacers in 2024 showed significant growth, with a 23.36% increase from the previous year. The compound annual growth rate (CAGR) from 2020 to 2024 stood at 7.68%. This upward trajectory can be attributed to a notable shift in consumer demand towards dairy alternatives and a stable market environment for import activities.
Hungary Milk Replacers Market Overview
The Hungary Milk Replacers Market is witnessing steady growth driven by the increasing demand for milk replacers in the livestock industry. With advancements in nutritional science and a growing emphasis on animal welfare, farmers are opting for milk replacers as a viable alternative to natural milk. The market is characterized by the presence of both local and international players offering a diverse range of products catering to different animal species. Moreover, government initiatives aimed at promoting dairy farming are further fueling market expansion.
Drivers of the market
The Hungary milk replacers market is primarily driven by the increasing demand for alternative nutrition solutions for young livestock due to factors such as rising milk prices, scarcity of natural milk resources, and the need for efficient livestock management practices. Additionally, advancements in milk replacer formulations to closely mimic the nutritional content of natural milk, coupled with growing concerns regarding animal health and welfare, are further boosting market growth.
Challenges of the market
Despite the increasing demand for milk replacers, challenges arise in maintaining quality standards and ensuring nutritional equivalence to natural milk, often requiring substantial research and development investments.
Government Policy of the market
The Hungary government has implemented policies to support the development and regulation of the milk replacers market. These policies focus on ensuring product safety, quality standards, and compliance with environmental regulations. Additionally, subsidies may be provided to encourage domestic production and reduce dependency on imports.
Key Highlights of the Report:
- Hungary Milk Replacers Market Outlook
- Market Size of Hungary Milk Replacers Market, 2024
- Forecast of Hungary Milk Replacers Market, 2031
- Historical Data and Forecast of Hungary Milk Replacers Revenues & Volume for the Period 2021-2031
- Hungary Milk Replacers Market Trend Evolution
- Hungary Milk Replacers Market Drivers and Challenges
- Hungary Milk Replacers Price Trends
- Hungary Milk Replacers Porter's Five Forces
- Hungary Milk Replacers Industry Life Cycle
- Historical Data and Forecast of Hungary Milk Replacers Market Revenues & Volume By Type for the Period 2021-2031
- Historical Data and Forecast of Hungary Milk Replacers Market Revenues & Volume By Medicated for the Period 2021-2031
- Historical Data and Forecast of Hungary Milk Replacers Market Revenues & Volume By Non-Medicated for the Period 2021-2031
- Historical Data and Forecast of Hungary Milk Replacers Market Revenues & Volume By Livestock for the Period 2021-2031
- Historical Data and Forecast of Hungary Milk Replacers Market Revenues & Volume By Ruminants for the Period 2021-2031
- Historical Data and Forecast of Hungary Milk Replacers Market Revenues & Volume By Swine for the Period 2021-2031
- Historical Data and Forecast of Hungary Milk Replacers Market Revenues & Volume By Source for the Period 2021-2031
- Historical Data and Forecast of Hungary Milk Replacers Market Revenues & Volume By Milk-based for the Period 2021-2031
- Historical Data and Forecast of Hungary Milk Replacers Market Revenues & Volume By Non milk-based for the Period 2021-2031
- Historical Data and Forecast of Hungary Milk Replacers Market Revenues & Volume By Blended for the Period 2021-2031
- Hungary Milk Replacers Import Export Trade Statistics
- Market Opportunity Assessment By Type
- Market Opportunity Assessment By Livestock
- Market Opportunity Assessment By Source
- Hungary Milk Replacers Top Companies Market Share
- Hungary Milk Replacers Competitive Benchmarking By Technical and Operational Parameters
- Hungary Milk Replacers Company Profiles
- Hungary Milk Replacers Key Strategic Recommendations
What are the key factors contributing to the growth of the Hungary milk replacers market?
The increasing adoption of advanced dairy farming technologies by companies like Agrifirm and Trouw Nutrition and the rising demand for specialty milk replacers for calves from Hungarian dairy farmers are major factors driving growth in the Hungary milk replacers market.
The future outlook for the Hungary milk replacers market is promising due to increasing consumer demand for plant-based alternatives and innovative product offerings from companies like Alpro and Oatly. The market is expected to witness continued growth driven by changing consumer preferences towards healthier and sustainable options.
Investors can capitalize on the growing trend of plant-based milk alternatives in Hungary, with companies like Oatly and Alpro gaining popularity. Additionally, there is an opportunity for innovation in packaging and marketing strategies to target health-conscious consumers seeking dairy-free options, as seen with the success of local brands like Nestlé's Nesquik plant-based milk range.
Some of the main competitors in the Hungary milk replacers market include Cargill, Royal De Heus, and Trouw Nutrition. Cargill is known for its high-quality products and strong distribution network, while Royal De Heus focuses on innovation and sustainable practices. Trouw Nutrition differentiates itself through its research and development capabilities, offering customized solutions to meet specific customer needs. These companies compete based on product quality, pricing strategies, and customer service to gain market share in Hungary's milk replacers industry.
The Hungary milk replacers market refers to the segment within the country's agricultural industry that involves the production and distribution of specialized products designed to substitute or supplement the milk feeding of young livestock such as calves, lambs, and piglets. Key players in this market include companies like Agrimin, Cargill, and Trouw Nutrition, offering a range of milk replacer products tailored to the nutritional needs of different animal species. This market encompasses various types of milk replacers, including powder, liquid, and specialty formulations, serving the needs of both small-scale farmers and large commercial livestock operations in Hungary.
6Wresearch actively monitors the Hungary Milk Replacers Market and publishes its comprehensive annual report, highlighting emerging trends, growth drivers, revenue analysis, and forecast outlook. Our insights help businesses to make data-backed strategic decisions with ongoing market dynamics. Our analysts track relevent industries related to the Hungary Milk Replacers Market, allowing our clients with actionable intelligence and reliable forecasts tailored to emerging regional needs.
Yes, we provide customisation as per your requirements. To learn more, feel free to contact us on sales@6wresearch.com
1 Executive Summary |
2 Introduction |
2.1 Key Highlights of the Report |
2.2 Report Description |
2.3 Market Scope & Segmentation |
2.4 Research Methodology |
2.5 Assumptions |
3 Hungary Milk Replacers Market Overview |
3.1 Hungary Country Macro Economic Indicators |
3.2 Hungary Milk Replacers Market Revenues & Volume, 2021 & 2031F |
3.3 Hungary Milk Replacers Market - Industry Life Cycle |
3.4 Hungary Milk Replacers Market - Porter's Five Forces |
3.5 Hungary Milk Replacers Market Revenues & Volume Share, By Type, 2021 & 2031F |
3.6 Hungary Milk Replacers Market Revenues & Volume Share, By Livestock, 2021 & 2031F |
3.7 Hungary Milk Replacers Market Revenues & Volume Share, By Source, 2021 & 2031F |
4 Hungary Milk Replacers Market Dynamics |
4.1 Impact Analysis |
4.2 Market Drivers |
4.2.1 Increasing demand for dairy products due to rising health consciousness among consumers |
4.2.2 Growing adoption of milk replacers for livestock management in Hungary |
4.2.3 Technological advancements in milk replacers leading to improved efficiency and performance |
4.3 Market Restraints |
4.3.1 Fluctuating prices of raw materials impacting the production costs of milk replacers |
4.3.2 Stringent regulations and standards related to dairy products in Hungary |
5 Hungary Milk Replacers Market Trends |
6 Hungary Milk Replacers Market, By Types |
6.1 Hungary Milk Replacers Market, By Type |
6.1.1 Overview and Analysis |
6.1.2 Hungary Milk Replacers Market Revenues & Volume, By Type, 2021-2031F |
6.1.3 Hungary Milk Replacers Market Revenues & Volume, By Medicated, 2021-2031F |
6.1.4 Hungary Milk Replacers Market Revenues & Volume, By Non-Medicated, 2021-2031F |
6.2 Hungary Milk Replacers Market, By Livestock |
6.2.1 Overview and Analysis |
6.2.2 Hungary Milk Replacers Market Revenues & Volume, By Ruminants, 2021-2031F |
6.2.3 Hungary Milk Replacers Market Revenues & Volume, By Swine, 2021-2031F |
6.3 Hungary Milk Replacers Market, By Source |
6.3.1 Overview and Analysis |
6.3.2 Hungary Milk Replacers Market Revenues & Volume, By Milk-based, 2021-2031F |
6.3.3 Hungary Milk Replacers Market Revenues & Volume, By Non milk-based, 2021-2031F |
6.3.4 Hungary Milk Replacers Market Revenues & Volume, By Blended, 2021-2031F |
7 Hungary Milk Replacers Market Import-Export Trade Statistics |
7.1 Hungary Milk Replacers Market Export to Major Countries |
7.2 Hungary Milk Replacers Market Imports from Major Countries |
8 Hungary Milk Replacers Market Key Performance Indicators |
8.1 Adoption rate of milk replacers by livestock farmers in Hungary |
8.2 Research and development investment in new milk replacer formulations |
8.3 Sustainability initiatives in the production process of milk replacers |
9 Hungary Milk Replacers Market - Opportunity Assessment |
9.1 Hungary Milk Replacers Market Opportunity Assessment, By Type, 2021 & 2031F |
9.2 Hungary Milk Replacers Market Opportunity Assessment, By Livestock, 2021 & 2031F |
9.3 Hungary Milk Replacers Market Opportunity Assessment, By Source, 2021 & 2031F |
10 Hungary Milk Replacers Market - Competitive Landscape |
10.1 Hungary Milk Replacers Market Revenue Share, By Companies, 2024 |
10.2 Hungary Milk Replacers Market Competitive Benchmarking, By Operating and Technical Parameters |
11 Company Profiles |
12 Recommendations |
13 Disclaimer |
Export potential assessment - trade Analytics for 2030
Export potential enables firms to identify high-growth global markets with greater confidence by combining advanced trade intelligence with a structured quantitative methodology. The framework analyzes emerging demand trends and country-level import patterns while integrating macroeconomic and trade datasets such as GDP and population forecasts, bilateral import–export flows, tariff structures, elasticity differentials between developed and developing economies, geographic distance, and import demand projections. Using weighted trade values from 2020–2024 as the base period to project country-to-country export potential for 2030, these inputs are operationalized through calculated drivers such as gravity model parameters, tariff impact factors, and projected GDP per-capita growth. Through an analysis of hidden potentials, demand hotspots, and market conditions that are most favorable to success, this method enables firms to focus on target countries, maximize returns, and global expansion with data, backed by accuracy.
By factoring in the projected importer demand gap that is currently unmet and could be potential opportunity, it identifies the potential for the Exporter (Country) among 190 countries, against the general trade analysis, which identifies the biggest importer or exporter.
To discover high-growth global markets and optimize your business strategy:
Click Here
Pricing
- Single User License$ 1,995
- Department License$ 2,400
- Site License$ 3,120
- Global License$ 3,795

Search
Thought Leadership and Analyst Meet


Our Clients
Related Reports
- Saudi Arabia Car Window Tinting Film, Paint Protection Film (PPF), and Ceramic Coating Market (2025-2031) | Strategy, Consumer Insights, Analysis, Investment Trends, Opportunities, Growth, Size, Share, Industry, Revenue, Segments, Value, Segmentation, Supply, Forecast, Restraints, Outlook, Competition, Drivers, Trends, Demand, Pricing Analysis, Competitive, Strategic Insights, Companies, Challenges
- South Africa Stationery Market (2025-2031) | Share, Size, Industry, Value, Growth, Revenue, Analysis, Trends, Segmentation & Outlook
- Afghanistan Rocking Chairs And Adirondack Chairs Market (2026-2032) | Size & Revenue, Competitive Landscape, Share, Segmentation, Industry, Value, Outlook, Analysis, Trends, Growth, Forecast, Companies
- Afghanistan Apparel Market (2026-2032) | Growth, Outlook, Industry, Segmentation, Forecast, Size, Companies, Trends, Value, Share, Analysis & Revenue
- Canada Oil and Gas Market (2026-2032) | Share, Segmentation, Value, Industry, Trends, Forecast, Analysis, Size & Revenue, Growth, Competitive Landscape, Outlook, Companies
- Germany Breakfast Food Market (2026-2032) | Industry, Share, Growth, Size, Companies, Value, Analysis, Revenue, Trends, Forecast & Outlook
- Australia Briquette Market (2025-2031) | Growth, Size, Revenue, Forecast, Analysis, Trends, Value, Share, Industry & Companies
- Vietnam System Integrator Market (2025-2031) | Size, Companies, Analysis, Industry, Value, Forecast, Growth, Trends, Revenue & Share
- ASEAN and Thailand Brain Health Supplements Market (2025-2031) | Strategy, Consumer Insights, Analysis, Investment Trends, Opportunities, Growth, Size, Share, Industry, Revenue, Segments, Value, Segmentation, Supply, Forecast, Restraints, Outlook, Competition, Drivers, Trends, Demand, Pricing Analysis, Competitive, Strategic Insights, Companies, Challenges
- ASEAN Bearings Market (2025-2031) | Strategy, Consumer Insights, Analysis, Investment Trends, Opportunities, Growth, Size, Share, Industry, Revenue, Segments, Value, Segmentation, Supply, Forecast, Restraints, Outlook, Competition, Drivers, Trends, Demand, Pricing Analysis, Competitive, Strategic Insights, Companies, Challenges
Industry Events and Analyst Meet

Stationery & Paper Expo Saudi Arabia 2026

Kids & Toys Expo Saudi Arabia 2026

Gifts & Homeware Expo Saudi Arabia 2026

Smart Home Expo 2026

Industrial Facilities Management Expo 2025
Whitepaper
- Middle East & Africa Commercial Security Market Click here to view more.
- Middle East & Africa Fire Safety Systems & Equipment Market Click here to view more.
- GCC Drone Market Click here to view more.
- Middle East Lighting Fixture Market Click here to view more.
- GCC Physical & Perimeter Security Market Click here to view more.
6WResearch In News
- Doha a strategic location for EV manufacturing hub: IPA Qatar
- Demand for luxury TVs surging in the GCC, says Samsung
- Empowering Growth: The Thriving Journey of Bangladesh’s Cable Industry
- Demand for luxury TVs surging in the GCC, says Samsung
- Video call with a traditional healer? Once unthinkable, it’s now common in South Africa
- Intelligent Buildings To Smooth GCC’s Path To Net Zero