Nicaragua Inorganic salts Market (2025-2031) | Growth, Segmentation, Value, Companies, Industry, Share, Trends, Size, Outlook, Analysis, Forecast & Revenue
Market Forecast By Application (Chemicals, Food Industry, Pharmaceuticals and Personal Care, Agriculture, Others) And Competitive Landscape
| Product Code: ETC5354659 | Publication Date: Nov 2023 | Updated Date: Nov 2025 | Product Type: Market Research Report | |
| Publisher: 6Wresearch | Author: Ravi Bhandari | No. of Pages: 60 | No. of Figures: 30 | No. of Tables: 5 |
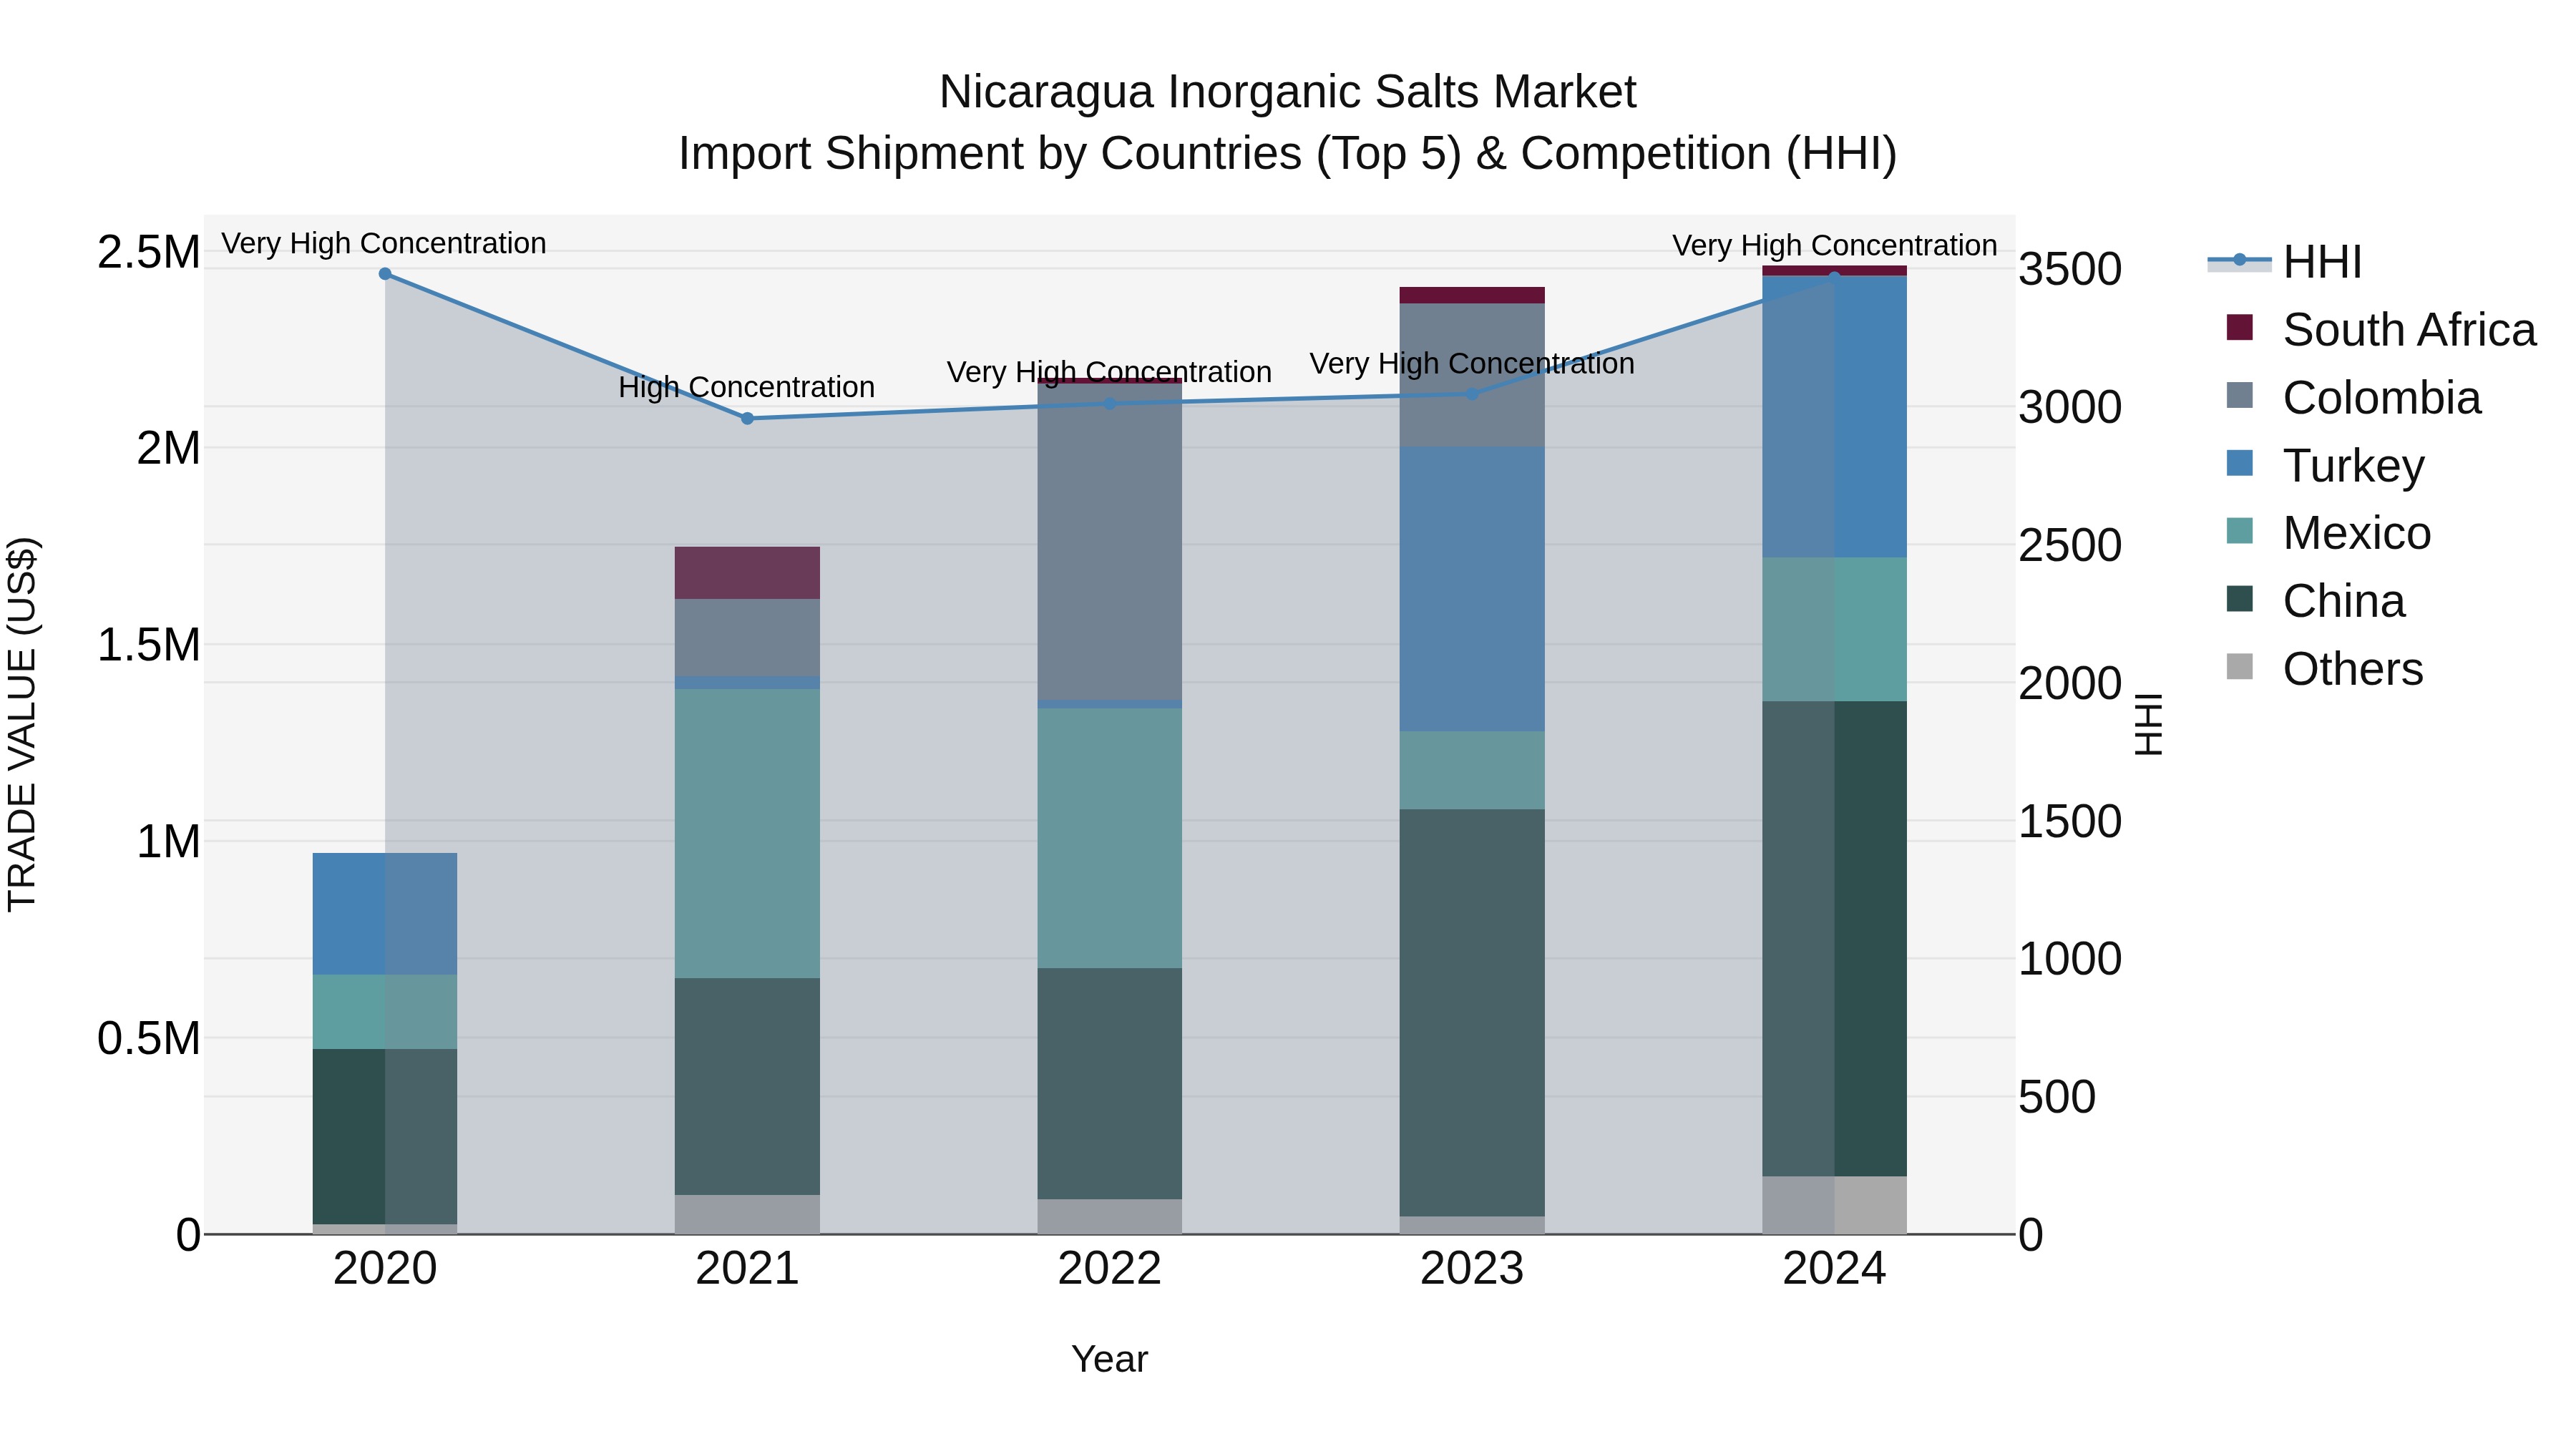
Nicaragua Inorganic Salts Market: Top 5 Importing Countries and Market Competition (HHI) Analysis
Nicaragua`s inorganic salts import market experienced significant growth in 2024, with China, Turkey, Mexico, Costa Rica, and the United States dominating the supply chain. The high Herfindahl-Hirschman Index (HHI) indicates a concentrated market structure. The impressive compound annual growth rate (CAGR) from 2020 to 2024 reflects the increasing demand for inorganic salts in Nicaragua. Although the growth rate slightly decreased in 2024 compared to the previous year, the overall trend remains positive, suggesting continued opportunities for suppliers in this sector.
Key Highlights of the Report:
- Nicaragua Inorganic salts Market Outlook
- Market Size of Nicaragua Inorganic salts Market, 2024
- Forecast of Nicaragua Inorganic salts Market, 2031
- Historical Data and Forecast of Nicaragua Inorganic salts Revenues & Volume for the Period 2021-2031
- Nicaragua Inorganic salts Market Trend Evolution
- Nicaragua Inorganic salts Market Drivers and Challenges
- Nicaragua Inorganic salts Price Trends
- Nicaragua Inorganic salts Porter`s Five Forces
- Nicaragua Inorganic salts Industry Life Cycle
- Historical Data and Forecast of Nicaragua Inorganic salts Market Revenues & Volume By Application for the Period 2021-2031
- Historical Data and Forecast of Nicaragua Inorganic salts Market Revenues & Volume By Chemicals for the Period 2021-2031
- Historical Data and Forecast of Nicaragua Inorganic salts Market Revenues & Volume By Food Industry for the Period 2021-2031
- Historical Data and Forecast of Nicaragua Inorganic salts Market Revenues & Volume By Pharmaceuticals and Personal Care for the Period 2021-2031
- Historical Data and Forecast of Nicaragua Inorganic salts Market Revenues & Volume By Agriculture for the Period 2021-2031
- Historical Data and Forecast of Nicaragua Inorganic salts Market Revenues & Volume By Others for the Period 2021-2031
- Nicaragua Inorganic salts Import Export Trade Statistics
- Market Opportunity Assessment By Application
- Nicaragua Inorganic salts Top Companies Market Share
- Nicaragua Inorganic salts Competitive Benchmarking By Technical and Operational Parameters
- Nicaragua Inorganic salts Company Profiles
- Nicaragua Inorganic salts Key Strategic Recommendations
Frequently Asked Questions About the Market Study (FAQs):
6Wresearch actively monitors the Nicaragua Inorganic salts Market and publishes its comprehensive annual report, highlighting emerging trends, growth drivers, revenue analysis, and forecast outlook. Our insights help businesses to make data-backed strategic decisions with ongoing market dynamics. Our analysts track relevent industries related to the Nicaragua Inorganic salts Market, allowing our clients with actionable intelligence and reliable forecasts tailored to emerging regional needs.
Yes, we provide customisation as per your requirements. To learn more, feel free to contact us on sales@6wresearch.com
1 Executive Summary |
2 Introduction |
2.1 Key Highlights of the Report |
2.2 Report Description |
2.3 Market Scope & Segmentation |
2.4 Research Methodology |
2.5 Assumptions |
3 Nicaragua Inorganic salts Market Overview |
3.1 Nicaragua Country Macro Economic Indicators |
3.2 Nicaragua Inorganic salts Market Revenues & Volume, 2021 & 2031F |
3.3 Nicaragua Inorganic salts Market - Industry Life Cycle |
3.4 Nicaragua Inorganic salts Market - Porter's Five Forces |
3.5 Nicaragua Inorganic salts Market Revenues & Volume Share, By Application, 2021 & 2031F |
4 Nicaragua Inorganic salts Market Dynamics |
4.1 Impact Analysis |
4.2 Market Drivers |
4.2.1 Growing demand for inorganic salts in industrial applications, such as water treatment, agriculture, and chemicals industries. |
4.2.2 Increasing investments in infrastructure development in Nicaragua driving the demand for inorganic salts for construction materials. |
4.2.3 Rise in the production of pharmaceuticals and personal care products using inorganic salts as ingredients. |
4.3 Market Restraints |
4.3.1 Fluctuating prices of raw materials impacting the production cost of inorganic salts. |
4.3.2 Stringent regulations and environmental concerns regarding the disposal and usage of certain inorganic salts. |
4.3.3 Competition from alternative products or substitutes affecting the market demand for inorganic salts. |
5 Nicaragua Inorganic salts Market Trends |
6 Nicaragua Inorganic salts Market Segmentations |
6.1 Nicaragua Inorganic salts Market, By Application |
6.1.1 Overview and Analysis |
6.1.2 Nicaragua Inorganic salts Market Revenues & Volume, By Chemicals, 2021-2031F |
6.1.3 Nicaragua Inorganic salts Market Revenues & Volume, By Food Industry, 2021-2031F |
6.1.4 Nicaragua Inorganic salts Market Revenues & Volume, By Pharmaceuticals and Personal Care, 2021-2031F |
6.1.5 Nicaragua Inorganic salts Market Revenues & Volume, By Agriculture, 2021-2031F |
6.1.6 Nicaragua Inorganic salts Market Revenues & Volume, By Others, 2021-2031F |
7 Nicaragua Inorganic salts Market Import-Export Trade Statistics |
7.1 Nicaragua Inorganic salts Market Export to Major Countries |
7.2 Nicaragua Inorganic salts Market Imports from Major Countries |
8 Nicaragua Inorganic salts Market Key Performance Indicators |
8.1 Average selling price (ASP) of inorganic salts in Nicaragua. |
8.2 Consumption trends of inorganic salts in key industries. |
8.3 Export/import volumes of inorganic salts to gauge market demand and supply dynamics. |
9 Nicaragua Inorganic salts Market - Opportunity Assessment |
9.1 Nicaragua Inorganic salts Market Opportunity Assessment, By Application, 2021 & 2031F |
10 Nicaragua Inorganic salts Market - Competitive Landscape |
10.1 Nicaragua Inorganic salts Market Revenue Share, By Companies, 2024 |
10.2 Nicaragua Inorganic salts Market Competitive Benchmarking, By Operating and Technical Parameters |
11 Company Profiles |
12 Recommendations | 13 Disclaimer |
Pricing
- Single User License$ 1,995
- Department License$ 2,400
- Site License$ 3,120
- Global License$ 3,795

Search
Thought Leadership and Analyst Meet


Our Clients
Related Reports
- Afghanistan Apparel Market (2026-2032) | Growth, Outlook, Industry, Segmentation, Forecast, Size, Companies, Trends, Value, Share, Analysis & Revenue
- Canada Oil and Gas Market (2026-2032) | Share, Segmentation, Value, Industry, Trends, Forecast, Analysis, Size & Revenue, Growth, Competitive Landscape, Outlook, Companies
- Germany Breakfast Food Market (2026-2032) | Industry, Share, Growth, Size, Companies, Value, Analysis, Revenue, Trends, Forecast & Outlook
- Australia Briquette Market (2025-2031) | Growth, Size, Revenue, Forecast, Analysis, Trends, Value, Share, Industry & Companies
- Vietnam System Integrator Market (2025-2031) | Size, Companies, Analysis, Industry, Value, Forecast, Growth, Trends, Revenue & Share
- ASEAN and Thailand Brain Health Supplements Market (2025-2031) | Strategy, Consumer Insights, Analysis, Investment Trends, Opportunities, Growth, Size, Share, Industry, Revenue, Segments, Value, Segmentation, Supply, Forecast, Restraints, Outlook, Competition, Drivers, Trends, Demand, Pricing Analysis, Competitive, Strategic Insights, Companies, Challenges
- ASEAN Bearings Market (2025-2031) | Strategy, Consumer Insights, Analysis, Investment Trends, Opportunities, Growth, Size, Share, Industry, Revenue, Segments, Value, Segmentation, Supply, Forecast, Restraints, Outlook, Competition, Drivers, Trends, Demand, Pricing Analysis, Competitive, Strategic Insights, Companies, Challenges
- Europe Flooring Market (2025-2031) | Outlook, Share, Industry, Trends, Forecast, Companies, Revenue, Size, Analysis, Growth & Value
- Saudi Arabia Manlift Market (2025-2031) | Outlook, Size, Growth, Trends, Companies, Industry, Revenue, Value, Share, Forecast & Analysis
- Uganda Excavator, Crane, and Wheel Loaders Market (2025-2031) | Strategy, Consumer Insights, Analysis, Investment Trends, Opportunities, Growth, Size, Share, Industry, Revenue, Segments, Value, Segmentation, Supply, Forecast, Restraints, Outlook, Competition, Drivers, Trends, Demand, Pricing Analysis, Competitive, Strategic Insights, Companies, Challenges
Industry Events and Analyst Meet

Stationery & Paper Expo Saudi Arabia 2026

Kids & Toys Expo Saudi Arabia 2026

Gifts & Homeware Expo Saudi Arabia 2026

Smart Home Expo 2026

Industrial Facilities Management Expo 2025
Whitepaper
- Middle East & Africa Commercial Security Market Click here to view more.
- Middle East & Africa Fire Safety Systems & Equipment Market Click here to view more.
- GCC Drone Market Click here to view more.
- Middle East Lighting Fixture Market Click here to view more.
- GCC Physical & Perimeter Security Market Click here to view more.
6WResearch In News
- Doha a strategic location for EV manufacturing hub: IPA Qatar
- Demand for luxury TVs surging in the GCC, says Samsung
- Empowering Growth: The Thriving Journey of Bangladesh’s Cable Industry
- Demand for luxury TVs surging in the GCC, says Samsung
- Video call with a traditional healer? Once unthinkable, it’s now common in South Africa
- Intelligent Buildings To Smooth GCC’s Path To Net Zero