South Korea Water Treatment Market (2020-2026) | Forecast, Growth, Value, Industry, Companies, Size, Outlook, COVID-19 IMPACT, Analysis, Share, Trends & Revenue
Market Forecast By Types (Distillation, Filtration, Disinfection, Reverse Osmosis), By Applications (Residential, Non-Residential), By Installations (Point Of Use , Point Of Entry) And Competitive Landscape
| Product Code: ETC007663 | Publication Date: Jun 2023 | Updated Date: Aug 2025 | Product Type: Report | |
| Publisher: 6Wresearch | Author: Ravi Bhandari | No. of Pages: 70 | No. of Figures: 35 | No. of Tables: 5 |
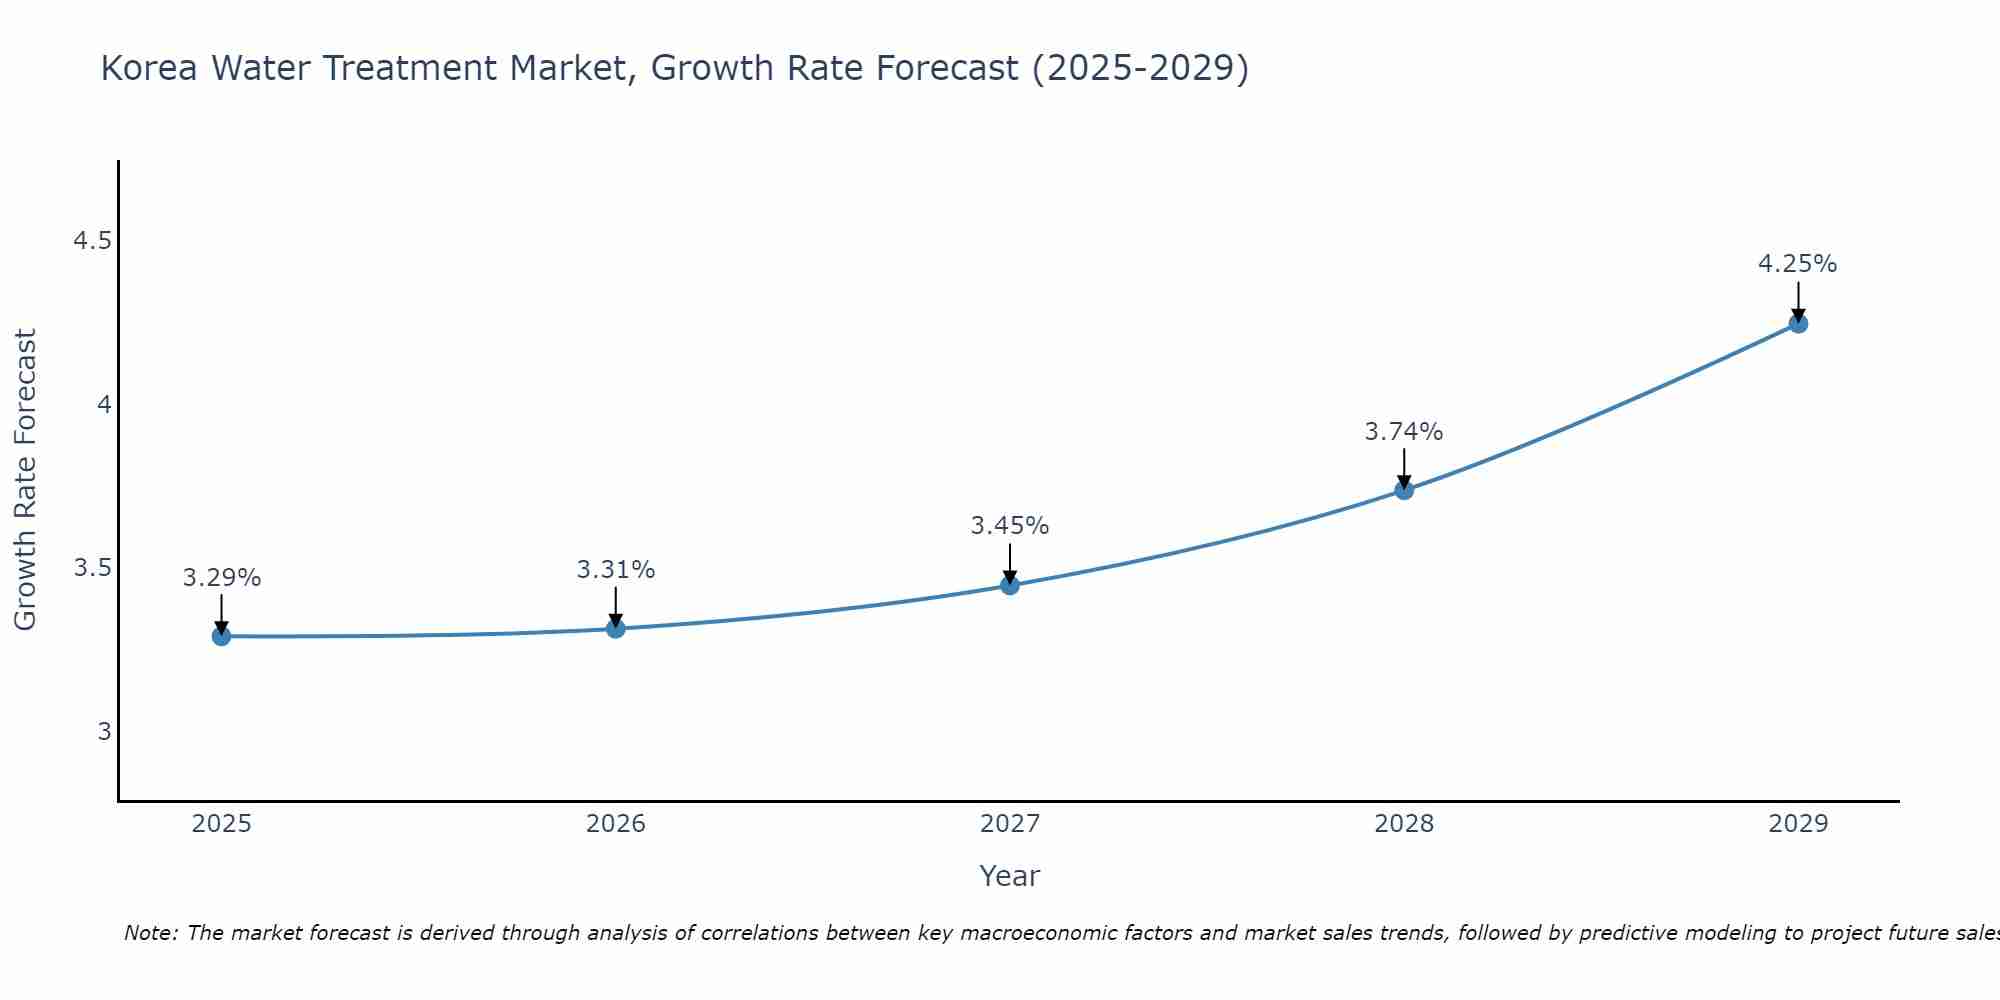
South Korea Water Treatment Market Size Growth Rate
The South Korea Water Treatment Market is likely to experience consistent growth rate gains over the period 2025 to 2029. From 3.29% in 2025, the growth rate steadily ascends to 4.25% in 2029.
South Korea Water Treatment Market Synopsis
The South Korea water treatment market size was estimated at US$ 5.66 billion in 2020 and is expected to grow at a compound annual growth rate (CAGR) of 6.3% from 2020 to 2026. The rising population, rapid urbanization, industrialization, increasing consumer awareness towards safe drinking water and stringent government regulations pertaining to water quality are the major factors driving the demand for various types of advanced water treatment systems in the country. Moreover, the growing inclination of companies towards upcoming innovative technologies such as nanofiltration membranes has further opened new opportunities for market players operating in South Korea's water treatment sector.
Furthermore, high investments by public bodies such as Water Works Association (WWA) along with several private entities have encouraged major industry participants to focus on research & development activities which is anticipated to fuel the growth prospects of this industry over the forecast period from 2020-2026. In addition, several projects undertaken by local authorities for providing clean and potable drinking water will add up positively toward South Korea?s overall economic progress thus creating potential opportunities for investors in this domain during 2020-2026 timeframe.
Key Highlights of the Report:
- South Korea Water Treatment Market Outlook
- Market Size of South Korea Water Treatment Market, 2019
- Forecast of South Korea Water Treatment Market, 2026
- Historical Data and Forecast of South Korea Water Treatment Revenues & Volume for the Period 2016 - 2026
- South Korea Water Treatment Market Trend Evolution
- South Korea Water Treatment Market Drivers and Challenges
- South Korea Water Treatment Price Trends
- South Korea Water Treatment Porter's Five Forces
- South Korea Water Treatment Industry Life Cycle
- Historical Data and Forecast of South Korea Water Treatment Market Revenues & Volume By Types for the Period 2016 - 2026
- Historical Data and Forecast of South Korea Water Treatment Market Revenues & Volume By Distillation for the Period 2016 - 2026
- Historical Data and Forecast of South Korea Water Treatment Market Revenues & Volume By Filtration for the Period 2016 - 2026
- Historical Data and Forecast of South Korea Water Treatment Market Revenues & Volume By Disinfection for the Period 2016 - 2026
- Historical Data and Forecast of South Korea Water Treatment Market Revenues & Volume By Reverse Osmosis for the Period 2016 - 2026
- Historical Data and Forecast of South Korea Water Treatment Market Revenues & Volume By Applications for the Period 2016 - 2026
- Historical Data and Forecast of South Korea Water Treatment Market Revenues & Volume By Residential for the Period 2016 - 2026
- Historical Data and Forecast of South Korea Water Treatment Market Revenues & Volume By Non-Residential for the Period 2016 - 2026
- Historical Data and Forecast of South Korea Water Treatment Market Revenues & Volume By Installations for the Period 2016 - 2026
- Historical Data and Forecast of South Korea Water Treatment Market Revenues & Volume By Point Of Use for the Period 2016 - 2026
- Historical Data and Forecast of South Korea Water Treatment Market Revenues & Volume By Point Of Entry for the Period 2016 - 2026
- South Korea Water Treatment Import Export Trade Statistics
- Market Opportunity Assessment By Types
- Market Opportunity Assessment By Applications
- Market Opportunity Assessment By Installations
- South Korea Water Treatment Top Companies Market Share
- South Korea Water Treatment Competitive Benchmarking By Technical and Operational Parameters
- South Korea Water Treatment Company Profiles
- South Korea Water Treatment Key Strategic Recommendations
Frequently Asked Questions About the Market Study (FAQs):
6Wresearch actively monitors the South Korea Water Treatment Market and publishes its comprehensive annual report, highlighting emerging trends, growth drivers, revenue analysis, and forecast outlook. Our insights help businesses to make data-backed strategic decisions with ongoing market dynamics. Our analysts track relevent industries related to the South Korea Water Treatment Market, allowing our clients with actionable intelligence and reliable forecasts tailored to emerging regional needs.
Yes, we provide customisation as per your requirements. To learn more, feel free to contact us on sales@6wresearch.com
1 Executive Summary |
2 Introduction |
2.1 Key Highlights of the Report |
2.2 Report Description |
2.3 Market Scope & Segmentation |
2.4 Research Methodology |
2.5 Assumptions |
3 South Korea Water Treatment Market Overview |
3.1 South Korea Country Macro Economic Indicators |
3.2 South Korea Water Treatment Market Revenues & Volume, 2019 & 2026F |
3.3 South Korea Water Treatment Market - Industry Life Cycle |
3.4 South Korea Water Treatment Market - Porter's Five Forces |
3.5 South Korea Water Treatment Market Revenues & Volume Share, By Types, 2019 & 2026F |
3.6 South Korea Water Treatment Market Revenues & Volume Share, By Applications, 2019 & 2026F |
3.7 South Korea Water Treatment Market Revenues & Volume Share, By Installations, 2019 & 2026F |
4 South Korea Water Treatment Market Dynamics |
4.1 Impact Analysis |
4.2 Market Drivers |
4.2.1 Increasing population and urbanization leading to higher demand for clean water |
4.2.2 Growing awareness about water pollution and environmental concerns |
4.2.3 Stringent government regulations promoting water treatment and conservation |
4.3 Market Restraints |
4.3.1 High initial investment costs for water treatment infrastructure |
4.3.2 Limited availability of freshwater sources |
4.3.3 Technological challenges in developing advanced water treatment solutions |
5 South Korea Water Treatment Market Trends |
6 South Korea Water Treatment Market, By Types |
6.1 South Korea Water Treatment Market, By Types |
6.1.1 Overview and Analysis |
6.1.2 South Korea Water Treatment Market Revenues & Volume, By Types, 2016 - 2026F |
6.1.3 South Korea Water Treatment Market Revenues & Volume, By Distillation , 2016 - 2026F |
6.1.4 South Korea Water Treatment Market Revenues & Volume, By Filtration , 2016 - 2026F |
6.1.5 South Korea Water Treatment Market Revenues & Volume, By Disinfection, 2016 - 2026F |
6.1.6 South Korea Water Treatment Market Revenues & Volume, By Reverse Osmosis, 2016 - 2026F |
6.2 South Korea Water Treatment Market, By Applications |
6.2.1 Overview and Analysis |
6.2.2 South Korea Water Treatment Market Revenues & Volume, By Residential , 2016 - 2026F |
6.2.3 South Korea Water Treatment Market Revenues & Volume, By Non-Residential , 2016 - 2026F |
6.3 South Korea Water Treatment Market, By Installations |
6.3.1 Overview and Analysis |
6.3.2 South Korea Water Treatment Market Revenues & Volume, By Point Of Use , 2016 - 2026F |
6.3.3 South Korea Water Treatment Market Revenues & Volume, By Point Of Entry, 2016 - 2026F |
7 South Korea Water Treatment Market Import-Export Trade Statistics |
7.1 South Korea Water Treatment Market Export to Major Countries |
7.2 South Korea Water Treatment Market Imports from Major Countries |
8 South Korea Water Treatment Market Key Performance Indicators |
8.1 Percentage of population with access to clean water |
8.2 Investment in research and development for water treatment technologies |
8.3 Compliance with government regulations on water quality and treatment standards |
9 South Korea Water Treatment Market - Opportunity Assessment |
9.1 South Korea Water Treatment Market Opportunity Assessment, By Types, 2019 & 2026F |
9.2 South Korea Water Treatment Market Opportunity Assessment, By Applications, 2019 & 2026F |
9.3 South Korea Water Treatment Market Opportunity Assessment, By Installations, 2019 & 2026F |
10 South Korea Water Treatment Market - Competitive Landscape |
10.1 South Korea Water Treatment Market Revenue Share, By Companies, 2019 |
10.2 South Korea Water Treatment Market Competitive Benchmarking, By Operating and Technical Parameters |
11 Company Profiles |
12 Recommendations |
13 Disclaimer |
Export potential assessment - trade Analytics for 2030
Export potential enables firms to identify high-growth global markets with greater confidence by combining advanced trade intelligence with a structured quantitative methodology. The framework analyzes emerging demand trends and country-level import patterns while integrating macroeconomic and trade datasets such as GDP and population forecasts, bilateral import–export flows, tariff structures, elasticity differentials between developed and developing economies, geographic distance, and import demand projections. Using weighted trade values from 2020–2024 as the base period to project country-to-country export potential for 2030, these inputs are operationalized through calculated drivers such as gravity model parameters, tariff impact factors, and projected GDP per-capita growth. Through an analysis of hidden potentials, demand hotspots, and market conditions that are most favorable to success, this method enables firms to focus on target countries, maximize returns, and global expansion with data, backed by accuracy.
By factoring in the projected importer demand gap that is currently unmet and could be potential opportunity, it identifies the potential for the Exporter (Country) among 190 countries, against the general trade analysis, which identifies the biggest importer or exporter.
To discover high-growth global markets and optimize your business strategy:
Click Here
Pricing
- Single User License$ 1,995
- Department License$ 2,400
- Site License$ 3,120
- Global License$ 3,795

Search
Thought Leadership and Analyst Meet


Our Clients
Related Reports
- Saudi Arabia Car Window Tinting Film, Paint Protection Film (PPF), and Ceramic Coating Market (2025-2031) | Strategy, Consumer Insights, Analysis, Investment Trends, Opportunities, Growth, Size, Share, Industry, Revenue, Segments, Value, Segmentation, Supply, Forecast, Restraints, Outlook, Competition, Drivers, Trends, Demand, Pricing Analysis, Competitive, Strategic Insights, Companies, Challenges
- South Africa Stationery Market (2025-2031) | Share, Size, Industry, Value, Growth, Revenue, Analysis, Trends, Segmentation & Outlook
- Afghanistan Rocking Chairs And Adirondack Chairs Market (2026-2032) | Size & Revenue, Competitive Landscape, Share, Segmentation, Industry, Value, Outlook, Analysis, Trends, Growth, Forecast, Companies
- Afghanistan Apparel Market (2026-2032) | Growth, Outlook, Industry, Segmentation, Forecast, Size, Companies, Trends, Value, Share, Analysis & Revenue
- Canada Oil and Gas Market (2026-2032) | Share, Segmentation, Value, Industry, Trends, Forecast, Analysis, Size & Revenue, Growth, Competitive Landscape, Outlook, Companies
- Germany Breakfast Food Market (2026-2032) | Industry, Share, Growth, Size, Companies, Value, Analysis, Revenue, Trends, Forecast & Outlook
- Australia Briquette Market (2025-2031) | Growth, Size, Revenue, Forecast, Analysis, Trends, Value, Share, Industry & Companies
- Vietnam System Integrator Market (2026-2032) | Size, Companies, Analysis, Industry, Value, Forecast, Growth, Trends, Revenue & Share
- ASEAN and Thailand Brain Health Supplements Market (2025-2031) | Strategy, Consumer Insights, Analysis, Investment Trends, Opportunities, Growth, Size, Share, Industry, Revenue, Segments, Value, Segmentation, Supply, Forecast, Restraints, Outlook, Competition, Drivers, Trends, Demand, Pricing Analysis, Competitive, Strategic Insights, Companies, Challenges
- ASEAN Bearings Market (2025-2031) | Strategy, Consumer Insights, Analysis, Investment Trends, Opportunities, Growth, Size, Share, Industry, Revenue, Segments, Value, Segmentation, Supply, Forecast, Restraints, Outlook, Competition, Drivers, Trends, Demand, Pricing Analysis, Competitive, Strategic Insights, Companies, Challenges
Industry Events and Analyst Meet

Stationery & Paper Expo Saudi Arabia 2026

Kids & Toys Expo Saudi Arabia 2026

Gifts & Homeware Expo Saudi Arabia 2026

Smart Home Expo 2026

Industrial Facilities Management Expo 2025
Whitepaper
- Middle East & Africa Commercial Security Market Click here to view more.
- Middle East & Africa Fire Safety Systems & Equipment Market Click here to view more.
- GCC Drone Market Click here to view more.
- Middle East Lighting Fixture Market Click here to view more.
- GCC Physical & Perimeter Security Market Click here to view more.
6WResearch In News
- Doha a strategic location for EV manufacturing hub: IPA Qatar
- Demand for luxury TVs surging in the GCC, says Samsung
- Empowering Growth: The Thriving Journey of Bangladesh’s Cable Industry
- Demand for luxury TVs surging in the GCC, says Samsung
- Video call with a traditional healer? Once unthinkable, it’s now common in South Africa
- Intelligent Buildings To Smooth GCC’s Path To Net Zero