United States (US) Personal Protective Equipment Market (2026-2032) | Forecast, Growth, Analysis, Companies, Size, Trends, Share, Revenue, Outlook, Industry & Value
Market Forecast By Product Types (Head, Eye & Face Protection, Hearing Protection, Protective Clothing, Respiratory Protection, Protective Footwear, Fall Protection, Hand Protection, Otherd), By End-users (Construction, Manufacturing, Oil & Gas, Chemicals, Food, Pharmaceuticals, Mining, Others) And Competitive Landscape
| Product Code: ETC013761 | Publication Date: Jun 2023 | Updated Date: Jan 2026 | Product Type: Report | |
| Publisher: 6Wresearch | Author: Ravi Bhandari | No. of Pages: 70 | No. of Figures: 35 | No. of Tables: 5 |
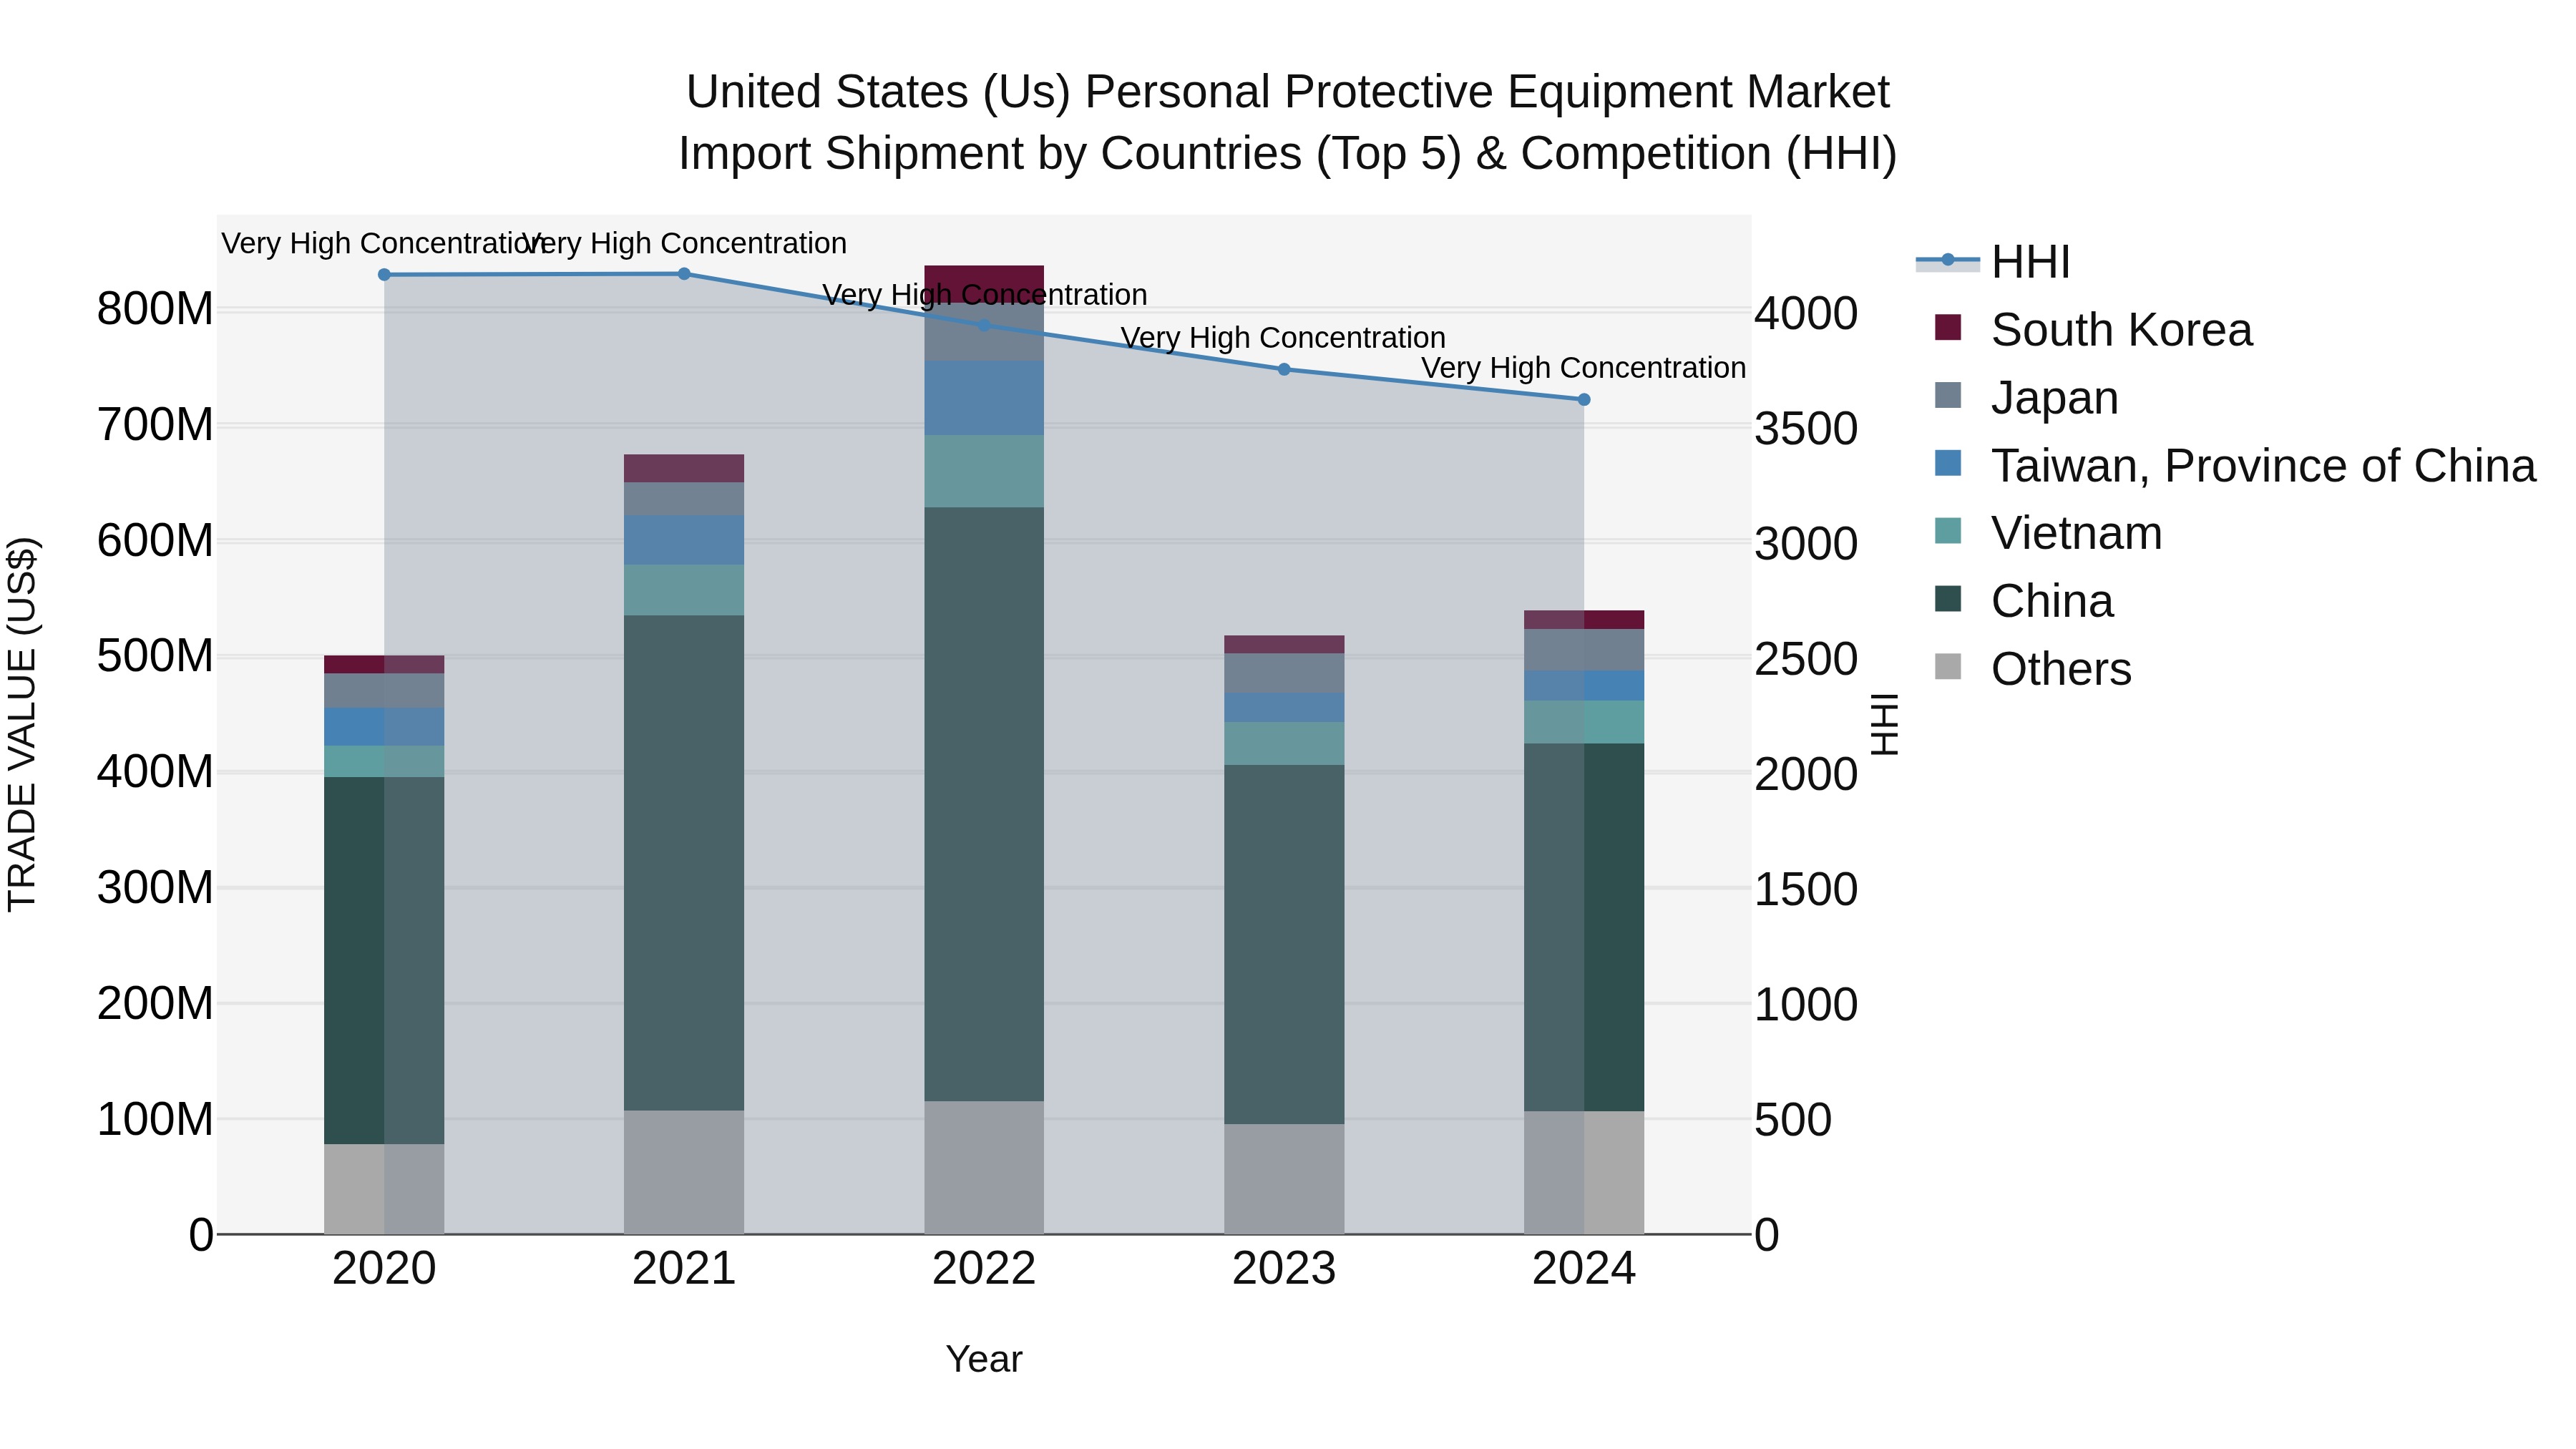
United States (US) Personal Protective Equipment Market Top 5 Importing Countries and Market Competition (HHI) Analysis
The United States continued to heavily rely on imports for personal protective equipment in 2024, with top suppliers including China, Vietnam, Japan, Taiwan, and South Korea. Despite a moderate compound annual growth rate (CAGR) of 1.9% from 2020 to 2024, the market saw a notable growth rate of 4.2% from 2023 to 2024. The high Herfindahl-Hirschman Index (HHI) indicates a market concentration among these key exporting countries, emphasizing the importance of diversifying supply chains for PPE to ensure resilience and stability in the face of global disruptions.
United States (US) Personal Protective Equipment Market Synopsis
The United States Personal Protective Equipment (PPE) Market is estimated to register a healthy CAGR of 8.90% during the forecast period (2026–2032). The country’s PPE market size was valued at USD 12,758.6 million and is projected to reach USD 18,945.4 million by 2025. Growing awareness about workplace safety due to stringent regulations imposed on employers, along with rising demand from various end-use industries including construction, healthcare, manufacturing, and oil & gas, are some of the major factors driving the growth of the US PPE market over the forecast period. Moreover, increasing investments in research and development activities aimed at developing advanced protective technology products with enhanced comfort levels have further contributed to market growth in recent years. However, the availability of counterfeit products from several low-cost manufacturers could hinder market growth across the North America region during the 2026–2032 outlook period.
Key Attractiveness of the Report
- 10 Years of Market Numbers.
- Historical Data Starting from 2022 to 2025.
- Base Year: 2025
- Forecast Data until 2032.
- Key Performance Indicators Impacting the market.
- Major Upcoming Developments and Projects.
Key Highlights of the Report:
- United States (US) Personal Protective Equipment Market Outlook
- Market Size of United States (US) Personal Protective Equipment Market, 2025
- Forecast of United States (US) Personal Protective Equipment Market, 2032
- Historical Data and Forecast of United States (US) Personal Protective Equipment Revenues & Volume for the Period 2022-2032
- United States (US) Personal Protective Equipment Market Trend Evolution
- United States (US) Personal Protective Equipment Market Drivers and Challenges
- United States (US) Personal Protective Equipment Price Trends
- United States (US) Personal Protective Equipment Porter's Five Forces
- United States (US) Personal Protective Equipment Industry Life Cycle
- Historical Data and Forecast of United States (US) Personal Protective Equipment Market Revenues & Volume By Product Types for the Period 2022-2032
- Historical Data and Forecast of United States (US) Personal Protective Equipment Market Revenues & Volume By Head, Eye & Face Protection for the Period 2022-2032
- Historical Data and Forecast of United States (US) Personal Protective Equipment Market Revenues & Volume By Hearing Protection for the Period 2022-2032
- Historical Data and Forecast of United States (US) Personal Protective Equipment Market Revenues & Volume By Protective Clothing for the Period 2022-2032
- Historical Data and Forecast of United States (US) Personal Protective Equipment Market Revenues & Volume By Respiratory Protection for the Period 2022-2032
- Historical Data and Forecast of United States (US) Personal Protective Equipment Market Revenues & Volume By Protective Footwear for the Period 2022-2032
- Historical Data and Forecast of United States (US) Personal Protective Equipment Market Revenues & Volume By Fall Protection for the Period 2022-2032
- Historical Data and Forecast of United States (US) Personal Protective Equipment Market Revenues & Volume By Hand Protection for the Period 2022-2032
- Historical Data and Forecast of United States (US) Head, Eye & Face Protection Personal Protective Equipment Market Revenues & Volume By Otherd for the Period 2022-2032
- Historical Data and Forecast of United States (US) Personal Protective Equipment Market Revenues & Volume By End-users for the Period 2022-2032
- Historical Data and Forecast of United States (US) Personal Protective Equipment Market Revenues & Volume By Construction for the Period 2022-2032
- Historical Data and Forecast of United States (US) Personal Protective Equipment Market Revenues & Volume By Manufacturing for the Period 2022-2032
- Historical Data and Forecast of United States (US) Personal Protective Equipment Market Revenues & Volume By Oil & Gas for the Period 2022-2032
- Historical Data and Forecast of United States (US) Personal Protective Equipment Market Revenues & Volume By Chemicals for the Period 2022-2032
- Historical Data and Forecast of United States (US) Personal Protective Equipment Market Revenues & Volume By Food for the Period 2022-2032
- Historical Data and Forecast of United States (US) Personal Protective Equipment Market Revenues & Volume By Pharmaceuticals for the Period 2022-2032
- Historical Data and Forecast of United States (US) Personal Protective Equipment Market Revenues & Volume By Mining for the Period 2022-2032
- Historical Data and Forecast of United States (US) Personal Protective Equipment Market Revenues & Volume By Others for the Period 2022-2032
- United States (US) Personal Protective Equipment Import Export Trade Statistics
- Market Opportunity Assessment By Product Types
- Market Opportunity Assessment By End-users
- United States (US) Personal Protective Equipment Top Companies Market Share
- United States (US) Personal Protective Equipment Competitive Benchmarking By Technical and Operational Parameters
- United States (US) Personal Protective Equipment Company Profiles
- United States (US) Personal Protective Equipment Key Strategic Recommendations
Frequently Asked Questions About the Market Study (FAQs):
6Wresearch actively monitors the United States (US) Personal Protective Equipment Market and publishes its comprehensive annual report, highlighting emerging trends, growth drivers, revenue analysis, and forecast outlook. Our insights help businesses to make data-backed strategic decisions with ongoing market dynamics. Our analysts track relevent industries related to the United States (US) Personal Protective Equipment Market, allowing our clients with actionable intelligence and reliable forecasts tailored to emerging regional needs.
Yes, we provide customisation as per your requirements. To learn more, feel free to contact us on sales@6wresearch.com
| 1 Executive Summary |
| 2 Introduction |
| 2.1 Key Highlights of the Report |
| 2.2 Report Description |
| 2.3 Market Scope & Segmentation |
| 2.4 Research Methodology |
| 2.5 Assumptions |
| 3 United States (US) Personal Protective Equipment Market Overview |
| 3.1 United States (US) Country Macro Economic Indicators |
| 3.2 United States (US) Personal Protective Equipment Market Revenues & Volume, 2022 & 2032F |
| 3.3 United States (US) Personal Protective Equipment Market - Industry Life Cycle |
| 3.4 United States (US) Personal Protective Equipment Market - Porter's Five Forces |
| 3.5 United States (US) Personal Protective Equipment Market Revenues & Volume Share, By Product Types, 2022 & 2032F |
| 3.6 United States (US) Personal Protective Equipment Market Revenues & Volume Share, By End-users, 2022 & 2032F |
| 4 United States (US) Personal Protective Equipment Market Dynamics |
| 4.1 Impact Analysis |
| 4.2 Market Drivers |
| 4.2.1 Stringent safety regulations and standards in various industries |
| 4.2.2 Increasing awareness and importance of workplace safety |
| 4.2.3 Growing emphasis on healthcare infrastructure and worker safety in the wake of pandemics |
| 4.3 Market Restraints |
| 4.3.1 Supply chain disruptions and material shortages |
| 4.3.2 Price fluctuations and volatility in raw material costs |
| 4.3.3 Competition from counterfeit and substandard products |
| 5 United States (US) Personal Protective Equipment Market Trends |
| 6 United States (US) Personal Protective Equipment Market, By Types |
| 6.1 United States (US) Personal Protective Equipment Market, By Product Types |
| 6.1.1 Overview and Analysis |
| 6.1.2 United States (US) Personal Protective Equipment Market Revenues & Volume, By Product Types, 2022-2032F |
| 6.1.3 United States (US) Personal Protective Equipment Market Revenues & Volume, By Head, Eye & Face Protection, 2022-2032F |
| 6.1.4 United States (US) Personal Protective Equipment Market Revenues & Volume, By Hearing Protection, 2022-2032F |
| 6.1.5 United States (US) Personal Protective Equipment Market Revenues & Volume, By Protective Clothing, 2022-2032F |
| 6.1.6 United States (US) Personal Protective Equipment Market Revenues & Volume, By Respiratory Protection, 2022-2032F |
| 6.1.7 United States (US) Personal Protective Equipment Market Revenues & Volume, By Protective Footwear, 2022-2032F |
| 6.1.8 United States (US) Personal Protective Equipment Market Revenues & Volume, By Fall Protection, 2022-2032F |
| 6.1.9 United States (US) Personal Protective Equipment Market Revenues & Volume, By Otherd, 2022-2032F |
| 6.1.10 United States (US) Personal Protective Equipment Market Revenues & Volume, By Otherd, 2022-2032F |
| 6.2 United States (US) Personal Protective Equipment Market, By End-users |
| 6.2.1 Overview and Analysis |
| 6.2.2 United States (US) Personal Protective Equipment Market Revenues & Volume, By Construction, 2022-2032F |
| 6.2.3 United States (US) Personal Protective Equipment Market Revenues & Volume, By Manufacturing, 2022-2032F |
| 6.2.4 United States (US) Personal Protective Equipment Market Revenues & Volume, By Oil & Gas, 2022-2032F |
| 6.2.5 United States (US) Personal Protective Equipment Market Revenues & Volume, By Chemicals, 2022-2032F |
| 6.2.6 United States (US) Personal Protective Equipment Market Revenues & Volume, By Food, 2022-2032F |
| 6.2.7 United States (US) Personal Protective Equipment Market Revenues & Volume, By Pharmaceuticals, 2022-2032F |
| 6.2.8 United States (US) Personal Protective Equipment Market Revenues & Volume, By Others, 2022-2032F |
| 6.2.9 United States (US) Personal Protective Equipment Market Revenues & Volume, By Others, 2022-2032F |
| 7 United States (US) Personal Protective Equipment Market Import-Export Trade Statistics |
| 7.1 United States (US) Personal Protective Equipment Market Export to Major Countries |
| 7.2 United States (US) Personal Protective Equipment Market Imports from Major Countries |
| 8 United States (US) Personal Protective Equipment Market Key Performance Indicators |
| 8.1 Number of workplace accidents/incidents reported |
| 8.2 Compliance rate with safety regulations and standards |
| 8.3 Adoption rate of advanced PPE technologies |
| 8.4 Frequency of PPE usage audits |
| 8.5 Percentage of companies investing in employee safety training |
| 9 United States (US) Personal Protective Equipment Market - Opportunity Assessment |
| 9.1 United States (US) Personal Protective Equipment Market Opportunity Assessment, By Product Types, 2022 & 2032F |
| 9.2 United States (US) Personal Protective Equipment Market Opportunity Assessment, By End-users, 2022 & 2032F |
| 10 United States (US) Personal Protective Equipment Market - Competitive Landscape |
| 10.1 United States (US) Personal Protective Equipment Market Revenue Share, By Companies, 2025 |
| 10.2 United States (US) Personal Protective Equipment Market Competitive Benchmarking, By Operating and Technical Parameters |
| 11 Company Profiles |
| 12 Recommendations |
| 13 Disclaimer |
Global Go To Market Strategy - 2030
Export potential enables firms to identify high-growth global markets with greater confidence by combining advanced trade intelligence with a structured quantitative methodology. The framework analyzes emerging demand trends and country-level import patterns while integrating macroeconomic and trade datasets such as GDP and population forecasts, bilateral import–export flows, tariff structures, elasticity differentials between developed and developing economies, geographic distance, and import demand projections. Using weighted trade values from 2020–2024 as the base period to project country-to-country export potential for 2030, these inputs are operationalized through calculated drivers such as gravity model parameters, tariff impact factors, and projected GDP per-capita growth. Through an analysis of hidden potentials, demand hotspots, and market conditions that are most favorable to success, this method enables firms to focus on target countries, maximize returns, and global expansion with data, backed by accuracy.
By factoring in the projected importer demand gap that is currently unmet and could be potential opportunity, it identifies the potential for the Exporter (Country) among 190 countries, against the general trade analysis, which identifies the biggest importer or exporter.
To discover high-growth global markets and optimize your business strategy:
Click Here
Pricing
- Single User License$ 1,995
- Department License$ 2,400
- Site License$ 3,120
- Global License$ 3,795

Leadership Perspectives from Industry Events
Search
Thought Leadership and Analyst Meet


Our Clients
6WResearch In News
- India Export Attractiveness Tracker 2026
- India Air Conditioner Market Set for Strong Rebound in 2026 After Weather-Led Correction and GST-Driven Recovery: 6Wresearch
- ADAS in India: How Automatic Emergency Braking, Blind Spot Detection & Driver Monitoring are Transforming Road Safety
- Doha a strategic location for EV manufacturing hub: IPA Qatar
- Demand for luxury TVs surging in the GCC, says Samsung
- Empowering Growth: The Thriving Journey of Bangladesh’s Cable Industry
Latest Reports
- Greece Insulated Sandwich Panels Market (2026-2032)
- Qatar Access and Home Network Market (2026-2032)
- Nicaragua RPG Gaming Market (2026-2032)
- New Zealand RPG Gaming Market (2026-2032)
- Netherlands RPG Gaming Market (2026-2032)
- Nauru RPG Gaming Market (2026-2032)
- Namibia RPG Gaming Market (2026-2032)
- Mozambique RPG Gaming Market (2026-2032)
- Montenegro RPG Gaming Market (2026-2032)
- Mongolia RPG Gaming Market (2026-2032)
Industry Events and Analyst Meet

EV India Expo 2026

HIMTEX 2026

India Refining Summit 2026

India EV Show 2026

EV tech India Expo 2026
Whitepaper
- Middle East & Africa Commercial Security Market Click here to view more.
- Middle East & Africa Fire Safety Systems & Equipment Market Click here to view more.
- GCC Drone Market Click here to view more.
- Middle East Lighting Fixture Market Click here to view more.
- GCC Physical & Perimeter Security Market Click here to view more.