Indonesia Biofortification Market (2025-2031) Outlook | Share, Revenue, Industry, Forecast, Size, Value, Trends, Analysis, Companies & Growth
Market Forecast By Crop (Sweet Potato, Cassava, Rice, Corn, Wheat, Beans, Pearl Millet), By Target Nutrient (Zinc, Iron, Vitamins) And Competitive Landscape
| Product Code: ETC4600349 | Publication Date: Jul 2023 | Updated Date: Jan 2026 | Product Type: Report | |
| Publisher: 6Wresearch | Author: Ravi Bhandari | No. of Pages: 85 | No. of Figures: 45 | No. of Tables: 25 |
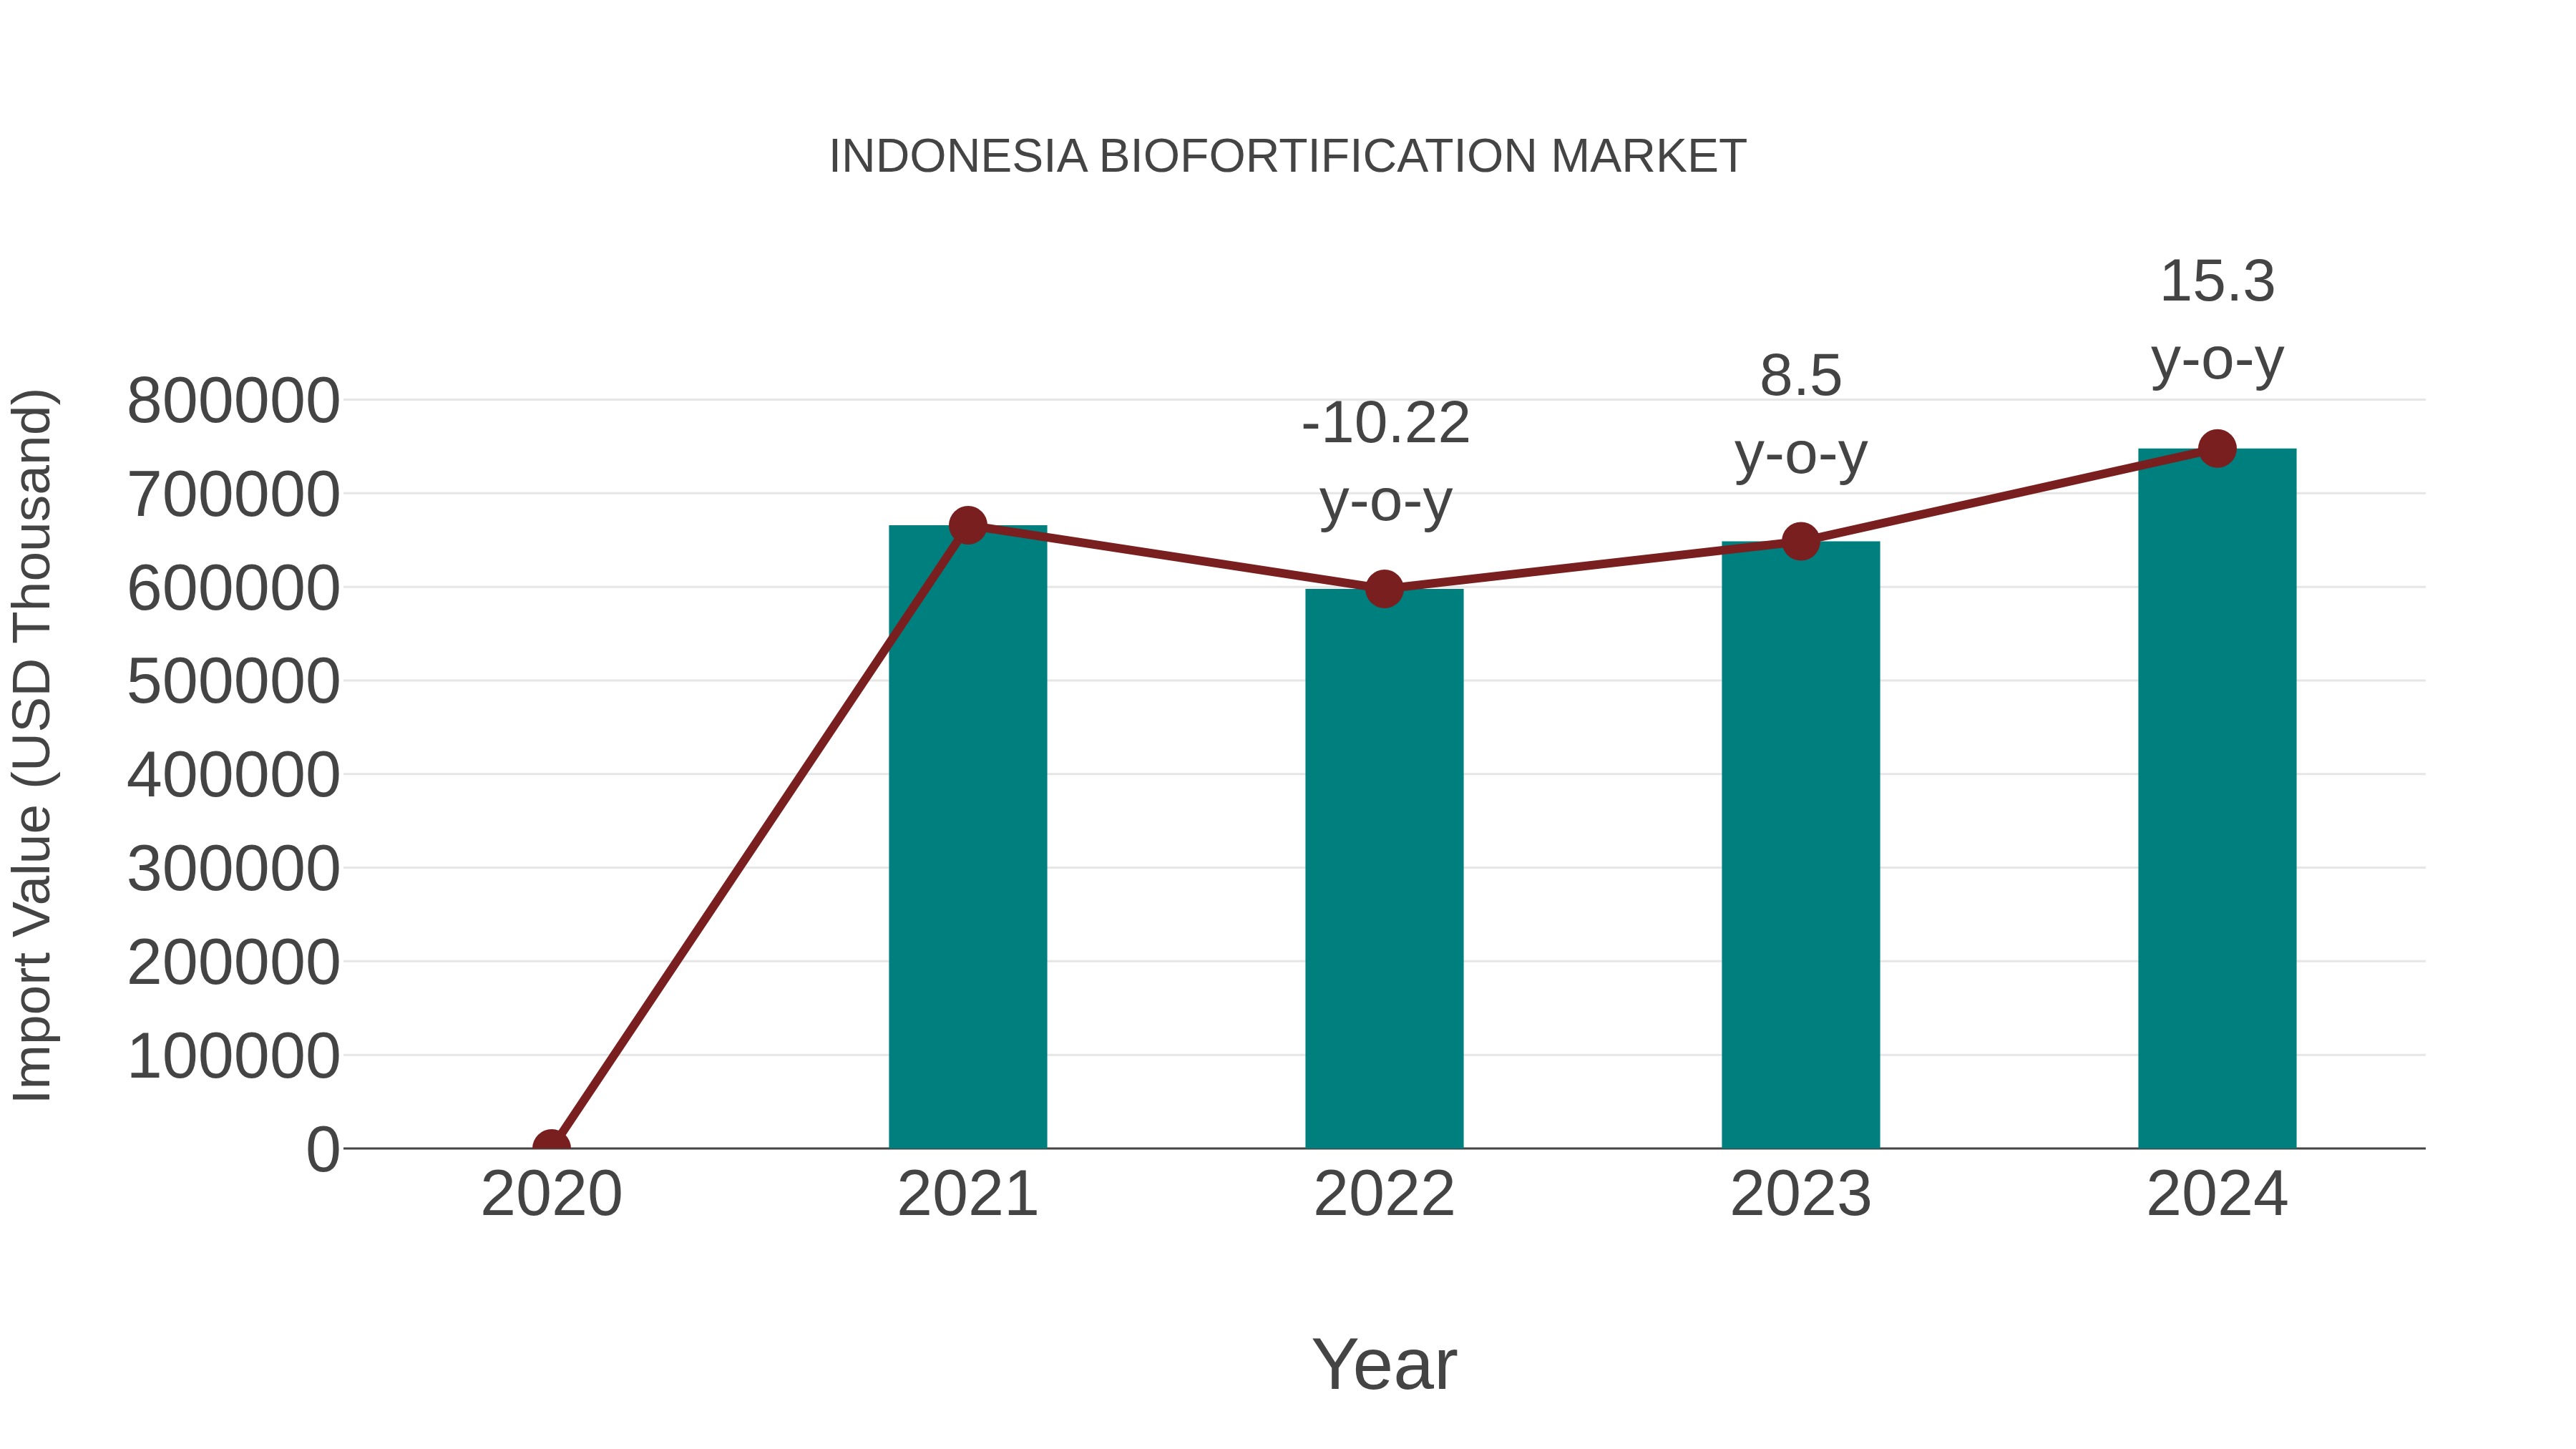
Indonesia Biofortification Market: Import Trend Analysis
Indonesia`s import trend in the biofortification market showed a notable growth rate of 15.3% from 2023 to 2024, with a compound annual growth rate (CAGR) of 3.95% from 2020 to 2024. This uptick in import momentum can be attributed to increasing consumer awareness of the benefits of biofortified products and a shift in demand towards healthier food options in the market.
Indonesia Biofortification Market Overview
The biofortification market in Indonesia is gaining prominence as a means to address malnutrition and enhance the nutritional content of crops. Biofortified crops are enriched with essential nutrients, providing a sustainable approach to improving public health. Government programs and initiatives aimed at alleviating malnutrition have propelled the adoption of biofortified crops among farmers.
Drivers of the Market
The biofortification market is gaining momentum in Indonesia as a response to malnutrition and food security issues. Biofortified crops are enriched with essential nutrients, addressing nutritional deficiencies in the population. Government initiatives and partnerships with international organizations drive the biofortification efforts in the country.
Challenges of the Market
Promoting biofortification in Indonesia involves overcoming challenges related to consumer awareness and acceptance of biofortified crops. Farmers need education and incentives to cultivate biofortified varieties, and supply chains must be established to make these crops widely available.
COVID-19 Impacts on the Market
The COVID-19 pandemic had a mixed impact on the Indonesia biofortification market. Initially, disruptions in the supply chain and reduced agricultural activities affected the market. However, the pandemic also heightened the awareness about the importance of nutrition and food security, driving the demand for biofortified crops. As the agriculture sector in Indonesia continues to adapt to the new normal, the biofortification market is expected to regain momentum, with an increased emphasis on enhancing the nutritional content of crops.
Key Players of the Makret
The Indonesia biofortification market has been championed by organizations like HarvestPlus, working in collaboration with the Indonesian government and local partners. Through biofortification programs, these entities aim to enhance the nutritional value of staple crops, addressing micronutrient deficiencies. Such initiatives have garnered significant attention and support in the country.
Key Highlights of the Report:
- Indonesia Biofortification Market Outlook
- Market Size of Indonesia Biofortification Market, 2024
- Forecast of Indonesia Biofortification Market, 2031
- Historical Data and Forecast of Indonesia Biofortification Revenues & Volume for the Period 2021-2031
- Indonesia Biofortification Market Trend Evolution
- Indonesia Biofortification Market Drivers and Challenges
- Indonesia Biofortification Price Trends
- Indonesia Biofortification Porter's Five Forces
- Indonesia Biofortification Industry Life Cycle
- Historical Data and Forecast of Indonesia Biofortification Market Revenues & Volume By Crop for the Period 2021-2031
- Historical Data and Forecast of Indonesia Biofortification Market Revenues & Volume By Sweet Potato for the Period 2021-2031
- Historical Data and Forecast of Indonesia Biofortification Market Revenues & Volume By Cassava for the Period 2021-2031
- Historical Data and Forecast of Indonesia Biofortification Market Revenues & Volume By Rice for the Period 2021-2031
- Historical Data and Forecast of Indonesia Biofortification Market Revenues & Volume By Corn for the Period 2021-2031
- Historical Data and Forecast of Indonesia Biofortification Market Revenues & Volume By Wheat for the Period 2021-2031
- Historical Data and Forecast of Indonesia Biofortification Market Revenues & Volume By Beans for the Period 2021-2031
- Historical Data and Forecast of Indonesia Biofortification Market Revenues & Volume By Pearl Millet for the Period 2021-2031
- Historical Data and Forecast of Indonesia Biofortification Market Revenues & Volume By Target Nutrient for the Period 2021-2031
- Historical Data and Forecast of Indonesia Biofortification Market Revenues & Volume By Zinc for the Period 2021-2031
- Historical Data and Forecast of Indonesia Biofortification Market Revenues & Volume By Iron for the Period 2021-2031
- Historical Data and Forecast of Indonesia Biofortification Market Revenues & Volume By Vitamins for the Period 2021-2031
- Indonesia Biofortification Import Export Trade Statistics
- Market Opportunity Assessment By Crop
- Market Opportunity Assessment By Target Nutrient
- Indonesia Biofortification Top Companies Market Share
- Indonesia Biofortification Competitive Benchmarking By Technical and Operational Parameters
- Indonesia Biofortification Company Profiles
- Indonesia Biofortification Key Strategic Recommendations
Frequently Asked Questions About the Market Study (FAQs):
6Wresearch actively monitors the Indonesia Biofortification Market and publishes its comprehensive annual report, highlighting emerging trends, growth drivers, revenue analysis, and forecast outlook. Our insights help businesses to make data-backed strategic decisions with ongoing market dynamics. Our analysts track relevent industries related to the Indonesia Biofortification Market, allowing our clients with actionable intelligence and reliable forecasts tailored to emerging regional needs.
Yes, we provide customisation as per your requirements. To learn more, feel free to contact us on sales@6wresearch.com
1 Executive Summary |
2 Introduction |
2.1 Key Highlights of the Report |
2.2 Report Description |
2.3 Market Scope & Segmentation |
2.4 Research Methodology |
2.5 Assumptions |
3 Indonesia Biofortification Market Overview |
3.1 Indonesia Country Macro Economic Indicators |
3.2 Indonesia Biofortification Market Revenues & Volume, 2021 & 2031F |
3.3 Indonesia Biofortification Market - Industry Life Cycle |
3.4 Indonesia Biofortification Market - Porter's Five Forces |
3.5 Indonesia Biofortification Market Revenues & Volume Share, By Crop, 2021 & 2031F |
3.6 Indonesia Biofortification Market Revenues & Volume Share, By Target Nutrient, 2021 & 2031F |
4 Indonesia Biofortification Market Dynamics |
4.1 Impact Analysis |
4.2 Market Drivers |
4.2.1 Increasing awareness about the importance of nutrition and health among consumers. |
4.2.2 Government initiatives promoting biofortified crops to address malnutrition. |
4.2.3 Growing demand for biofortified crops due to their enhanced nutritional value. |
4.3 Market Restraints |
4.3.1 Limited availability of biofortified crop varieties. |
4.3.2 High production costs associated with biofortification techniques. |
4.3.3 Lack of infrastructure and distribution channels for biofortified products. |
5 Indonesia Biofortification Market Trends |
6 Indonesia Biofortification Market, By Types |
6.1 Indonesia Biofortification Market, By Crop |
6.1.1 Overview and Analysis |
6.1.2 Indonesia Biofortification Market Revenues & Volume, By Crop, 2021-2031F |
6.1.3 Indonesia Biofortification Market Revenues & Volume, By Sweet Potato, 2021-2031F |
6.1.4 Indonesia Biofortification Market Revenues & Volume, By Cassava, 2021-2031F |
6.1.5 Indonesia Biofortification Market Revenues & Volume, By Rice, 2021-2031F |
6.1.6 Indonesia Biofortification Market Revenues & Volume, By Corn, 2021-2031F |
6.1.7 Indonesia Biofortification Market Revenues & Volume, By Wheat, 2021-2031F |
6.1.8 Indonesia Biofortification Market Revenues & Volume, By Beans, 2021-2031F |
6.2 Indonesia Biofortification Market, By Target Nutrient |
6.2.1 Overview and Analysis |
6.2.2 Indonesia Biofortification Market Revenues & Volume, By Zinc, 2021-2031F |
6.2.3 Indonesia Biofortification Market Revenues & Volume, By Iron, 2021-2031F |
6.2.4 Indonesia Biofortification Market Revenues & Volume, By Vitamins, 2021-2031F |
7 Indonesia Biofortification Market Import-Export Trade Statistics |
7.1 Indonesia Biofortification Market Export to Major Countries |
7.2 Indonesia Biofortification Market Imports from Major Countries |
8 Indonesia Biofortification Market Key Performance Indicators |
8.1 Adoption rate of biofortified crops by farmers. |
8.2 Investment in research and development of new biofortified crop varieties. |
8.3 Consumer awareness and perception of biofortified products. |
8.4 Number of partnerships between government agencies and private sector for promoting biofortification. |
8.5 Percentage of malnutrition cases addressed through biofortified crops. |
9 Indonesia Biofortification Market - Opportunity Assessment |
9.1 Indonesia Biofortification Market Opportunity Assessment, By Crop, 2021 & 2031F |
9.2 Indonesia Biofortification Market Opportunity Assessment, By Target Nutrient, 2021 & 2031F |
10 Indonesia Biofortification Market - Competitive Landscape |
10.1 Indonesia Biofortification Market Revenue Share, By Companies, 2024 |
10.2 Indonesia Biofortification Market Competitive Benchmarking, By Operating and Technical Parameters |
11 Company Profiles |
12 Recommendations |
13 Disclaimer |
Export potential assessment - trade Analytics for 2030
Export potential enables firms to identify high-growth global markets with greater confidence by combining advanced trade intelligence with a structured quantitative methodology. The framework analyzes emerging demand trends and country-level import patterns while integrating macroeconomic and trade datasets such as GDP and population forecasts, bilateral import–export flows, tariff structures, elasticity differentials between developed and developing economies, geographic distance, and import demand projections. Using weighted trade values from 2020–2024 as the base period to project country-to-country export potential for 2030, these inputs are operationalized through calculated drivers such as gravity model parameters, tariff impact factors, and projected GDP per-capita growth. Through an analysis of hidden potentials, demand hotspots, and market conditions that are most favorable to success, this method enables firms to focus on target countries, maximize returns, and global expansion with data, backed by accuracy.
By factoring in the projected importer demand gap that is currently unmet and could be potential opportunity, it identifies the potential for the Exporter (Country) among 190 countries, against the general trade analysis, which identifies the biggest importer or exporter.
To discover high-growth global markets and optimize your business strategy:
Click Here
Pricing
- Single User License$ 1,995
- Department License$ 2,400
- Site License$ 3,120
- Global License$ 3,795

Search
Thought Leadership and Analyst Meet


Our Clients
Related Reports
- Saudi Arabia Car Window Tinting Film, Paint Protection Film (PPF), and Ceramic Coating Market (2025-2031) | Strategy, Consumer Insights, Analysis, Investment Trends, Opportunities, Growth, Size, Share, Industry, Revenue, Segments, Value, Segmentation, Supply, Forecast, Restraints, Outlook, Competition, Drivers, Trends, Demand, Pricing Analysis, Competitive, Strategic Insights, Companies, Challenges
- South Africa Stationery Market (2025-2031) | Share, Size, Industry, Value, Growth, Revenue, Analysis, Trends, Segmentation & Outlook
- Afghanistan Rocking Chairs And Adirondack Chairs Market (2026-2032) | Size & Revenue, Competitive Landscape, Share, Segmentation, Industry, Value, Outlook, Analysis, Trends, Growth, Forecast, Companies
- Afghanistan Apparel Market (2026-2032) | Growth, Outlook, Industry, Segmentation, Forecast, Size, Companies, Trends, Value, Share, Analysis & Revenue
- Canada Oil and Gas Market (2026-2032) | Share, Segmentation, Value, Industry, Trends, Forecast, Analysis, Size & Revenue, Growth, Competitive Landscape, Outlook, Companies
- Germany Breakfast Food Market (2026-2032) | Industry, Share, Growth, Size, Companies, Value, Analysis, Revenue, Trends, Forecast & Outlook
- Australia Briquette Market (2025-2031) | Growth, Size, Revenue, Forecast, Analysis, Trends, Value, Share, Industry & Companies
- Vietnam System Integrator Market (2025-2031) | Size, Companies, Analysis, Industry, Value, Forecast, Growth, Trends, Revenue & Share
- ASEAN and Thailand Brain Health Supplements Market (2025-2031) | Strategy, Consumer Insights, Analysis, Investment Trends, Opportunities, Growth, Size, Share, Industry, Revenue, Segments, Value, Segmentation, Supply, Forecast, Restraints, Outlook, Competition, Drivers, Trends, Demand, Pricing Analysis, Competitive, Strategic Insights, Companies, Challenges
- ASEAN Bearings Market (2025-2031) | Strategy, Consumer Insights, Analysis, Investment Trends, Opportunities, Growth, Size, Share, Industry, Revenue, Segments, Value, Segmentation, Supply, Forecast, Restraints, Outlook, Competition, Drivers, Trends, Demand, Pricing Analysis, Competitive, Strategic Insights, Companies, Challenges
Industry Events and Analyst Meet

Stationery & Paper Expo Saudi Arabia 2026

Kids & Toys Expo Saudi Arabia 2026

Gifts & Homeware Expo Saudi Arabia 2026

Smart Home Expo 2026

Industrial Facilities Management Expo 2025
Whitepaper
- Middle East & Africa Commercial Security Market Click here to view more.
- Middle East & Africa Fire Safety Systems & Equipment Market Click here to view more.
- GCC Drone Market Click here to view more.
- Middle East Lighting Fixture Market Click here to view more.
- GCC Physical & Perimeter Security Market Click here to view more.
6WResearch In News
- Doha a strategic location for EV manufacturing hub: IPA Qatar
- Demand for luxury TVs surging in the GCC, says Samsung
- Empowering Growth: The Thriving Journey of Bangladesh’s Cable Industry
- Demand for luxury TVs surging in the GCC, says Samsung
- Video call with a traditional healer? Once unthinkable, it’s now common in South Africa
- Intelligent Buildings To Smooth GCC’s Path To Net Zero