Kenya Fruit and Vegetable Processing Market (2026-2032) | Trends, Companies, Analysis, Revenue, Forecast, Value, Size, Growth, Share, Industry & COVID-19 IMPACT
Market Forecast By Type (Fruits, Vegetables), By Product (Fresh, Fresh-cut, Canned, Frozen, Dried), By Processing Equipment (Pre-processing, Processing, Washing, Filling, Seasoning, Packaging) And Competitive Landscape
| Product Code: ETC175509 | Publication Date: Jan 2022 | Updated Date: Jun 2026 | Product Type: Market Research Report | |
| Publisher: 6Wresearch | Author: Sumit Sagar | No. of Pages: 70 | No. of Figures: 35 | No. of Tables: 5 |
Kenya Fruit and Vegetable Processing Market Size, Share & Growth Rate
The Kenya Fruit and Vegetable Processing Market was estimated at USD 228 Million in 2025 and is projected to reach USD 319 Million by 2032, growing at a CAGR of 4.9% from 2026 to 2032. This growth trajectory is driven by rising consumer awareness of health and nutrition, coupled with the increasing urban population seeking convenient food solutions. Additionally, the trend towards value-added products and sustainable processing practices supports the expansion of this dynamic sector.
Kenya Fruit and Vegetable Processing Market Growth Rate Analysis (2021-2032)
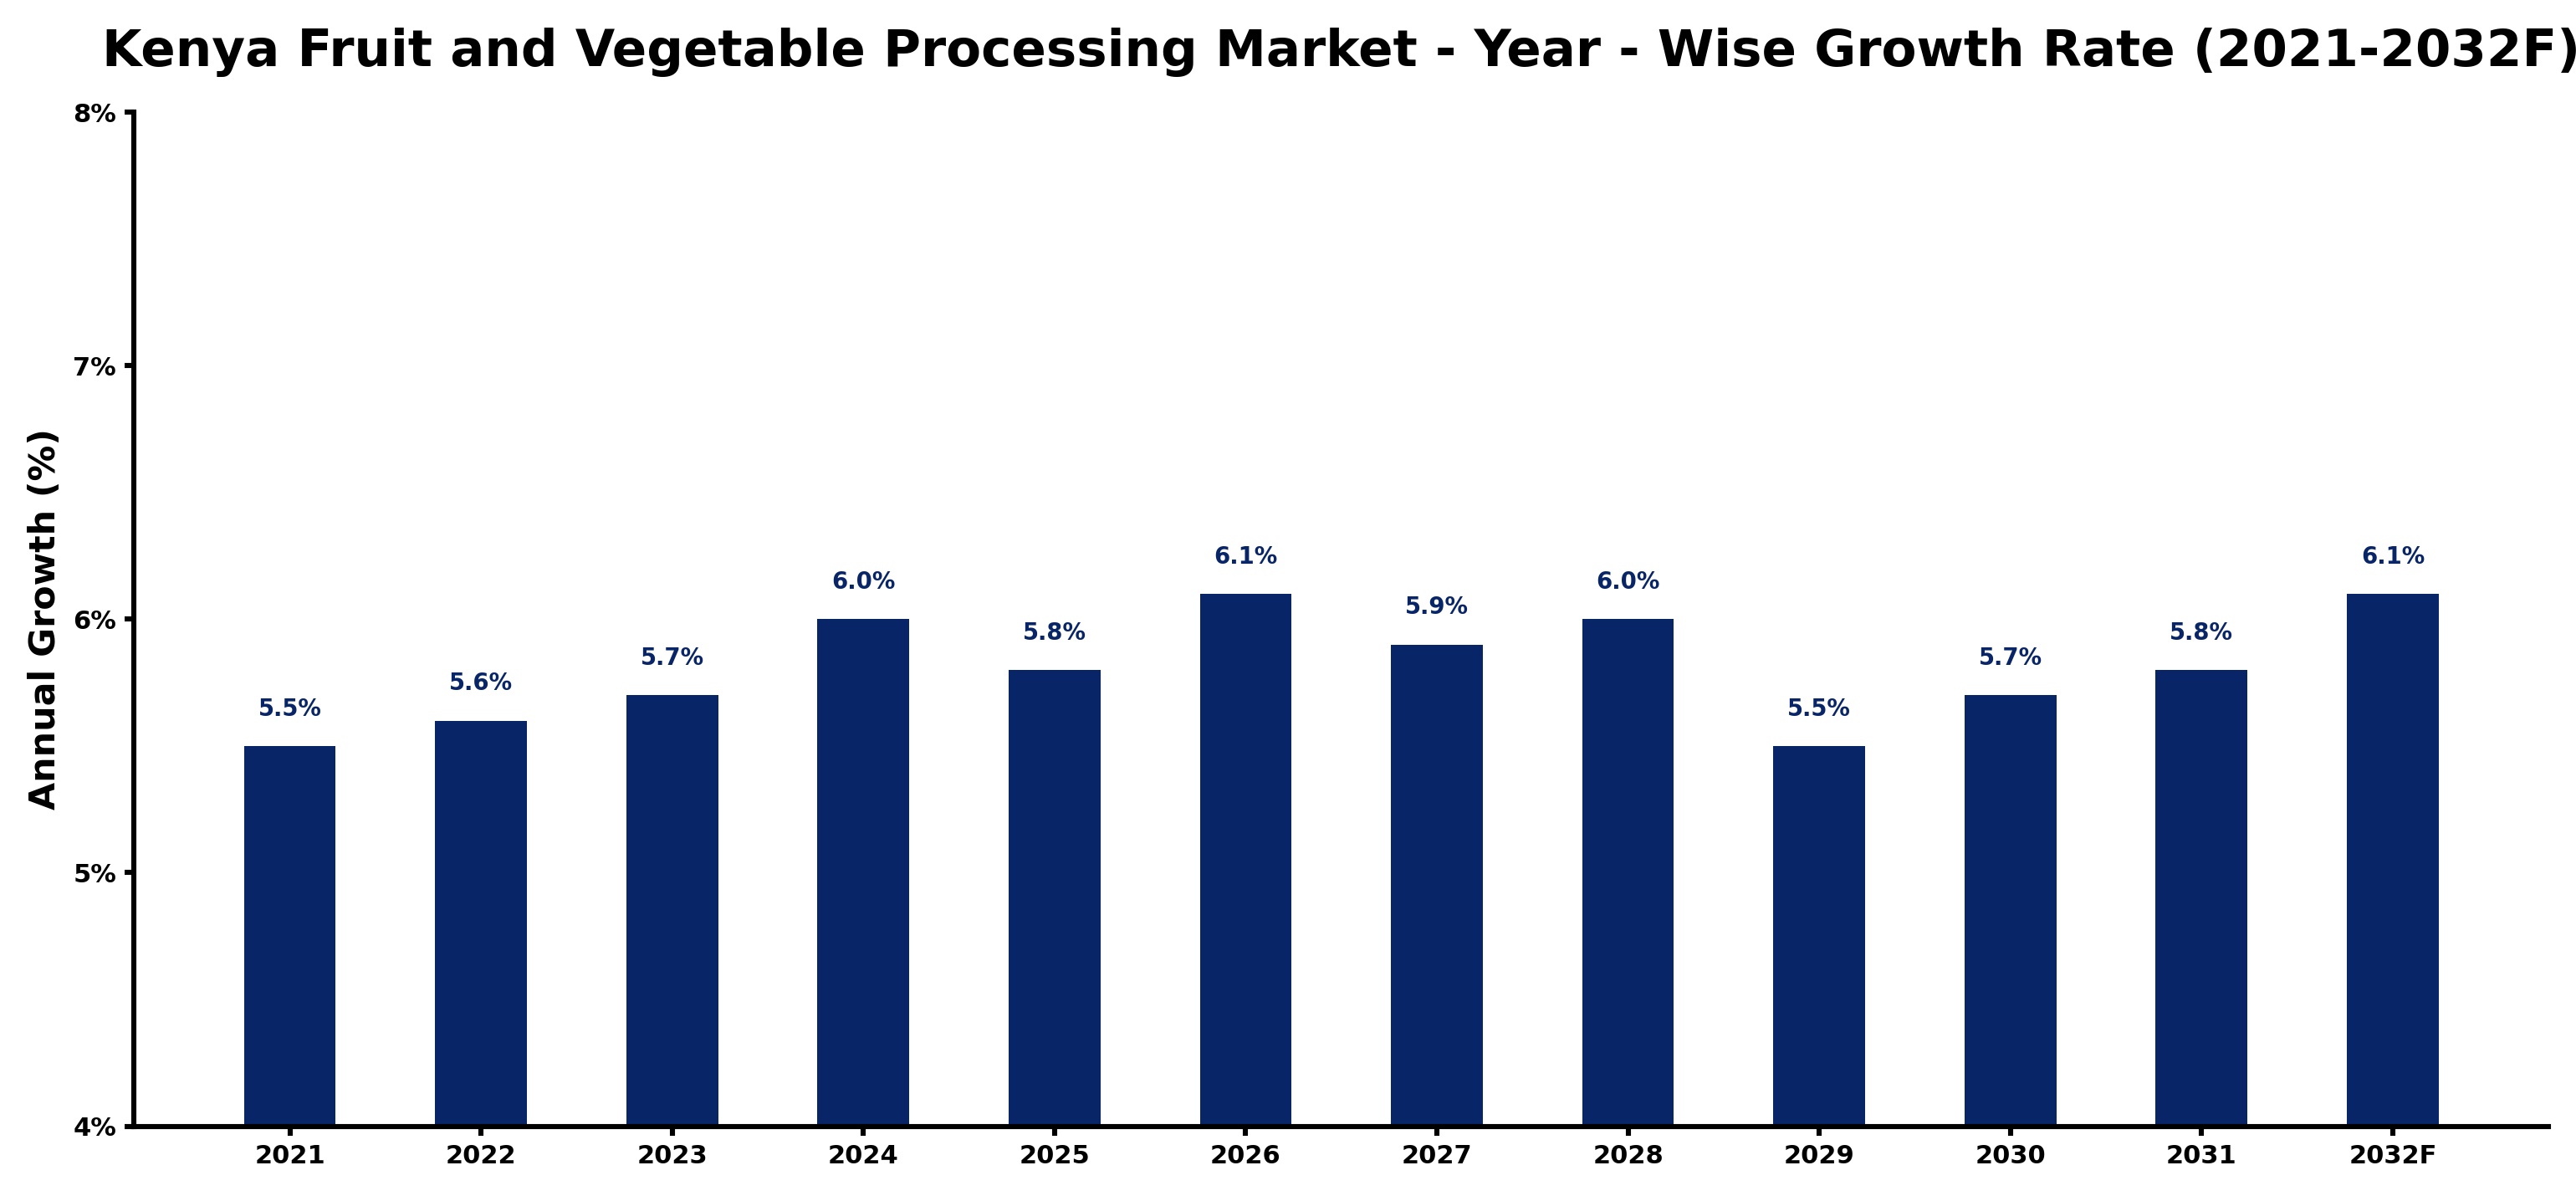
The Kenya Fruit and Vegetable Processing market has exhibited stable growth, with rates increasing from 5.5% in 2021 to an anticipated 6.1% by 2032. This upward trend is driven by rising consumer demand for healthy, processed food options, alongside investments in modern processing technologies that enhance efficiency and quality. Notable growth rates of 5.6% in 2022 and 5.7% in 2023 reflect an expanding middle class keen on convenient nutrition. Additionally, government policies favoring agriculture and processing infrastructure improvements bolster market potential. Although slight fluctuations are noted—such as a dip to 5.5% in 2029—these can largely be attributed to global supply chain challenges and shifting consumer preferences.
Kenya Fruit and Vegetable Processing Market Year-wise Growth Rate and Key Drivers
This graph highlights how the Kenya Fruit and Vegetable Processing Market has steadily grown over the past five years, supported by major growth factors.
The table below presents the year‑wise growth rates along with the key drivers influencing the market
| Year | Growth Rate | Major Drivers |
| 2021 | 5.5% | Increased demand for healthy snacks |
| 2022 | 5.6% | Export opportunities expanded significantly |
| 2023 | 5.7% | Technological advancements improved efficiency |
| 2024 | 6.0% | Rising urbanization drove consumption growth |
| 2025 | 5.8% | Sustainable practices attracted new customers |
| 2026 | 6.1% | Local sourcing initiatives enhanced quality |
| 2027 | 5.9% | Consumer awareness of nutrition increased |
| 2028 | 6.0% | Investment in processing facilities surged |
| 2029 | 5.5% | Product innovation captured market interest |
| 2030 | 5.7% | E-commerce platforms broadened reach |
| 2031 | 5.8% | Collaboration with farmers strengthened supply |
| 2032 | 6.1% | Government support for agribusiness expanded |
Note - Market size estimations and growth projections presented in this report are based on 6Wresearch’s advanced forecasting approach, validated with industry datasets as of June 2026.
Kenya Fruit and Vegetable Processing Market Synopsis
Kenya's fruit and vegetable processing market is heavily influenced by local agricultural practices, characterized by a wide variety of produce available for processing. The growing consumer inclination toward healthy, ready-to-eat options is driving innovations in product offerings, thereby enhancing market potential.
The urban consumer base is increasingly demanding processed fruits and vegetables that are not only convenient but also nutritious. As a result, processors are adjusting their strategies to meet these needs, including the introduction of organic options and environmentally friendly packaging.
Kenya Fruit and Vegetable Processing Market Key Takeaways
- The market is seeing a shift toward healthier and more convenient processed food options.
- Local sourcing of raw materials is becoming essential to ensure product quality and sustainability.
- Government initiatives are aimed at promoting agribusiness and improving infrastructure.
- Technological advancements are enhancing production efficiency and product innovation.
- Consumer preferences are leaning towards premium, natural, and minimally processed products.
Evaluation of Restraints in Kenya Fruit and Vegetable Processing Market
Despite its promising outlook, the Kenya fruit and vegetable processing market faces significant challenges. Inadequate infrastructure, such as unreliable energy supplies and poor transportation networks, hampers efficient operations and timely delivery of products. Moreover, limited access to finance restricts the potential for small and medium enterprises to upgrade facilities and adopt modern technologies. Inconsistent quality of raw materials due to seasonal fluctuations further complicates production reliability, creating barriers for local processors aiming to compete with imported products.
Kenya Fruit and Vegetable Processing Market Trends
The market is witnessing a marked trend towards sustainability and health consciousness. Processors are increasingly focusing on product innovation, emphasizing natural ingredients and minimal processing to retain nutritional value. Additionally, there is a surge in demand for organic and ethically sourced products, pushing manufacturers to adopt environmentally friendly practices. This evolving consumer behavior is reshaping product offerings, making sustainability a central theme for many players in the sector.
Kenya Fruit and Vegetable Processing Market Opportunities
Investment opportunities abound in the Kenya fruit and vegetable processing market, particularly for those looking to establish processing facilities that focus on value-added products like juices, snacks, and frozen items. The increasing demand for healthy, convenient food also paves the way for innovative processing techniques that improve product quality and shelf life. Moreover, forming strategic partnerships with local farmers can ensure a steady supply of quality raw materials, enhancing operational stability and growth potential.
Government Initiatives in the Kenya Fruit and Vegetable Processing Market
The Kenyan government has introduced several policies aimed at bolstering the fruit and vegetable processing industry. These initiatives include the National Food and Nutrition Security Policy, which promotes the production and consumption of nutritious produce. Additionally, the establishment of the Agribusiness Information Center provides vital market information and support for processors. Various tax incentives, including VAT exemptions on processing equipment, are also in place to encourage investment and enhance competitiveness within the sector.
Future Insights of the Kenya Fruit and Vegetable Processing Market
Looking ahead to the 2026-2032 period, the Kenya fruit and vegetable processing market is set to expand further, fueled by rising consumer demand for processed food products. As urbanization continues, dietary habits are expected to shift, favoring convenient and nutritious options. Government support for agribusiness, combined with ongoing technological advancements in processing, will play pivotal roles in driving market growth. Nevertheless, addressing challenges like infrastructure and supply chain efficiency will be critical to realizing the full potential of the market.
Kenya Fruit and Vegetable Processing Market Latest Developments (May 2025 - June 2026)
Recent developments within the Kenya fruit and vegetable processing industry indicate a strong focus on innovation and sustainability. Many processors are adopting new technologies to enhance production efficiency and improve product quality. Furthermore, there has been a notable increase in collaboration between processing firms and local farmers, aimed at securing sustainable raw material supplies. As consumer preferences evolve, companies are also investing in research and development to introduce healthier and more convenient product lines.
Kenya Fruit and Vegetable Processing Market - Key Attractiveness of the Report
- 10 Years of Market Numbers
- Historical Data Starting from 2022 to 2025
- Base Year: 2025
- Forecast Data until 2032
- Key Performance Indicators Impacting the Market
- Major Upcoming Developments and Projects
Key Highlights of the Report:
- Kenya Fruit and Vegetable Processing Market Outlook
- Market Size of Kenya Fruit and Vegetable Processing Market, 2025
- Forecast of Kenya Fruit and Vegetable Processing Market, 2032
- Historical Data and Forecast of Kenya Fruit and Vegetable Processing Revenues & Volume for the Period 2022-2032F
- Kenya Fruit and Vegetable Processing Market Trend Evolution
- Kenya Fruit and Vegetable Processing Market Drivers and Challenges
- Kenya Fruit and Vegetable Processing Price Trends
- Kenya Fruit and Vegetable Processing Porter's Five Forces
- Kenya Fruit and Vegetable Processing Industry Life Cycle
- Historical Data and Forecast of Kenya Fruit and Vegetable Processing Market Revenues & Volume By Type for the Period 2022-2032F
- Historical Data and Forecast of Kenya Fruit and Vegetable Processing Market Revenues & Volume By Fruits for the Period 2022-2032F
- Historical Data and Forecast of Kenya Fruit and Vegetable Processing Market Revenues & Volume By Vegetables for the Period 2022-2032F
- Historical Data and Forecast of Kenya Fruit and Vegetable Processing Market Revenues & Volume By Product for the Period 2022-2032F
- Historical Data and Forecast of Kenya Fruit and Vegetable Processing Market Revenues & Volume By Fresh for the Period 2022-2032F
- Historical Data and Forecast of Kenya Fruit and Vegetable Processing Market Revenues & Volume By Fresh-cut for the Period 2022-2032F
- Historical Data and Forecast of Kenya Fruit and Vegetable Processing Market Revenues & Volume By Canned for the Period 2022-2032F
- Historical Data and Forecast of Kenya Fruit and Vegetable Processing Market Revenues & Volume By Frozen for the Period 2022-2032F
- Historical Data and Forecast of Kenya Fruit and Vegetable Processing Market Revenues & Volume By Dried for the Period 2022-2032F
- Historical Data and Forecast of Kenya Fruit and Vegetable Processing Market Revenues & Volume By Processing Equipment for the Period 2022-2032F
- Historical Data and Forecast of Kenya Fruit and Vegetable Processing Market Revenues & Volume By Pre-processing for the Period 2022-2032F
- Historical Data and Forecast of Kenya Fruit and Vegetable Processing Market Revenues & Volume By Processing for the Period 2022-2032F
- Historical Data and Forecast of Kenya Fruit and Vegetable Processing Market Revenues & Volume By Washing for the Period 2022-2032F
- Historical Data and Forecast of Kenya Fruit and Vegetable Processing Market Revenues & Volume By Filling for the Period 2022-2032F
- Historical Data and Forecast of Kenya Fruit and Vegetable Processing Market Revenues & Volume By Seasoning for the Period 2022-2032F
- Historical Data and Forecast of Kenya Fruit and Vegetable Processing Market Revenues & Volume By Packaging for the Period 2022-2032F
- Kenya Fruit and Vegetable Processing Import Export Trade Statistics
- Market Opportunity Assessment By Type
- Market Opportunity Assessment By Product
- Market Opportunity Assessment By Processing Equipment
- Kenya Fruit and Vegetable Processing Top Companies Market Share
- Kenya Fruit and Vegetable Processing Competitive Benchmarking By Technical and Operational Parameters
- Kenya Fruit and Vegetable Processing Company Profiles
- Kenya Fruit and Vegetable Processing Key Strategic Recommendations
Kenya Fruit and Vegetable Processing Market - Frequently Asked Questions
The market is projected to reach USD 319 Million by 2032, marking a notable growth from USD 228 Million in 2025, with a CAGR of 4.9% between 2026 and 2032.
Consumers are increasingly gravitating towards health-conscious products, with a preference for natural ingredients and minimally processed foods, which is driving innovation in product development.
The government has implemented policies such as the National Food and Nutrition Security Policy and established support centers to enhance market information availability, alongside providing tax incentives for investment.
Local processors often contend with inadequate infrastructure, inconsistent quality of raw materials, and competition from lower-priced imported goods, which can hinder growth and sustainability.
There are considerable opportunities for establishing processing plants focused on value-added products such as snacks, juices, and frozen goods, especially given the rising demand for healthy, convenient options.
6Wresearch actively monitors the Kenya Fruit and Vegetable Processing Market and publishes its comprehensive annual report, highlighting emerging trends, growth drivers, revenue analysis, and forecast outlook. Our insights help businesses to make data-backed strategic decisions with ongoing market dynamics. Our analysts track relevent industries related to the Kenya Fruit and Vegetable Processing Market, allowing our clients with actionable intelligence and reliable forecasts tailored to emerging regional needs.
Yes, we provide customisation as per your requirements. To learn more, feel free to contact us on sales@6wresearch.com
1 Executive Summary |
2 Introduction |
2.1 Key Highlights of the Report |
2.2 Report Description |
2.3 Market Scope & Segmentation |
2.4 Research Methodology |
2.5 Assumptions |
3 Kenya Fruit and Vegetable Processing Market Overview |
3.1 Kenya Country Macro Economic Indicators |
3.2 Kenya Fruit and Vegetable Processing Market Revenues & Volume, 2022 & 2032F |
3.3 Kenya Fruit and Vegetable Processing Market - Industry Life Cycle |
3.4 Kenya Fruit and Vegetable Processing Market - Porter's Five Forces |
3.5 Kenya Fruit and Vegetable Processing Market Revenues & Volume Share, By Type, 2022 & 2032F |
3.6 Kenya Fruit and Vegetable Processing Market Revenues & Volume Share, By Product, 2022 & 2032F |
3.7 Kenya Fruit and Vegetable Processing Market Revenues & Volume Share, By Processing Equipment, 2022 & 2032F |
4 Kenya Fruit and Vegetable Processing Market Dynamics |
4.1 Impact Analysis |
4.2 Market Drivers |
4.2.1 Increasing demand for processed fruit and vegetable products due to changing consumer preferences towards healthy and convenient food options. |
4.2.2 Growing awareness about the benefits of processed fruits and vegetables such as extended shelf life, convenience, and nutritional value. |
4.2.3 Government initiatives to promote the food processing industry and support local farmers to increase production of fruits and vegetables. |
4.3 Market Restraints |
4.3.1 Seasonal availability and perishability of fresh fruits and vegetables leading to supply chain challenges. |
4.3.2 Lack of adequate infrastructure and technology for efficient processing and preservation of fruits and vegetables. |
4.3.3 Price volatility of raw materials impacting production costs and profitability of fruit and vegetable processing companies. |
5 Kenya Fruit and Vegetable Processing Market Trends |
6 Kenya Fruit and Vegetable Processing Market, By Types |
6.1 Kenya Fruit and Vegetable Processing Market, By Type |
6.1.1 Overview and Analysis |
6.1.2 Kenya Fruit and Vegetable Processing Market Revenues & Volume, By Type, 2022-2032F |
6.1.3 Kenya Fruit and Vegetable Processing Market Revenues & Volume, By Fruits, 2022-2032F |
6.1.4 Kenya Fruit and Vegetable Processing Market Revenues & Volume, By Vegetables, 2022-2032F |
6.2 Kenya Fruit and Vegetable Processing Market, By Product |
6.2.1 Overview and Analysis |
6.2.2 Kenya Fruit and Vegetable Processing Market Revenues & Volume, By Fresh, 2022-2032F |
6.2.3 Kenya Fruit and Vegetable Processing Market Revenues & Volume, By Fresh-cut, 2022-2032F |
6.2.4 Kenya Fruit and Vegetable Processing Market Revenues & Volume, By Canned, 2022-2032F |
6.2.5 Kenya Fruit and Vegetable Processing Market Revenues & Volume, By Frozen, 2022-2032F |
6.2.6 Kenya Fruit and Vegetable Processing Market Revenues & Volume, By Dried, 2022-2032F |
6.3 Kenya Fruit and Vegetable Processing Market, By Processing Equipment |
6.3.1 Overview and Analysis |
6.3.2 Kenya Fruit and Vegetable Processing Market Revenues & Volume, By Pre-processing, 2022-2032F |
6.3.3 Kenya Fruit and Vegetable Processing Market Revenues & Volume, By Processing, 2022-2032F |
6.3.4 Kenya Fruit and Vegetable Processing Market Revenues & Volume, By Washing, 2022-2032F |
6.3.5 Kenya Fruit and Vegetable Processing Market Revenues & Volume, By Filling, 2022-2032F |
6.3.6 Kenya Fruit and Vegetable Processing Market Revenues & Volume, By Seasoning, 2022-2032F |
6.3.7 Kenya Fruit and Vegetable Processing Market Revenues & Volume, By Packaging, 2022-2032F |
7 Kenya Fruit and Vegetable Processing Market Import-Export Trade Statistics |
7.1 Kenya Fruit and Vegetable Processing Market Export to Major Countries |
7.2 Kenya Fruit and Vegetable Processing Market Imports from Major Countries |
8 Kenya Fruit and Vegetable Processing Market Key Performance Indicators |
8.1 Percentage of fruit and vegetable wastage reduced through processing and preservation techniques. |
8.2 Adoption rate of new processing technologies and techniques in the fruit and vegetable processing industry. |
8.3 Number of partnerships and collaborations between fruit and vegetable processing companies and local farmers to ensure a stable supply of raw materials. |
8.4 Average production efficiency and yield improvement in fruit and vegetable processing plants. |
8.5 Consumer satisfaction levels with processed fruit and vegetable products in terms of taste, quality, and availability. |
9 Kenya Fruit and Vegetable Processing Market - Opportunity Assessment |
9.1 Kenya Fruit and Vegetable Processing Market Opportunity Assessment, By Type, 2022 & 2032F |
9.2 Kenya Fruit and Vegetable Processing Market Opportunity Assessment, By Product, 2022 & 2032F |
9.3 Kenya Fruit and Vegetable Processing Market Opportunity Assessment, By Processing Equipment, 2022 & 2032F |
10 Kenya Fruit and Vegetable Processing Market - Competitive Landscape |
10.1 Kenya Fruit and Vegetable Processing Market Revenue Share, By Companies, 2025 |
10.2 Kenya Fruit and Vegetable Processing Market Competitive Benchmarking, By Operating and Technical Parameters |
11 Company Profiles |
12 Recommendations |
13 Disclaimer |
Global Go To Market Strategy - 2030
Export potential enables firms to identify high-growth global markets with greater confidence by combining advanced trade intelligence with a structured quantitative methodology. The framework analyzes emerging demand trends and country-level import patterns while integrating macroeconomic and trade datasets such as GDP and population forecasts, bilateral import–export flows, tariff structures, elasticity differentials between developed and developing economies, geographic distance, and import demand projections. Using weighted trade values from 2020–2024 as the base period to project country-to-country export potential for 2030, these inputs are operationalized through calculated drivers such as gravity model parameters, tariff impact factors, and projected GDP per-capita growth. Through an analysis of hidden potentials, demand hotspots, and market conditions that are most favorable to success, this method enables firms to focus on target countries, maximize returns, and global expansion with data, backed by accuracy.
By factoring in the projected importer demand gap that is currently unmet and could be potential opportunity, it identifies the potential for the Exporter (Country) among 190 countries, against the general trade analysis, which identifies the biggest importer or exporter.
To discover high-growth global markets and optimize your business strategy:
Click Here
Pricing
- Single User License$ 1,995
- Department License$ 2,400
- Site License$ 3,120
- Global License$ 3,795

Leadership Perspectives from Industry Events
Search
Thought Leadership and Analyst Meet


Our Clients
6WResearch In News
- India Air Conditioner Market Set for Strong Rebound in 2026 After Weather-Led Correction and GST-Driven Recovery: 6Wresearch
- ADAS in India: How Automatic Emergency Braking, Blind Spot Detection & Driver Monitoring are Transforming Road Safety
- Doha a strategic location for EV manufacturing hub: IPA Qatar
- Demand for luxury TVs surging in the GCC, says Samsung
- Empowering Growth: The Thriving Journey of Bangladesh’s Cable Industry
- Demand for luxury TVs surging in the GCC, says Samsung
Latest Reports
- Nicaragua RPG Gaming Market (2026-2032)
- New Zealand RPG Gaming Market (2026-2032)
- Netherlands RPG Gaming Market (2026-2032)
- Nauru RPG Gaming Market (2026-2032)
- Namibia RPG Gaming Market (2026-2032)
- Mozambique RPG Gaming Market (2026-2032)
- Montenegro RPG Gaming Market (2026-2032)
- Mongolia RPG Gaming Market (2026-2032)
- Monaco RPG Gaming Market (2026-2032)
- Micronesia RPG Gaming Market (2026-2032)
Industry Events and Analyst Meet

HIMTEX 2026

India Refining Summit 2026

India EV Show 2026

EV tech India Expo 2026

Auto Tech Asia 2026
Whitepaper
- Middle East & Africa Commercial Security Market Click here to view more.
- Middle East & Africa Fire Safety Systems & Equipment Market Click here to view more.
- GCC Drone Market Click here to view more.
- Middle East Lighting Fixture Market Click here to view more.
- GCC Physical & Perimeter Security Market Click here to view more.