Lithuania Microprinting Market (2026-2032) | Forecast, Industry, Analysis, Segmentation, Size, Value, Companies, Trends, Growth, Share, Revenue & Outlook
Market Forecast By Substrate Type (Plastic, Paper, Metal), By Print Type (Single-Sided, Double-Sided), By Type (Monochrome, Color), By Application (Banking & Finance, Government, Corporate, Packaging, Healthcare, Education, Other) And Competitive Landscape
| Product Code: ETC5584444 | Publication Date: Nov 2023 | Updated Date: Apr 2026 | Product Type: Market Research Report | |
| Publisher: 6Wresearch | Author: Ravi Bhandari | No. of Pages: 60 | No. of Figures: 30 | No. of Tables: 5 |
Lithuania Microprinting Market Size (2020-2030)
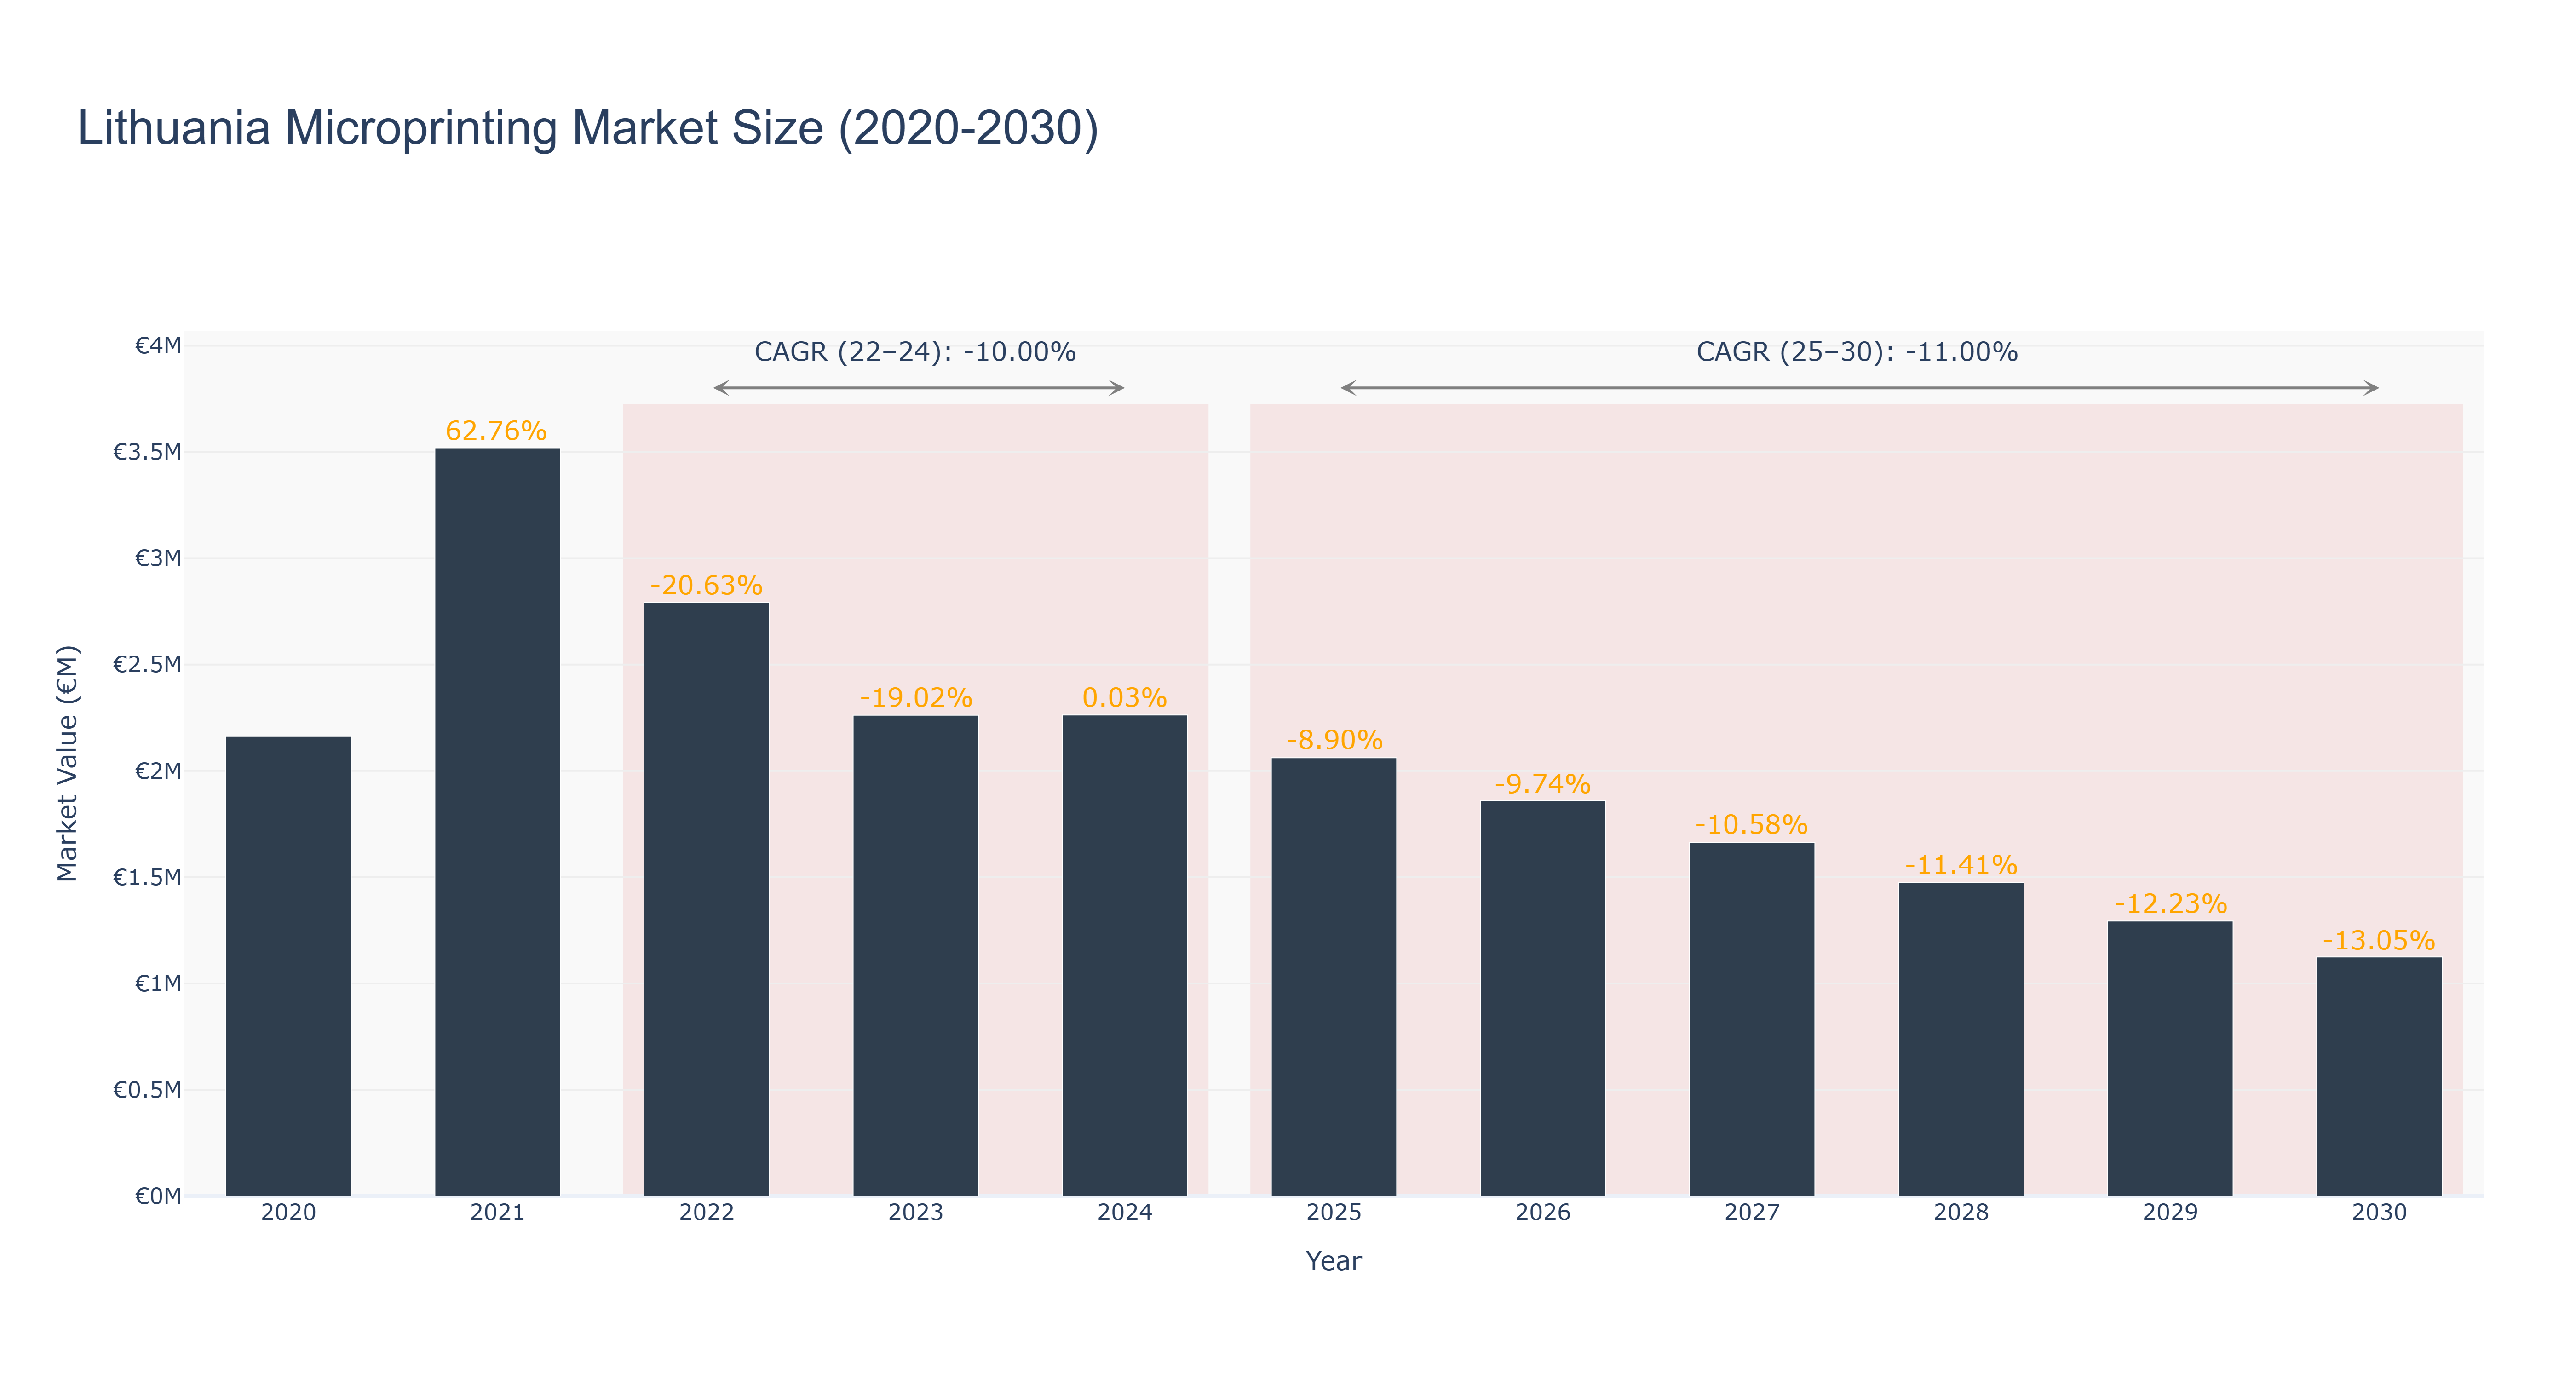
The Lithuania Microprinting Market experienced a peak market size of €3.52 million in 2021, followed by a decline to €2.26 million in 2024. The market is forecasted to further decrease to €1.12 million by 2030, with a CAGR of -10.99739113% from 2025 to 2030. The market has been on a downward trend since 2021, primarily driven by economic uncertainties and technological advancements leading to reduced demand. However, recent developments indicate a potential shift towards innovative security features in microprinting for enhanced document authentication, which could drive market growth in the near future. These developments align with the market's focus on maintaining security standards amidst evolving threats, positioning Lithuania as a key player in the microprinting industry.
Lithuania Microprinting Market: Production & Trade Performance (2019-2025)
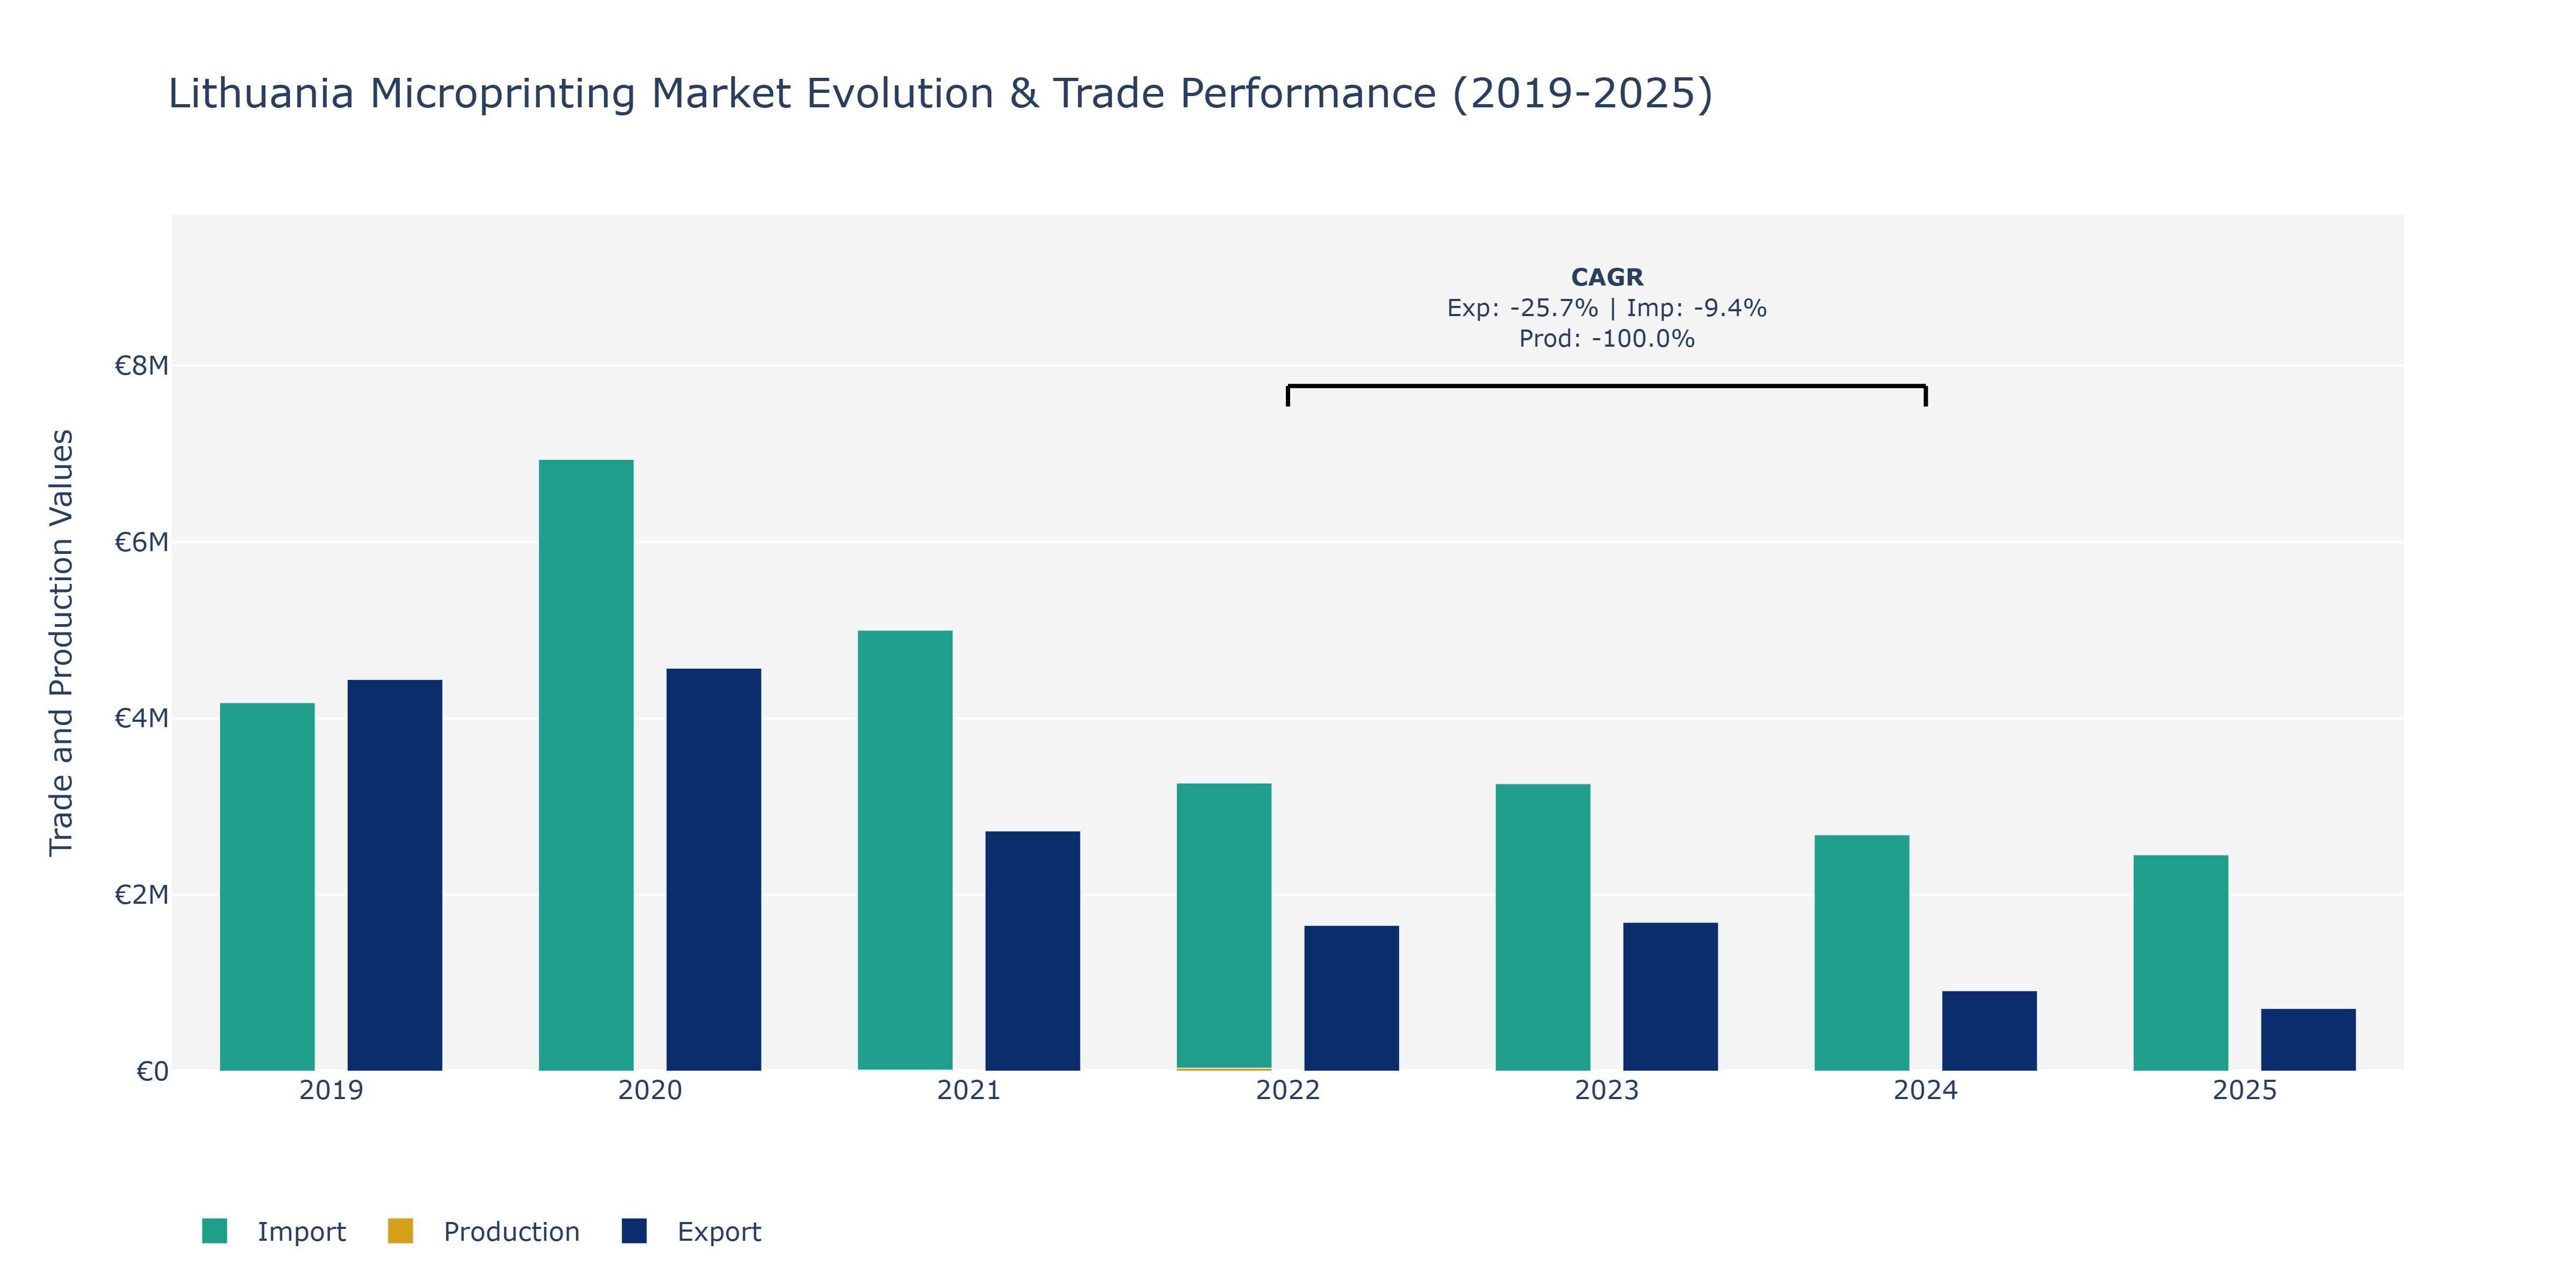
In the Lithuania Microprinting Market, from 2019 to 2025, there were notable fluctuations in Exports, Imports, and Production. Exports started at €4.44 million in 2019, increased to €4.57 million in 2020, and then experienced a decline to €0.71 million in 2025. Imports were €4.18 million in 2019, peaked at €6.94 million in 2020, and gradually decreased to €2.45 million in 2025. The sharp decline in Exports and Imports from 2020 to 2025 could be attributed to shifts in global trade patterns, economic conditions, or changes in demand for microprinting products. The notable spike in Production in 2022 might reflect increased domestic demand, technological advancements, or strategic investments in manufacturing capabilities within the Lithuanian market.
Key Highlights of the Report:
- Lithuania Microprinting Market Outlook
- Market Size of Lithuania Microprinting Market, 2025
- Forecast of Lithuania Microprinting Market, 2032
- Historical Data and Forecast of Lithuania Microprinting Revenues & Volume for the Period 2022 - 2032F
- Lithuania Microprinting Market Trend Evolution
- Lithuania Microprinting Market Drivers and Challenges
- Lithuania Microprinting Price Trends
- Lithuania Microprinting Porter`s Five Forces
- Lithuania Microprinting Industry Life Cycle
- Historical Data and Forecast of Lithuania Microprinting Market Revenues & Volume By Substrate Type for the Period 2022 - 2032F
- Historical Data and Forecast of Lithuania Microprinting Market Revenues & Volume By Plastic for the Period 2022 - 2032F
- Historical Data and Forecast of Lithuania Microprinting Market Revenues & Volume By Paper for the Period 2022 - 2032F
- Historical Data and Forecast of Lithuania Microprinting Market Revenues & Volume By Metal for the Period 2022 - 2032F
- Historical Data and Forecast of Lithuania Microprinting Market Revenues & Volume By Print Type for the Period 2022 - 2032F
- Historical Data and Forecast of Lithuania Microprinting Market Revenues & Volume By Single-Sided for the Period 2022 - 2032F
- Historical Data and Forecast of Lithuania Microprinting Market Revenues & Volume By Double-Sided for the Period 2022 - 2032F
- Historical Data and Forecast of Lithuania Microprinting Market Revenues & Volume By Type for the Period 2022 - 2032F
- Historical Data and Forecast of Lithuania Microprinting Market Revenues & Volume By Monochrome for the Period 2022 - 2032F
- Historical Data and Forecast of Lithuania Microprinting Market Revenues & Volume By Color for the Period 2022 - 2032F
- Historical Data and Forecast of Lithuania Microprinting Market Revenues & Volume By Application for the Period 2022 - 2032F
- Historical Data and Forecast of Lithuania Microprinting Market Revenues & Volume By Banking & Finance for the Period 2022 - 2032F
- Historical Data and Forecast of Lithuania Microprinting Market Revenues & Volume By Government for the Period 2022 - 2032F
- Historical Data and Forecast of Lithuania Microprinting Market Revenues & Volume By Corporate for the Period 2022 - 2032F
- Historical Data and Forecast of Lithuania Microprinting Market Revenues & Volume By Packaging for the Period 2022 - 2032F
- Historical Data and Forecast of Lithuania Microprinting Market Revenues & Volume By Healthcare for the Period 2022 - 2032F
- Historical Data and Forecast of Lithuania Microprinting Market Revenues & Volume By Education for the Period 2022 - 2032F
- Historical Data and Forecast of Lithuania Microprinting Market Revenues & Volume By Other for the Period 2022 - 2032F
- Lithuania Microprinting Import Export Trade Statistics
- Market Opportunity Assessment By Substrate Type
- Market Opportunity Assessment By Print Type
- Market Opportunity Assessment By Type
- Market Opportunity Assessment By Application
- Lithuania Microprinting Top Companies Market Share
- Lithuania Microprinting Competitive Benchmarking By Technical and Operational Parameters
- Lithuania Microprinting Company Profiles
- Lithuania Microprinting Key Strategic Recommendations
Frequently Asked Questions About the Market Study (FAQs):
6Wresearch actively monitors the Lithuania Microprinting Market and publishes its comprehensive annual report, highlighting emerging trends, growth drivers, revenue analysis, and forecast outlook. Our insights help businesses to make data-backed strategic decisions with ongoing market dynamics. Our analysts track relevent industries related to the Lithuania Microprinting Market, allowing our clients with actionable intelligence and reliable forecasts tailored to emerging regional needs.
Yes, we provide customisation as per your requirements. To learn more, feel free to contact us on sales@6wresearch.com
1 Executive Summary |
2 Introduction |
2.1 Key Highlights of the Report |
2.2 Report Description |
2.3 Market Scope & Segmentation |
2.4 Research Methodology |
2.5 Assumptions |
3 Lithuania Microprinting Market Overview |
3.1 Lithuania Country Macro Economic Indicators |
3.2 Lithuania Microprinting Market Revenues & Volume, 2022 & 2032F |
3.3 Lithuania Microprinting Market - Industry Life Cycle |
3.4 Lithuania Microprinting Market - Porter's Five Forces |
3.5 Lithuania Microprinting Market Revenues & Volume Share, By Substrate Type , 2022 & 2032F |
3.6 Lithuania Microprinting Market Revenues & Volume Share, By Print Type , 2022 & 2032F |
3.7 Lithuania Microprinting Market Revenues & Volume Share, By Type , 2022 & 2032F |
3.8 Lithuania Microprinting Market Revenues & Volume Share, By Application, 2022 & 2032F |
4 Lithuania Microprinting Market Dynamics |
4.1 Impact Analysis |
4.2 Market Drivers |
4.2.1 Increasing focus on enhancing security features in printed materials |
4.2.2 Growing demand for anti-counterfeiting solutions |
4.2.3 Advancements in technology leading to more sophisticated microprinting techniques |
4.3 Market Restraints |
4.3.1 High initial investment required for implementing microprinting solutions |
4.3.2 Limited awareness among potential end-users about the benefits of microprinting |
4.3.3 Regulatory challenges related to the use of certain microprinting technologies |
5 Lithuania Microprinting Market Trends |
6 Lithuania Microprinting Market Segmentations |
6.1 Lithuania Microprinting Market, By Substrate Type |
6.1.1 Overview and Analysis |
6.1.2 Lithuania Microprinting Market Revenues & Volume, By Plastic, 2022 - 2032F |
6.1.3 Lithuania Microprinting Market Revenues & Volume, By Paper, 2022 - 2032F |
6.1.4 Lithuania Microprinting Market Revenues & Volume, By Metal, 2022 - 2032F |
6.2 Lithuania Microprinting Market, By Print Type |
6.2.1 Overview and Analysis |
6.2.2 Lithuania Microprinting Market Revenues & Volume, By Single-Sided, 2022 - 2032F |
6.2.3 Lithuania Microprinting Market Revenues & Volume, By Double-Sided, 2022 - 2032F |
6.3 Lithuania Microprinting Market, By Type |
6.3.1 Overview and Analysis |
6.3.2 Lithuania Microprinting Market Revenues & Volume, By Monochrome, 2022 - 2032F |
6.3.3 Lithuania Microprinting Market Revenues & Volume, By Color, 2022 - 2032F |
6.4 Lithuania Microprinting Market, By Application |
6.4.1 Overview and Analysis |
6.4.2 Lithuania Microprinting Market Revenues & Volume, By Banking & Finance, 2022 - 2032F |
6.4.3 Lithuania Microprinting Market Revenues & Volume, By Government, 2022 - 2032F |
6.4.4 Lithuania Microprinting Market Revenues & Volume, By Corporate, 2022 - 2032F |
6.4.5 Lithuania Microprinting Market Revenues & Volume, By Packaging, 2022 - 2032F |
6.4.6 Lithuania Microprinting Market Revenues & Volume, By Healthcare, 2022 - 2032F |
6.4.7 Lithuania Microprinting Market Revenues & Volume, By Education, 2022 - 2032F |
7 Lithuania Microprinting Market Import-Export Trade Statistics |
7.1 Lithuania Microprinting Market Export to Major Countries |
7.2 Lithuania Microprinting Market Imports from Major Countries |
8 Lithuania Microprinting Market Key Performance Indicators |
8.1 Adoption rate of microprinting technology by key industries in Lithuania |
8.2 Number of patents filed for innovative microprinting techniques |
8.3 Percentage of counterfeit incidents reduced due to the implementation of microprinting solutions |
9 Lithuania Microprinting Market - Opportunity Assessment |
9.1 Lithuania Microprinting Market Opportunity Assessment, By Substrate Type , 2022 & 2032F |
9.2 Lithuania Microprinting Market Opportunity Assessment, By Print Type , 2022 & 2032F |
9.3 Lithuania Microprinting Market Opportunity Assessment, By Type , 2022 & 2032F |
9.4 Lithuania Microprinting Market Opportunity Assessment, By Application, 2022 & 2032F |
10 Lithuania Microprinting Market - Competitive Landscape |
10.1 Lithuania Microprinting Market Revenue Share, By Companies, 2025 |
10.2 Lithuania Microprinting Market Competitive Benchmarking, By Operating and Technical Parameters |
11 Company Profiles |
12 Recommendations | 13 Disclaimer |
Global Go To Market Strategy - 2030
Export potential enables firms to identify high-growth global markets with greater confidence by combining advanced trade intelligence with a structured quantitative methodology. The framework analyzes emerging demand trends and country-level import patterns while integrating macroeconomic and trade datasets such as GDP and population forecasts, bilateral import–export flows, tariff structures, elasticity differentials between developed and developing economies, geographic distance, and import demand projections. Using weighted trade values from 2020–2024 as the base period to project country-to-country export potential for 2030, these inputs are operationalized through calculated drivers such as gravity model parameters, tariff impact factors, and projected GDP per-capita growth. Through an analysis of hidden potentials, demand hotspots, and market conditions that are most favorable to success, this method enables firms to focus on target countries, maximize returns, and global expansion with data, backed by accuracy.
By factoring in the projected importer demand gap that is currently unmet and could be potential opportunity, it identifies the potential for the Exporter (Country) among 190 countries, against the general trade analysis, which identifies the biggest importer or exporter.
To discover high-growth global markets and optimize your business strategy:
Click Here
Pricing
- Single User License$ 1,995
- Department License$ 2,400
- Site License$ 3,120
- Global License$ 3,795

Leadership Perspectives from Industry Events
Search
Thought Leadership and Analyst Meet


Our Clients
6WResearch In News
- India Air Conditioner Market Set for Strong Rebound in 2026 After Weather-Led Correction and GST-Driven Recovery: 6Wresearch
- ADAS in India: How Automatic Emergency Braking, Blind Spot Detection & Driver Monitoring are Transforming Road Safety
- Doha a strategic location for EV manufacturing hub: IPA Qatar
- Demand for luxury TVs surging in the GCC, says Samsung
- Empowering Growth: The Thriving Journey of Bangladesh’s Cable Industry
- Demand for luxury TVs surging in the GCC, says Samsung
Latest Reports
- Nicaragua RPG Gaming Market (2026-2032)
- New Zealand RPG Gaming Market (2026-2032)
- Netherlands RPG Gaming Market (2026-2032)
- Nauru RPG Gaming Market (2026-2032)
- Namibia RPG Gaming Market (2026-2032)
- Mozambique RPG Gaming Market (2026-2032)
- Montenegro RPG Gaming Market (2026-2032)
- Mongolia RPG Gaming Market (2026-2032)
- Monaco RPG Gaming Market (2026-2032)
- Micronesia RPG Gaming Market (2026-2032)
Industry Events and Analyst Meet

HIMTEX 2026

India Refining Summit 2026

India EV Show 2026

EV tech India Expo 2026

Auto Tech Asia 2026
Whitepaper
- Middle East & Africa Commercial Security Market Click here to view more.
- Middle East & Africa Fire Safety Systems & Equipment Market Click here to view more.
- GCC Drone Market Click here to view more.
- Middle East Lighting Fixture Market Click here to view more.
- GCC Physical & Perimeter Security Market Click here to view more.