Country Details & Export Potential Analysis
6Wresearch ExportGTM is a unified export market intelligence section for reviewing country-level export potential analysis, tariff exposure, tariff matrix, market concentration, HHI comparison, new opportunity signals, and country-to-country benchmarking in one analytical view.
Selected Country
India
Dynamic country profile view
Export Potential
82.4
Opportunity attractiveness index
Average Tariff
11.8%
Market access indicator
HHI Concentration
Moderate
Supplier concentration signal
Country Details View
The country details section gives users a structured view of one selected country by combining export potential analysis, tariff intelligence, competitive concentration, opportunity gaps, and trade intelligence indicators drawn from live trade flow analytics.
Primary Objective
Help users understand whether the selected country is commercially attractive, accessible, competitive, and strategically relevant for global expansion and export growth.
Export Potential
Shows the country's opportunity index based on demand strength, import growth, exporter fit, trade value, growth signals, and product-level potential.
Tariff Matrix
Displays tariff exposure across countries, products, and HS codes to help users identify market access barriers and preferential trade opportunities.
Tariff Chart
Converts tariff rates into a visual comparison so users can quickly assess whether a target market has low, moderate, or high tariff pressure.
HHI Comparison
Compares supplier concentration levels across countries to identify whether the market is fragmented, moderately concentrated, or dominated by a few exporters.
New Opportunity Chart
Highlights emerging export opportunities by identifying markets where demand is rising, current export participation is low, tariffs are manageable, and competitive intensity leaves room for new entrants.
Country Details Charts
Each section below coordinates targeted structural data text alongside side-aligned data visualizations to present the comprehensive ExportGTM trade intelligence suite without unnecessary layout gaps.
Export Potential Chart
Shows country-level opportunity metrics and disaggregated product potential.
This dynamic export potential analysis aggregates trade velocity records, consumer purchase indicators, underlying product-class market synergy, and target territory volume demand histories inside one system framework. It guides market profiling steps by proving exactly where real sovereign consumer demand intersects cleanly with exporter production limits.
By contextualizing absolute size variables side by side with true growth speed calculations, this trade flow analytics engine isolates real development routes while shielding manufacturers, trade promotion boards, and independent brokers from allocating valuable infrastructure budgets into stagnant nominal territories.
Market Signal
Demand Density Peak
Operation Level
Territory Screening
Core Output
Prioritized Node List
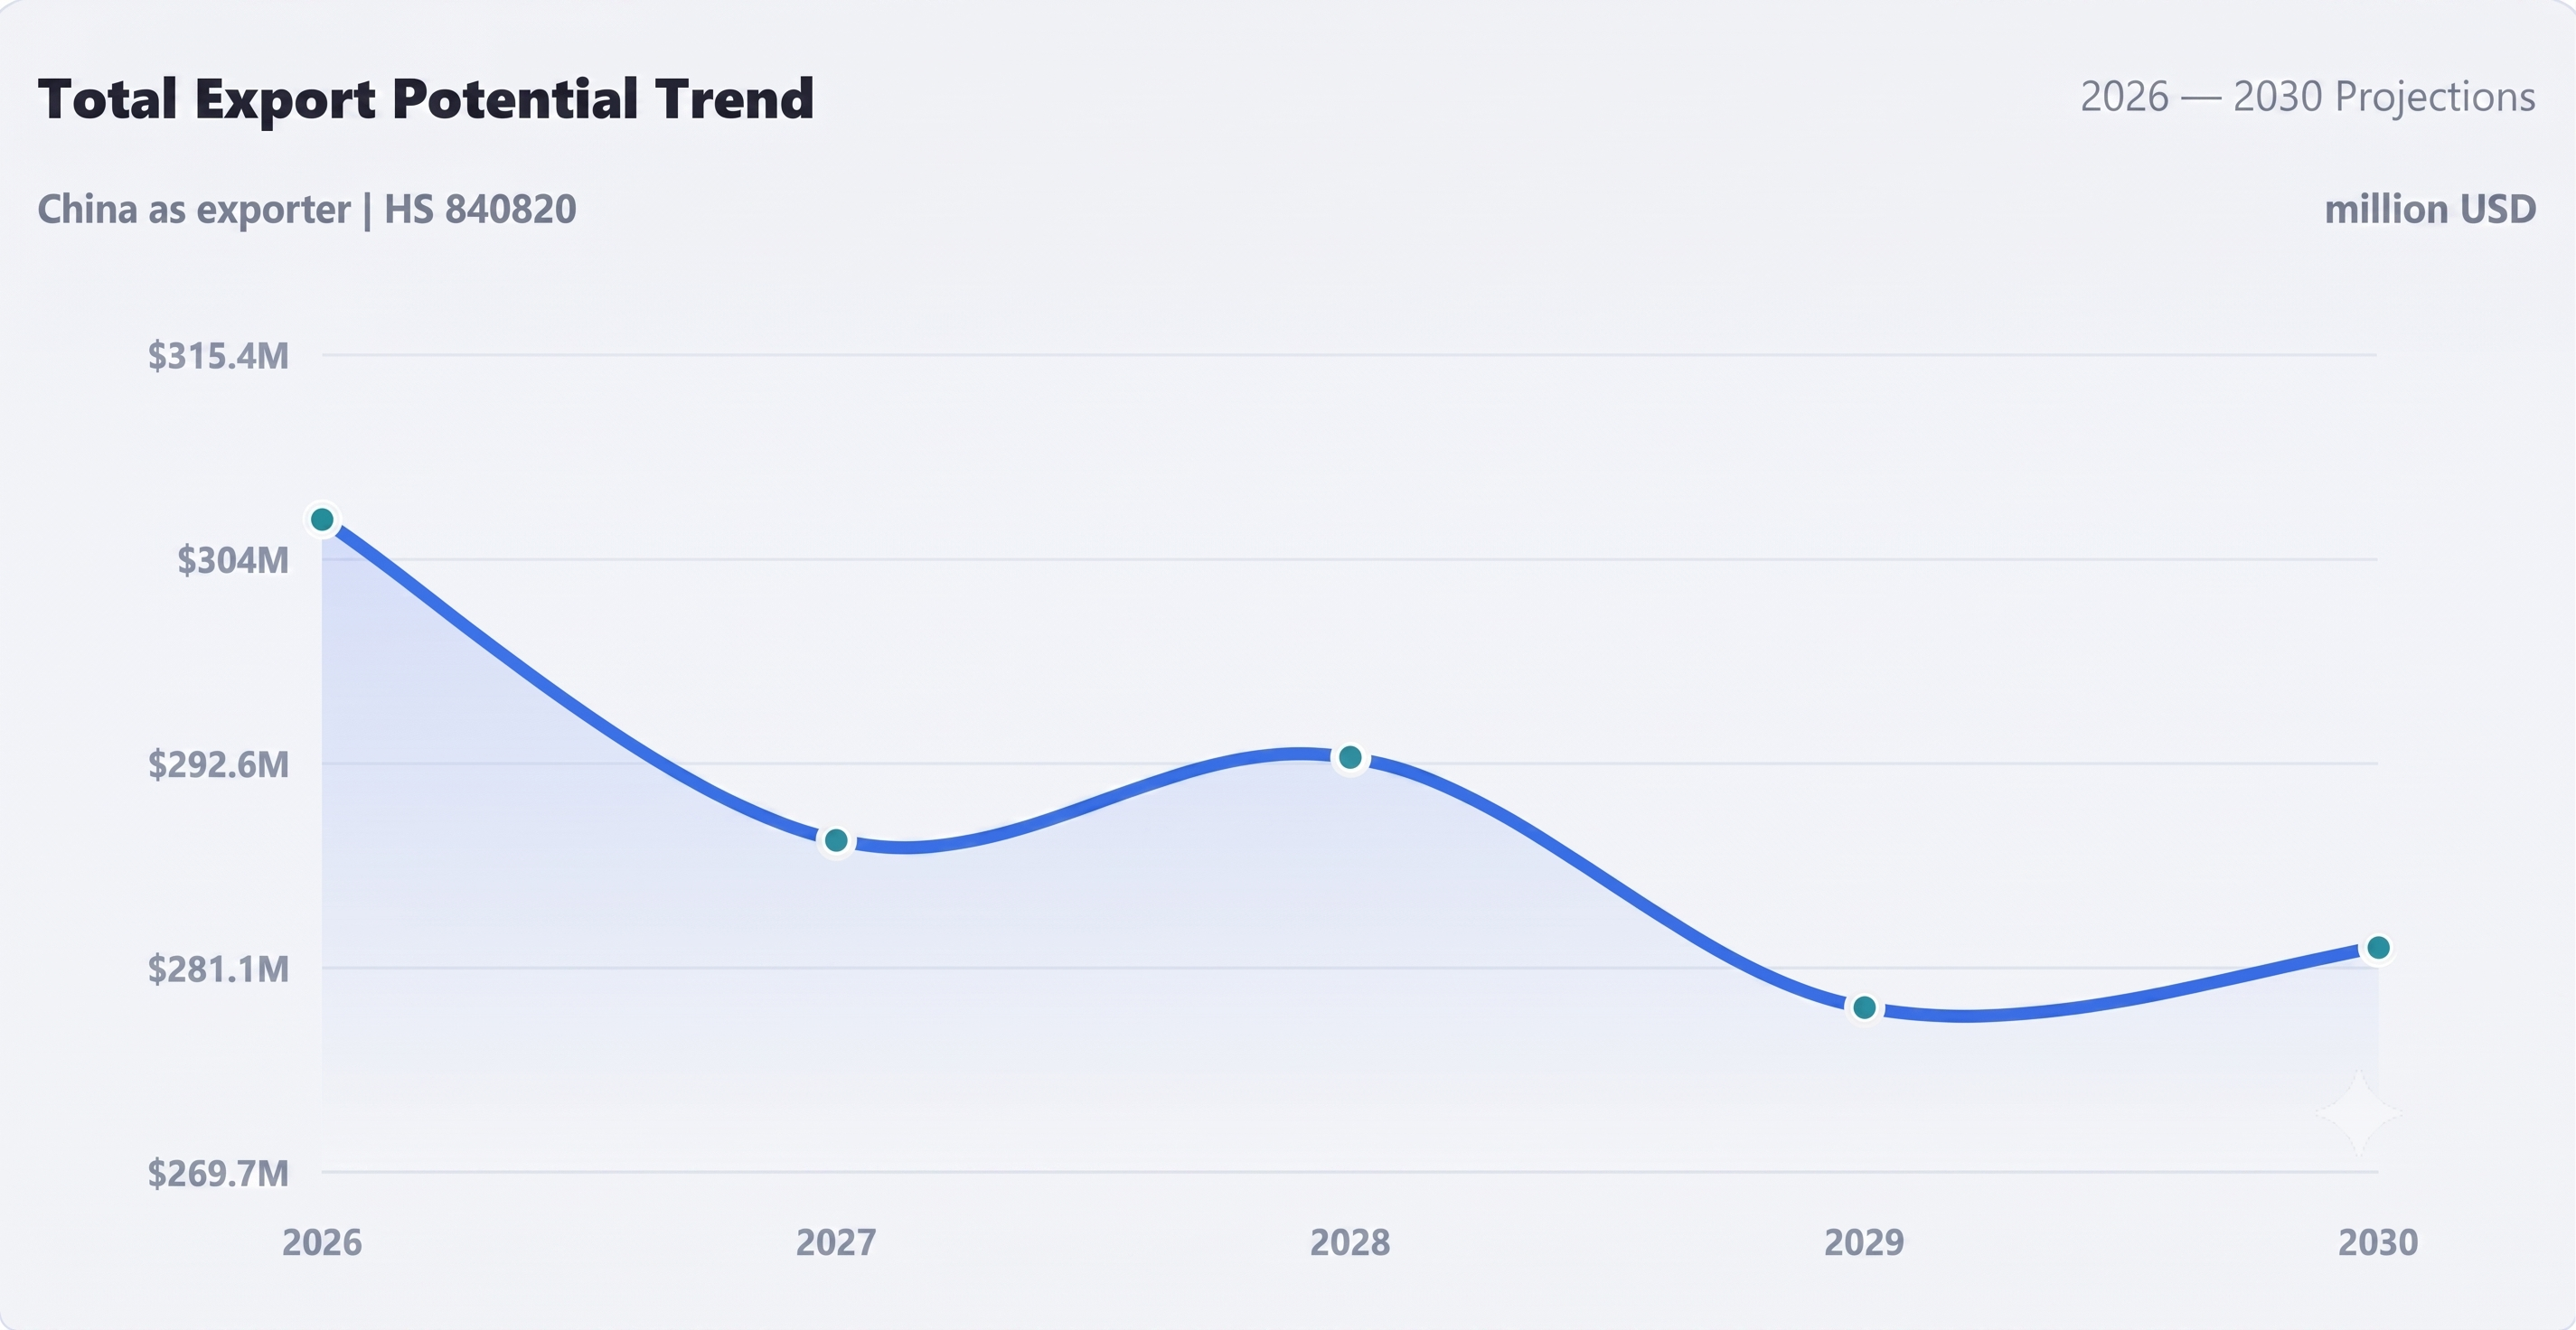
Figure 1.1: Export Potential chart comparing current exports with untapped export potential across destination countries.
Tariff Matrix
The global tariff calculation module allows commercial business planners to review cross-border duties across any custom destination group or selected commodity classification. It explicitly charts where custom fees are structurally elevated, where trade policy waivers reduce risk, and where granular adjustments inside sub-heading product groups transform overall financial feasibility.
This built-in tariff simulation coordinates raw statutory limits alongside applied exceptions and international regional treaty records. This enables trading nations and small business operations alike to build legal alternative pathways that preserve capitalization margins during direct route rollout steps.
- Validates disaggregated duty levels across separate target gateways.
- Maps operational discrepancies between generic codes to optimize selections.
- Hardens margin protection playbooks before deploying physical infrastructure.
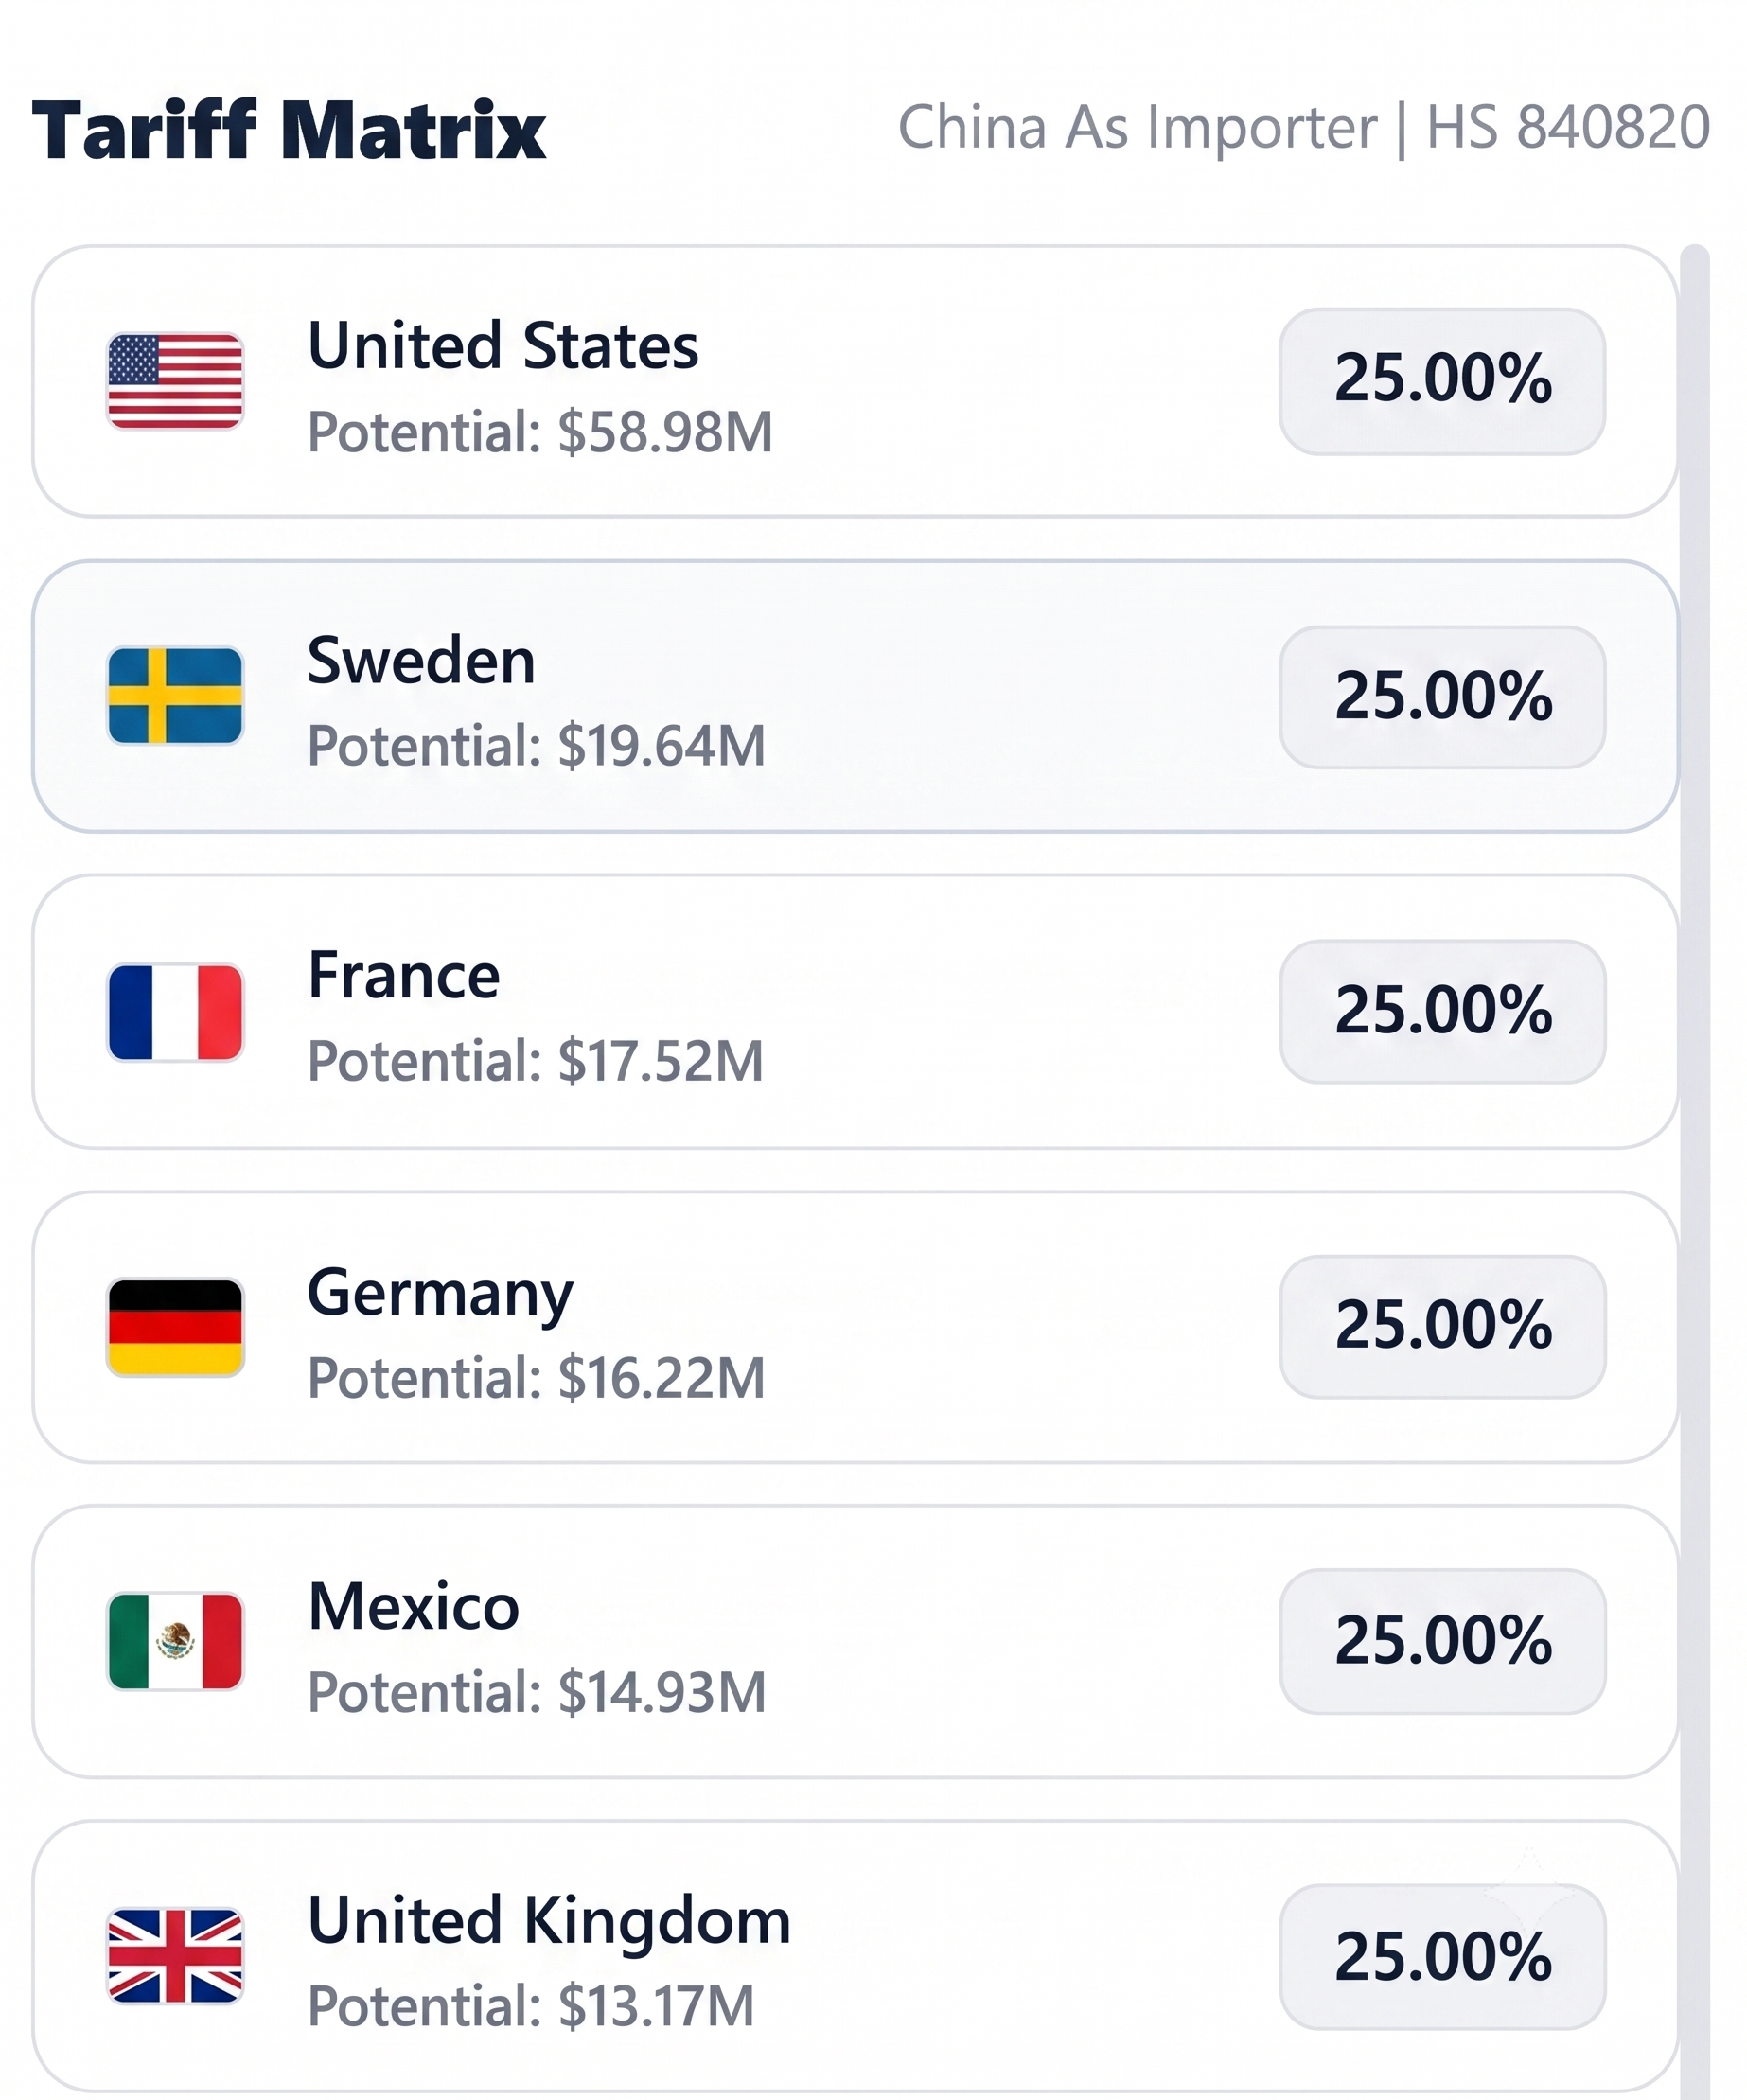
Figure 1.2: Tariff Matrix displaying applicable import tariff rates for the selected product across major destination countries.
Tariff Chart
Visualizes entry tax levels and structural market-access friction points.
This presentation module structures complex duty schedules into a clear, single-canvas fiscal overview. Planners can immediately balance low-barrier entry options directly against high-duty protectionist regions, identify where landing costs are likely to suppress operational profit layers, and decide which destinations require localized logistics adjustments.
ExportGTM coordinates these graphic duty metrics to highlight true competitive parameters. Running a quick tariff simulation across alternate routes keeps global operations aware of cost risks before entering formal procurement discussions or setting long-term price targets for regional buyers.
Operational Insight
High local consumption rates can be misleading if protective customs barriers block the route. Balancing absolute consumption volumes against real fiscal friction levels is essential for accurate margin protection.
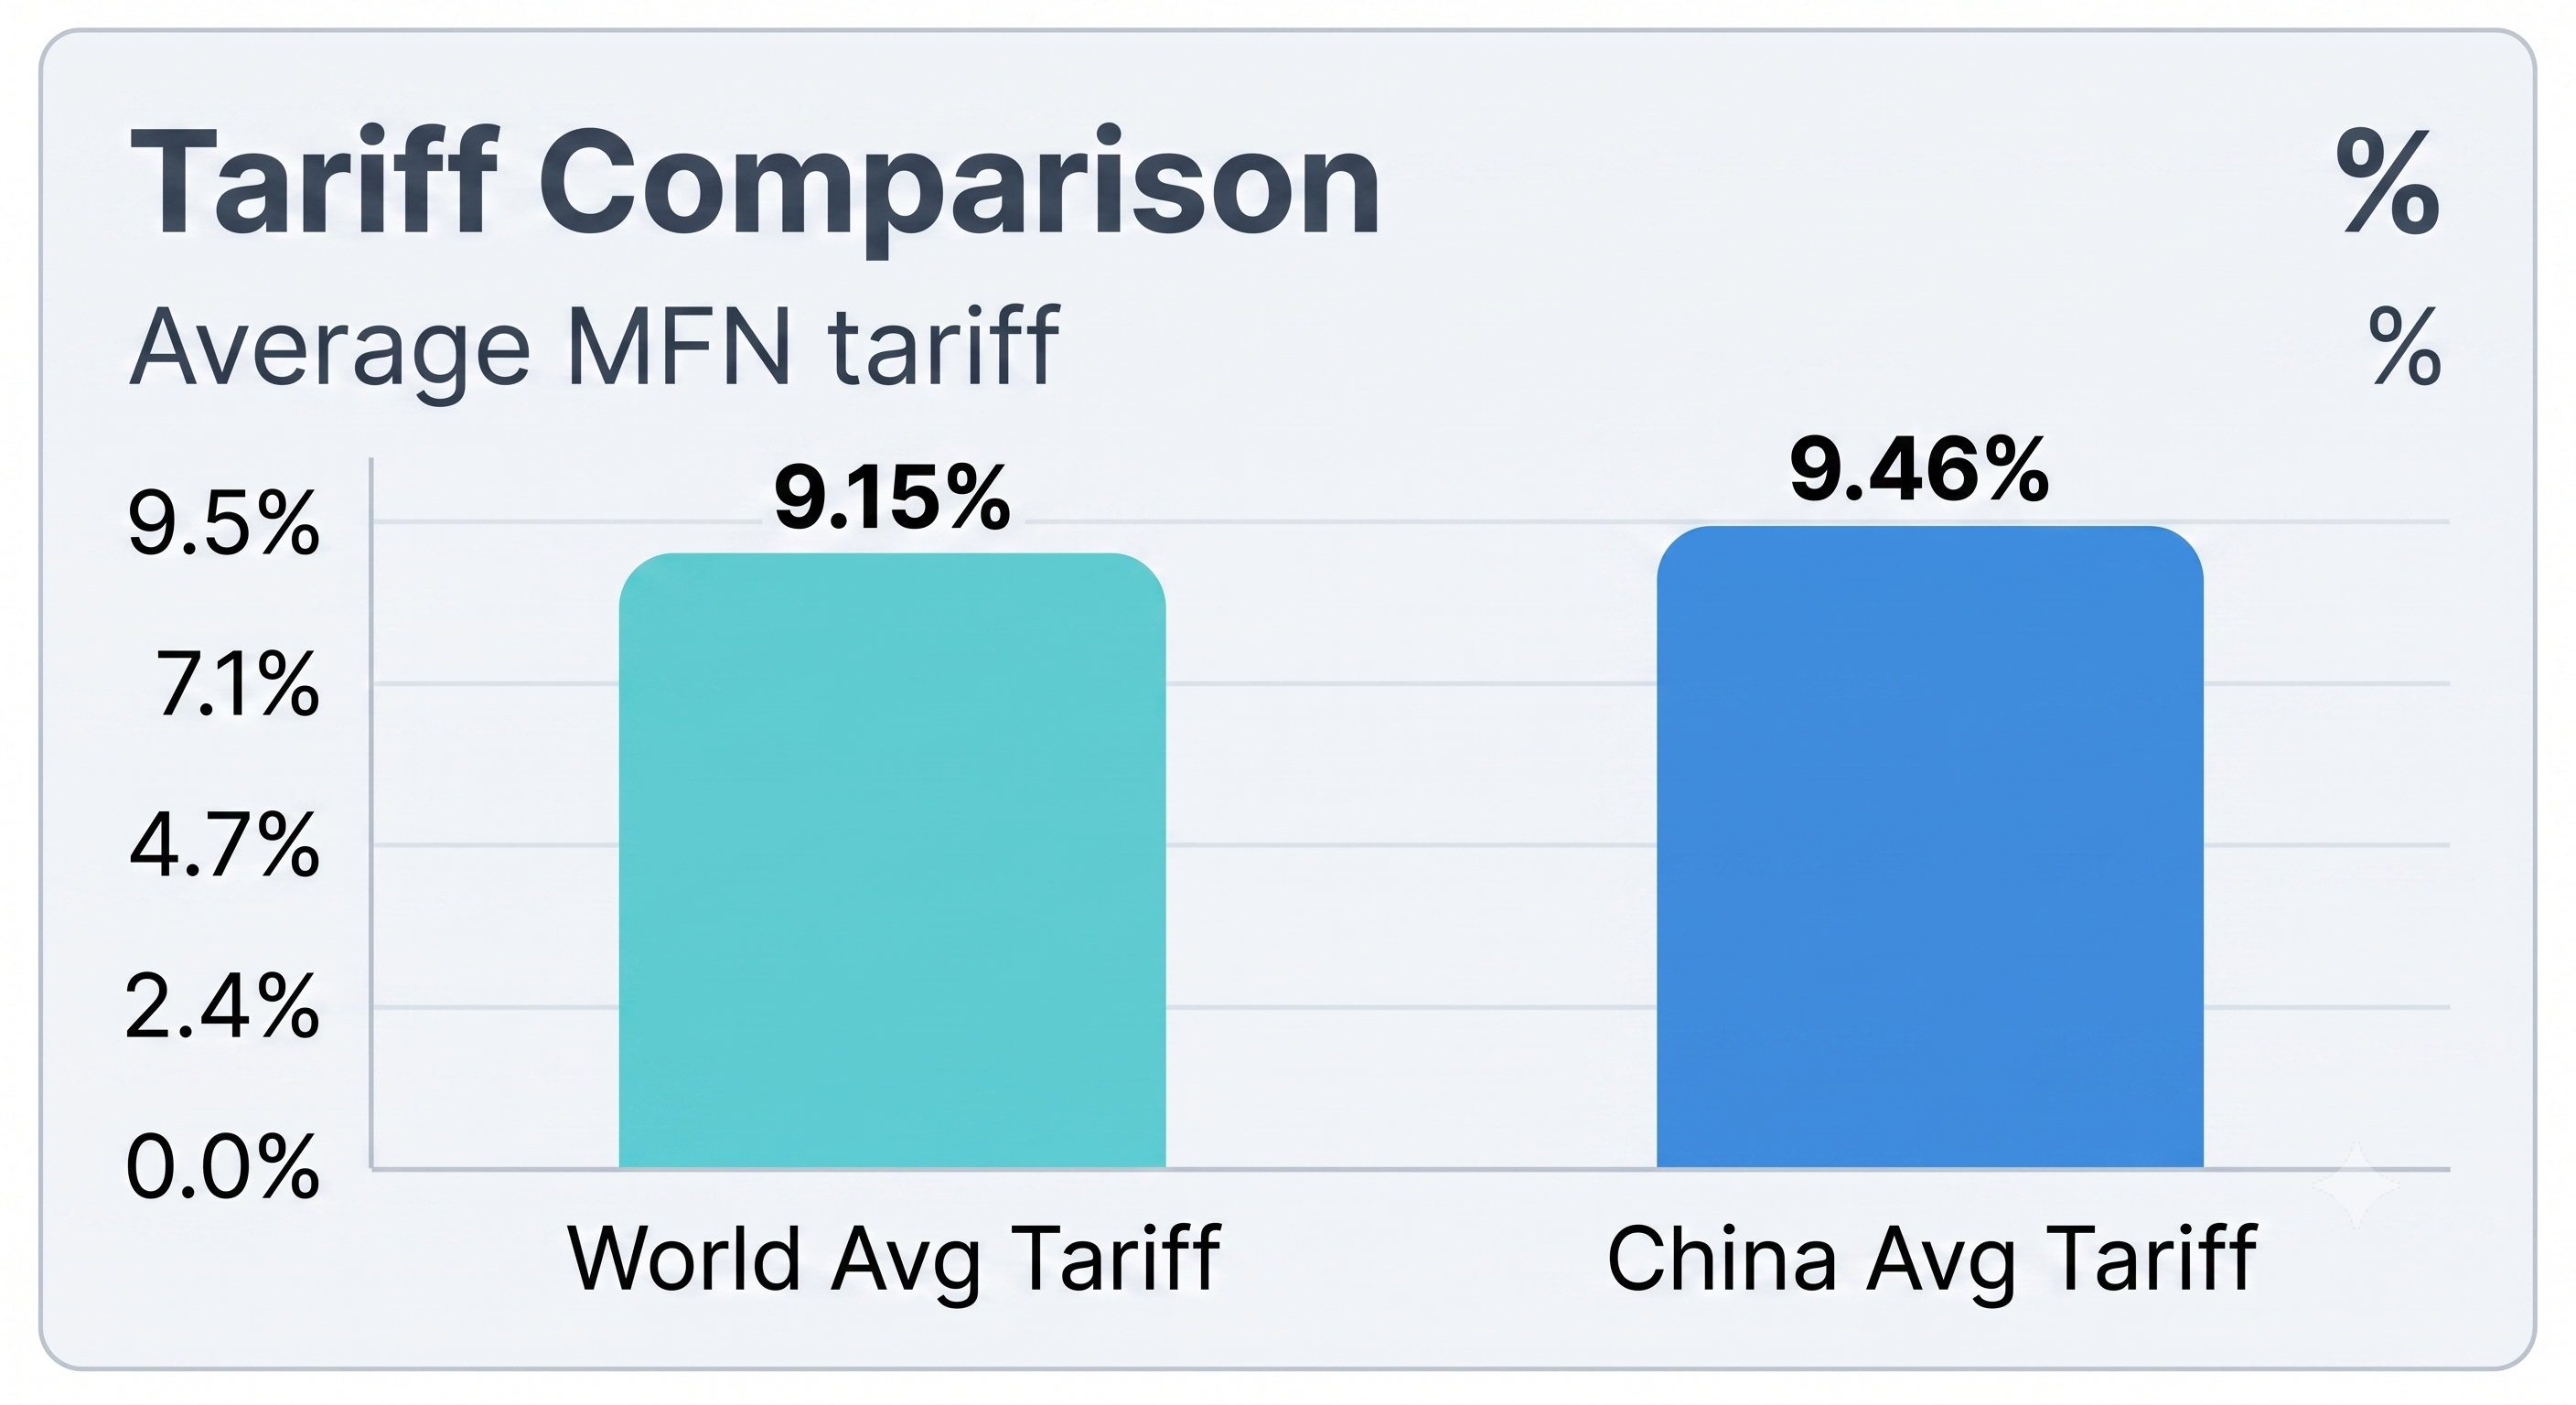
Figure 1.3: Comparative Tariff chart illustrating import duty levels across destination countries for the selected product.
HHI Comparison Chart
Benchmarks supplier concentration ratios and systemic market integration scales.
The Herfindahl-Hirschman Index dashboard shows whether a target country's import needs are distributed across a varied network of origins or locked down by an entrenched group of legacy providers. This provides a direct indicator for evaluating entry difficulties, distribution channel flexibility, sudden price competition patterns, and the statistical likelihood that a new market entry can gain stable shelf share.
Tracking supply concentration levels informs your broader go-to-market strategy. Highly concentrated networks require specific product differentiation or tariff-advantage strategies, whereas highly distributed sectors allow smaller operators to establish immediate sales volume.
Low HHI Value Range
Open network structure allowing rapid, flexible multi-tier partner acquisition.
High HHI Value Range
Legacy supplier lock-in present. Requires pricing advantages or unique features.
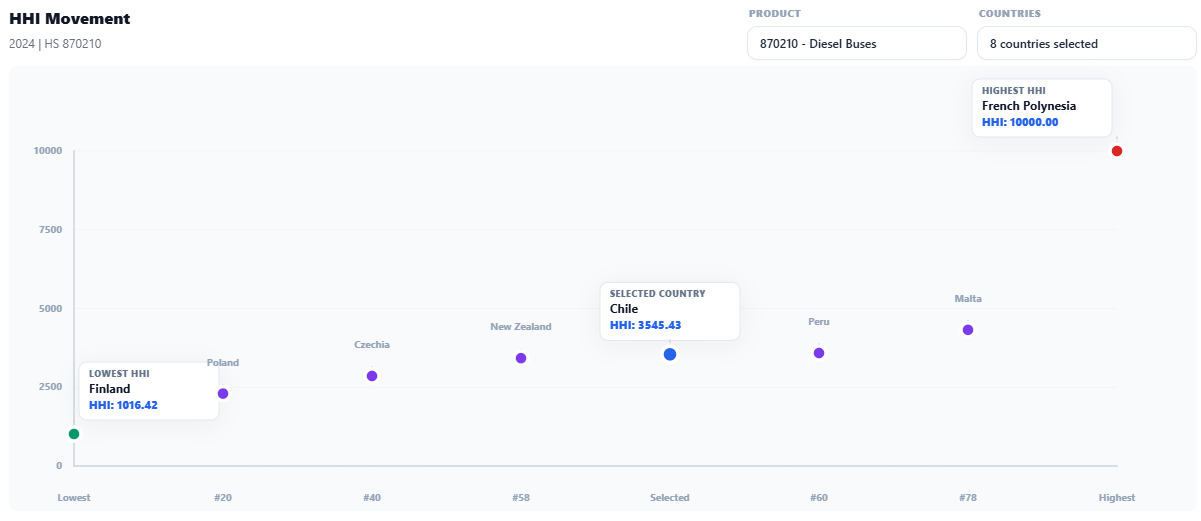
Figure 1.4: HHI Comparison chart showing supplier concentration and market competitiveness across importing countries.
New Opportunity Chart
Highlights rising target zones where consumer demand and entry conditions match.
Surfacing new target opportunities helps businesses uncover unexploited niche markets rather than focusing only on highly competitive, obvious core countries. This filtering track separates out regions where inbound volumes are accelerating, external competitor presence is low, local duties are manageable, and initial channel penetration remains cost-effective.
ExportGTM processes these parameters to illuminate clear alternative routes for global expansion. This allows small traders and enterprise expansion teams alike to secure early distribution rights before major competitors congest the corridor.
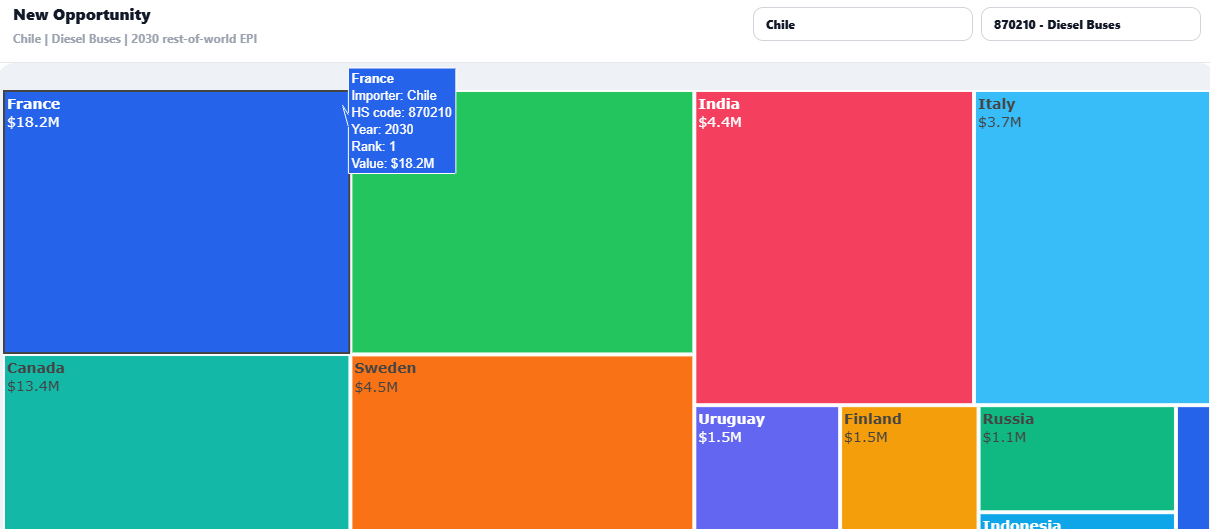
Figure 1.5: New Opportunity chart identifying high-potential export markets based on demand growth and untapped trade opportunities.
Product Trade Route
Traces complete product logic journeys from baseline demand down to final positioning options.
This dashboard element shows how a selected product line moves through each step of the modern trade flow analytics system. It logically links localized buyer demand spikes, baseline capacity estimates, external competitive positions, and final viability scores so users can confirm exactly why a specific entry plan makes sense.
This structural framework unifies your entire pipeline, translating global Customs and Excise data directly into practical operational plans that align with current cross-border requirements and support a clear go-to-market strategy.
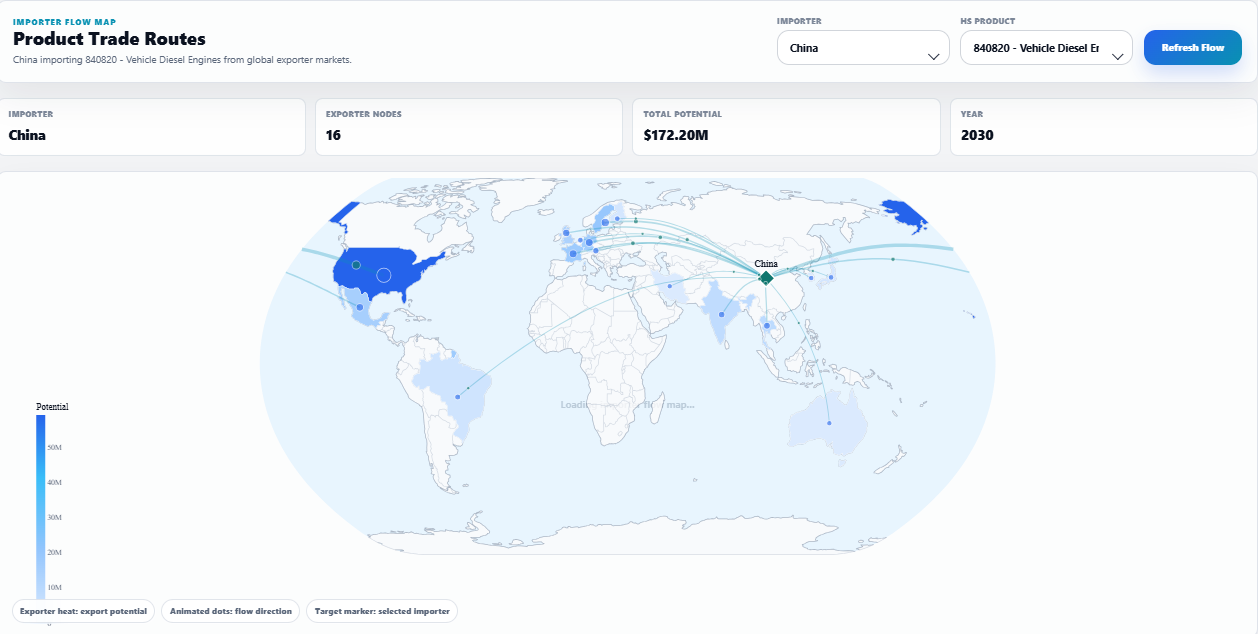
Figure 1.6: End-to-end analytical pipeline linking primary consumption vectors to target fulfillment strategies.
Country Benchmarking
This country benchmarking area lets operators compare multiple destination profiles at once, weighing key expansion criteria like total demand value, custom rates, supplier concentrations, and risk weights on a single dashboard.
By presenting international data sets on a single baseline, 6Wresearch ExportGTM helps eliminate regional bias. Decision-makers can quickly weigh alternative routes, confirm compliance conditions, and evaluate margin potential directly against absolute volume capacity scales.
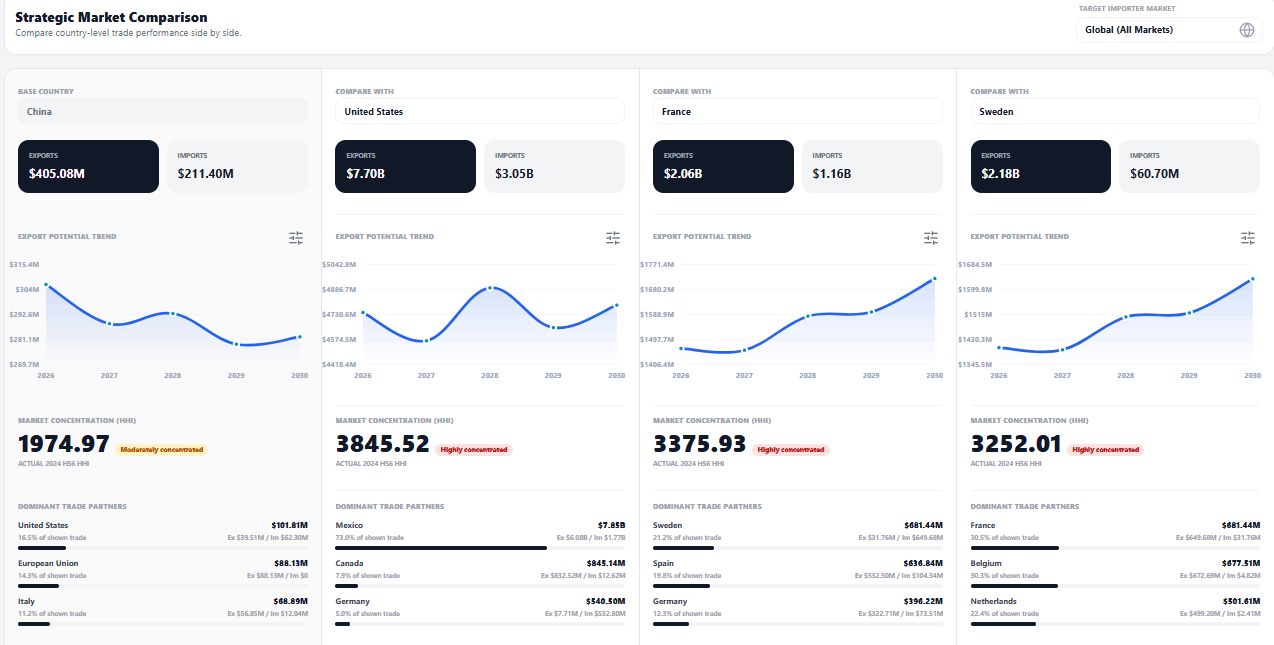
Figure 2.1: Country Comparison dashboard benchmarking export potential, tariffs, and concentration indicators across multiple countries.
Decision Outputs
The section converts chart outputs and country metrics into decision-ready guidance for your export market intelligence and go-to-market strategy.
Market Prioritization
Helps users rank countries based on opportunity size, export potential, competitive intensity, tariff conditions, and entry attractiveness.
Market Access Assessment
Shows tariff exposure, trade barriers, supplier concentration, and market risks before users commit to export expansion.
Opportunity Discovery
Identifies new and underpenetrated export opportunities where demand is expanding and the competitive landscape still allows room for entry.


