Africa Recloser Market Outlook (2018-2024) | Trends, Analysis, Size, Industry, Growth, Share, Forecast, COVID-19 IMPACT, Companies, Value & Revenue
Market Forecast By Voltage Rating (< 27 KV And 27 KV & Above), By Insulation Type (Gas, Vacuum And Others), By Applications (Power Distribution And Industrial), By End Users (Distribution Utilities And Others Including Railway And Industrial), By Countries (South Africa, Nigeria, Tanzania, Kenya And Rest of Africa) And Competitive Landscape
| Product Code: ETC004640 | Publication Date: Jul 2022 | Product Type: Market Research Report | ||
| Publisher: 6Wresearch | Author: Ravi Bhandari | No. of Pages: 150 | No. of Figures: 24 | No. of Tables: 12 |
Africa Recloser market report comprehensively covers the market by voltage types, insulation types, applications, end-users, and countries. The Africa recloser market outlook report provides an unbiased and detailed analysis of the Africa recloser market trends, opportunities/high growth areas, and market drivers which would help the stakeholders to devise and align their market strategies according to the current and future market dynamics.
Africa Recloser Market Synopsis
Africa recloser market is anticipated to project substantial growth on account of expansion of the power sector. Additionally, construction of large-scale commercial projects, strengthening of non-oil sectors, as well as infrastructure development activities will further boost growth of the market over the coming years. However, the market witnessed slow growth during the outbreak of Covid-19 pandemic.
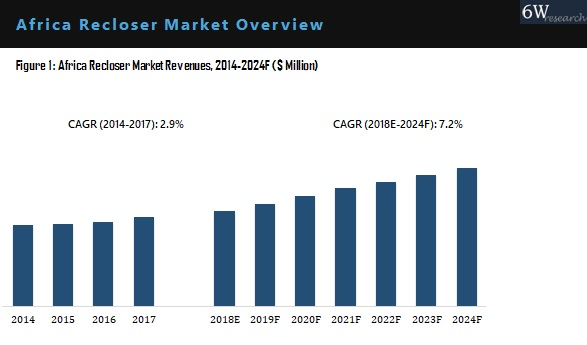
According to 6Wresearch, Africa Recloser market size grew at a CAGR of 7.2% during 2018-24. The increase in power generation capacities during recent and upcoming years, is mainly implemented through renewable energy sources, marking a shift from power generation through the conventional energy sources. Implementation of Projects including Medupi Power Station Projects Unit 1-4 in South Africa, Kinyerezi II plant in Tanzania, Last Mile Connectivity Programme in Kenya, is expected to drive the African Recloser Market, during the forecast period.
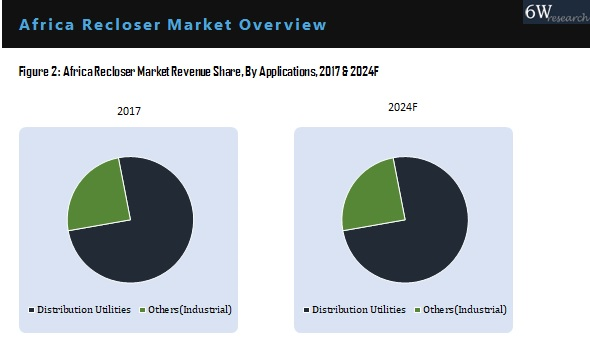
Market Analysis By Applications
The distribution utilities application acquired the highest revenue share in the overall Africa Recloser market. Additionally, the increasing electricity demand and a subsequent shift towards the widespread adoption of clean energy initiatives is therefore, likely to boost the load break switch market growth during the forecast period.
Key Attractiveness of the Report
- COVID-19 Impact on the Market.
- 6 Years Market Numbers.
- Estimated Data Starting from 2018 to 2024F.
- Base Year: 2017
- Forecast Data Until 2024F.
- Key Performance Indicators Impacting the Market.
- Major Upcoming Developments and Projects.
Key Highlights of the Report:
- Africa Recloser Market Overview
- Africa Recloser Market Outlook
- Africa Recloser Market Forecast
- Historical Data of Africa Recloser Market Revenues for the Period, 2014-2017
- Africa Recloser Market Size & Africa Recloser Market Forecast, until 2024
- Historical Data of Africa Recloser Market Revenues for the Period, 2014-2017
- Market Size & Forecast of Africa Recloser Market Revenues, until 2024
- Historical Data of Africa Recloser Market Revenues for the Period, 2014-2017
- Market Size & Forecast of Africa Recloser Market Revenues, until 2024
- Historical Data of Africa Recloser Market Revenues by Voltage Type for the Period, 2014-2017
- Market Size & Forecast of Africa Recloser Market Revenues, until 2024
- Historical Data of Africa Recloser Market Revenues by Voltage Type for the Period, 2014-2017
- Market Size & Forecast of Africa Recloser Market Revenues by Voltage Type, until 2024
- Historical Data of Africa Recloser Market Revenues by Voltage Type for the Period, 2014-2017
- Market Size & Forecast of Africa Recloser Market Revenues by Voltage Type, until 2024
- Historical Data of Africa Recloser Market Revenues by Voltage Type for the Period, 2014-2017
- Market Size & Forecast of Africa Recloser Market Revenues by Voltage Type, until 2024
- Market Size & Forecast of Africa Recloser Market Revenues by Countries, until 2024
- Market Drivers and Restraints
- Africa Recloser Market Trends and Developments
- Africa Recloser Market Overview on Competitive Landscape
- Africa Recloser Market Share, By Players
- Strategic Recommendations
Market Scope and Segmentation
Thereportprovides a detailed analysis of the following market segments:
- By Voltage Ratings
- < 27 KV
- 27 KV and Above
- By Insulation Types:
- Gas
- Vacuum
- Others
- By Applications:
- Power Distribution
- Industrial
- By End Users:
- Distribution Utilities
- Others (Railway and Industrial)
By Countries:
- South Africa
- Nigeria
- Tanzania
- Kenya
Frequently Asked Questions About the Market Study (FAQs):
6Wresearch actively monitors the Africa Recloser Market and publishes its comprehensive annual report, highlighting emerging trends, growth drivers, revenue analysis, and forecast outlook. Our insights help businesses to make data-backed strategic decisions with ongoing market dynamics. Our analysts track relevent industries related to the Africa Recloser Market, allowing our clients with actionable intelligence and reliable forecasts tailored to emerging regional needs.
Yes, we provide customisation as per your requirements. To learn more, feel free to contact us on sales@6wresearch.com
| 1. Executive Summary |
| 2. Introduction |
| 2.1. Report Description |
| 2.2. Key Highlights of the Report |
| 2.3. Market Scope & Segmentation |
| 2.4. Methodology Adopted and Key Data Points |
| 2.5. Assumptions |
| 3. Africa Recloser Market Overview |
| 3.1. Africa Recloser Market Revenues, 2014-2024F |
| 3.2. Africa Recloser Market Revenues, 2014-2024F |
| 3.3. Africa Recloser Market Revenue Share, By Countries, 2017 & 2024 |
| 3.4. Africa Recloser Market Revenue Share, By Countries, 2017 & 2024 |
| 3.5. Africa Recloser Market - Industry Life Cycle, 2017 |
| 3.6. Africa Recloser Market - Porter's Five Forces, 2017 |
| 4. Africa Recloser Market Dynamics |
| 4.1. Market Dynamics & Impact Analysis |
| 4.2. Market Drivers |
| 4.3. Market Restraints |
| 5. Africa Recloser Market Trends |
| 6. South Africa Recloser Market Overview |
| 6.1. South Africa Country Indicators |
| 6.2. South Africa Recloser Market Overview |
| 6.2.1. South Africa Recloser Market Revenues, 2014-2024 |
| 6.2.2. South Africa Recloser Market Revenue Share, By Insulation, 2017 & 2024F |
| 6.2.3. South Africa Recloser Market Revenue Share, By Voltage Rating, 2017 & 2024F |
| 6.2.4. South Africa Recloser Market Revenue Share, By Applications, 2017 & 2024F |
| 6.2.5. South Africa Recloser Market Revenues, By Insulation, 2014-2024 |
| 6.2.6. South Africa Recloser Market Revenues, By Voltage, 2014-2024 |
| 6.2.7. South Africa Recloser Market Revenues, By Applications, 2014-2024 |
| 7. NIGERIA Recloser Market Overview |
| 7.1. NIGERIA Country Indicators |
| 7.2. NIGERIA Recloser Market Overview |
| 7.2.1. NIGERIA Recloser Market Revenues, 2014-2024 |
| 7.2.2. NIGERIA Recloser Market Revenue Share, By Insulation, 2017 & 2024F |
| 7.2.3. NIGERIA Recloser Market Revenue Share, By Voltage Rating, 2017 & 2024F |
| 7.2.4. NIGERIA Recloser Market Revenue Share, By Applications, 2017 & 2024F |
| 7.2.5. NIGERIA Recloser Market Revenues, By Insulation, 2014-2024 |
| 7.2.6. NIGERIA Recloser Market Revenues, By Voltage, 2014-2024 |
| 7.2.7. NIGERIA Recloser Market Revenues, By Applications, 2014-2024 |
| 8. Tanzania Recloser Market Overview |
| 8.1. Tanzania Country Indicators |
| 8.2. Tanzania Recloser Market Overview |
| 8.2.1. Tanzania Recloser Market Revenues, 2014-2024 |
| 8.2.2. Tanzania Recloser Market Revenue Share, By Insulation, 2017 & 2024F |
| 8.2.3. Tanzania Recloser Market Revenue Share, By Voltage Rating, 2017 & 2024F |
| 8.2.4. Tanzania Recloser Market Revenue Share, By Applications, 2017 & 2024F |
| 8.2.5. Tanzania Recloser Market Revenues, By Insulation, 2014-2024 |
| 8.2.6. Tanzania Recloser Market Revenues, By Voltage, 2014-2024 |
| 8.2.7. Tanzania Recloser Market Revenues, By Applications, 2014-2024 |
| 9. Kenya Recloser Market Overview |
| 9.1. Kenya Country Indicators |
| 9.2. Kenya Recloser Market Overview |
| 9.2.1. Kenya Recloser Market Revenues, 2014-2024 |
| 9.2.2. Kenya Recloser Market Revenue Share, By Insulation, 2017 & 2024F |
| 9.2.3. Kenya Recloser Market Revenue Share, By Voltage Rating, 2017 & 2024F |
| 9.2.4. Kenya Recloser Market Revenue Share, By Applications, 2017 & 2024F |
| 9.2.5. Kenya Recloser Market Revenues, By Insulation, 2014-2024 |
| 9.2.6. Kenya Recloser Market Revenues, By Voltage, 2014-2024 |
| 9.2.7. Kenya Recloser Market Revenues, By Applications, 2014-2024 |
| 10. Rest of Africa Recloser Market Overview |
| 10.1. Rest of Africa Recloser Market Overview |
| 10.2. Rest of Africa Recloser Market Revenues, 2014-2024 |
| 11. Africa Recloser Market Key Performance Indicator |
| 11.1. Africa Construction Sector Outlook |
| 11.2. Africa Power Sector Overview |
| 12. Africa Recloser Market Opportunity Assessment |
| 12.1. Africa Recloser Market Opportunity Assessment, By Countries, 2024 |
| 12.2. Africa Recloser Market Opportunity Assessment, By Countries, 2024 |
| 13. Competitive Landscape |
| 13.1. South Africa Recloser & Recloser Market Revenue Share, By Company, 2017 |
| 13.2. NIGERIA Recloser & Recloser Market Revenue Share, By Company, 2017 |
| 13.3. Tanzania Recloser & Recloser Market Revenue Share, By Company, 2017 |
| 13.4. Kenya Recloser Market Revenue Share, By Company, 2017 |
| 14. Company Profiles |
| 14.1. Business Description |
| 14.2. Geographical Presence |
| 14.3. Key Distributors/Dealers |
| 14.4. Key Executives |
| 14.5. Number of Employees |
| 14.6. Ownership (Top 5 shareholders) |
| 14.7. Key Financials (If available) |
| 14.8. Products Segment |
| 14.9. Recent Developments / Contracts/M&A |
| 15. Strategic Recommendations |
| 16. Disclaimer |
| List of Figures |
| 1. Africa Recloser Market Revenues, 2014-2024F ($ Million) |
| 2. Africa Recloser Market Revenues, 2014-2024F ($ Million) |
| 3. Africa Recloser Market Revenue Share, By Countries, 2017 & 2024F |
| 4. Africa Recloser Market Revenue Share, By Countries, 2017 & 2024F |
| 5. Africa LBS & Recloser Market - Industry Life Cycle 2017 |
| 6. Africa Power Installed Capacity, 2015-2050F (GW) |
| 7. Africa Power Installed Capacity By Source, 2015 & 2025 (GW) |
| 8. Africa Upcoming Power Trends |
| 9. Contribution of Construction Industry By Country Status, 2014-2030F |
| 10. Africa Construction Industry Value, 2016-2022F ($ Trillion) |
| 11. Africa Planned Infrastructure Investments, 2017-2021 ($ Billion) |
| 12. Average Brent Spot Crude Oil Price, 2012-2019F ($ per Barrel) |
| 13. Rest of Africa Recloser Market Revenues, 2014-2024F ($ Million) |
| 14. Rest of Africa Recloser Market Revenues, 2014-2024F ($ Million) |
| 15. Africa Cumulative Infrastructure Investment Need, 2016 - 2040F ($ Billion) |
| 16. NIGERIA Renewable Energy Cumulative Installed Capacity, 2012-2017 (GW) |
| 17. South Africa Renewable Energy Cumulative Installed Capacity, 2012-2017 (GW) |
| 18. Tanzania Renewable Energy Cumulative Installed Capacity, 2012-2017 (GW) |
| 19. Kenya Renewable Energy Cumulative Installed Capacity, 2012-2017 (GW) |
| 20. Africa Recloser Market Opportunity Assessment, By Applications, 2024F |
| 21. Africa Recloser Market Opportunity Assessment, By Country, 2024F |
| List of Tables |
| 1. Africa Project Summary of Infrastructure Sector, 2017-2021 ($ Billion) |
| 2. Africa Construction Volume Output, 2016-2020F (% Change) |
Export potential assessment - trade Analytics for 2030
Export potential enables firms to identify high-growth global markets with greater confidence by combining advanced trade intelligence with a structured quantitative methodology. The framework analyzes emerging demand trends and country-level import patterns while integrating macroeconomic and trade datasets such as GDP and population forecasts, bilateral import–export flows, tariff structures, elasticity differentials between developed and developing economies, geographic distance, and import demand projections. Using weighted trade values from 2020–2024 as the base period to project country-to-country export potential for 2030, these inputs are operationalized through calculated drivers such as gravity model parameters, tariff impact factors, and projected GDP per-capita growth. Through an analysis of hidden potentials, demand hotspots, and market conditions that are most favorable to success, this method enables firms to focus on target countries, maximize returns, and global expansion with data, backed by accuracy.
By factoring in the projected importer demand gap that is currently unmet and could be potential opportunity, it identifies the potential for the Exporter (Country) among 190 countries, against the general trade analysis, which identifies the biggest importer or exporter.
To discover high-growth global markets and optimize your business strategy:
Click Here
Pricing
- Single User License$ 4,560
- Department License$ 5,055
- Site License$ 5,595
- Global License$ 6,000

Search
Thought Leadership and Analyst Meet


Our Clients
Latest Reports
- United Kingdom (UK) Long-term Care Insurance Market (2026-2032) | Growth, Share, Consumer Insights, Drivers, Opportunities, Competition, Pricing Analysis, Segments, Restraints, Companies, Competitive, Value, Outlook, Size, Demand, Analysis, Challenges, Strategic Insights, Investment Trends, Revenue, Trends, Supply, Forecast
- United Kingdom (UK) Long Term Care Market (2026-2032) | Companies, Outlook, Analysis, Trends, Value, Revenue, Segmentation, Share, Forecast, Competitive Landscape, Growth, Size & Forecast
- Iraq Insulation and Waterproofing Market (2026-2032) | Outlook, Drivers, Growth, Size, Share, Industry, Revenue, Trends, Demand, Competitive, Strategic Insights, Opportunities, Segments, Companies, Challenges, Strategy, Consumer Insights, Analysis, Investment Trends, Value, Segmentation, Forecast, Restraints
- India Switchgear Market Outlook (2026 - 2032) | Size, Share, Trends, Growth, Revenue, Forecast, Analysis, Value, Outlook
- Pakistan Contraceptive Implants Market (2025-2031) | Demand, Growth, Size, Share, Industry, Pricing Analysis, Competitive, Strategic Insights, Strategy, Consumer Insights, Analysis, Investment Trends, Opportunities, Revenue, Segments, Value, Segmentation, Supply, Forecast, Restraints, Outlook, Competition, Drivers, Trends, Companies, Challenges
- Sri Lanka Packaging Market (2026-2032) | Outlook, Competition, Drivers, Trends, Demand, Pricing Analysis, Competitive, Strategic Insights, Companies, Challenges, Strategy, Consumer Insights, Analysis, Investment Trends, Opportunities, Growth, Size, Share, Industry, Revenue, Segments, Value, Segmentation, Supply, Forecast, Restraints
- India Kids Watches Market (2026-2032) | Strategy, Consumer Insights, Analysis, Investment Trends, Opportunities, Growth, Size, Share, Industry, Revenue, Segments, Value, Segmentation, Supply, Forecast, Restraints, Outlook, Competition, Drivers, Trends, Demand, Pricing Analysis, Competitive, Strategic Insights, Companies, Challenges
- Saudi Arabia Core Assurance Service Market (2025-2031) | Strategy, Consumer Insights, Analysis, Investment Trends, Opportunities, Growth, Size, Share, Industry, Revenue, Segments, Value, Segmentation, Supply, Forecast, Restraints, Outlook, Competition, Drivers, Trends, Demand, Pricing Analysis, Competitive, Strategic Insights, Companies, Challenges
- Romania Uninterruptible Power Supply (UPS) Market (2026-2032) | Industry, Analysis, Revenue, Size, Forecast, Outlook, Value, Trends, Share, Growth & Companies
- Saudi Arabia Car Window Tinting Film, Paint Protection Film (PPF), and Ceramic Coating Market (2025-2031) | Strategy, Consumer Insights, Analysis, Investment Trends, Opportunities, Growth, Size, Share, Industry, Revenue, Segments, Value, Segmentation, Supply, Forecast, Restraints, Outlook, Competition, Drivers, Trends, Demand, Pricing Analysis, Competitive, Strategic Insights, Companies, Challenges
Industry Events and Analyst Meet

India EV Show 2026

EV tech India Expo 2026

Auto Tech Asia 2026

Battery Tech India 2026

Smart Production Solutions Guangzhou 2026
Whitepaper
- Middle East & Africa Commercial Security Market Click here to view more.
- Middle East & Africa Fire Safety Systems & Equipment Market Click here to view more.
- GCC Drone Market Click here to view more.
- Middle East Lighting Fixture Market Click here to view more.
- GCC Physical & Perimeter Security Market Click here to view more.
6WResearch In News
- Doha a strategic location for EV manufacturing hub: IPA Qatar
- Demand for luxury TVs surging in the GCC, says Samsung
- Empowering Growth: The Thriving Journey of Bangladesh’s Cable Industry
- Demand for luxury TVs surging in the GCC, says Samsung
- Video call with a traditional healer? Once unthinkable, it’s now common in South Africa
- Intelligent Buildings To Smooth GCC’s Path To Net Zero