Tanzania industrial vehicles Market (2026-2032) | Revenue, Analysis, Share, Companies, Forecast, Trends, Size, Outlook, Industry, Growth & Value
Market Forecast By Product Type (Forklift, Aisle Truck, Tow Tractor, Container Handler), By Drive Type (Internal Combustion Engine, Battery-Operated, Gas-Powered), By Application (Industrial , Cargo) And Competitive Landscape
| Product Code: ETC029775 | Publication Date: Oct 2020 | Updated Date: Jun 2026 | Product Type: Report | |
| Publisher: 6Wresearch | Author: Sachin Kumar Rai | No. of Pages: 70 | No. of Figures: 35 | No. of Tables: 5 |
Tanzania industrial vehicles Market Summary
The tanzania industrial vehicles market was estimated at USD 148 Million in 2025 and is projected to reach USD 161 Million by 2032, growing at a CAGR of 0.8% from 2026 to 2032.
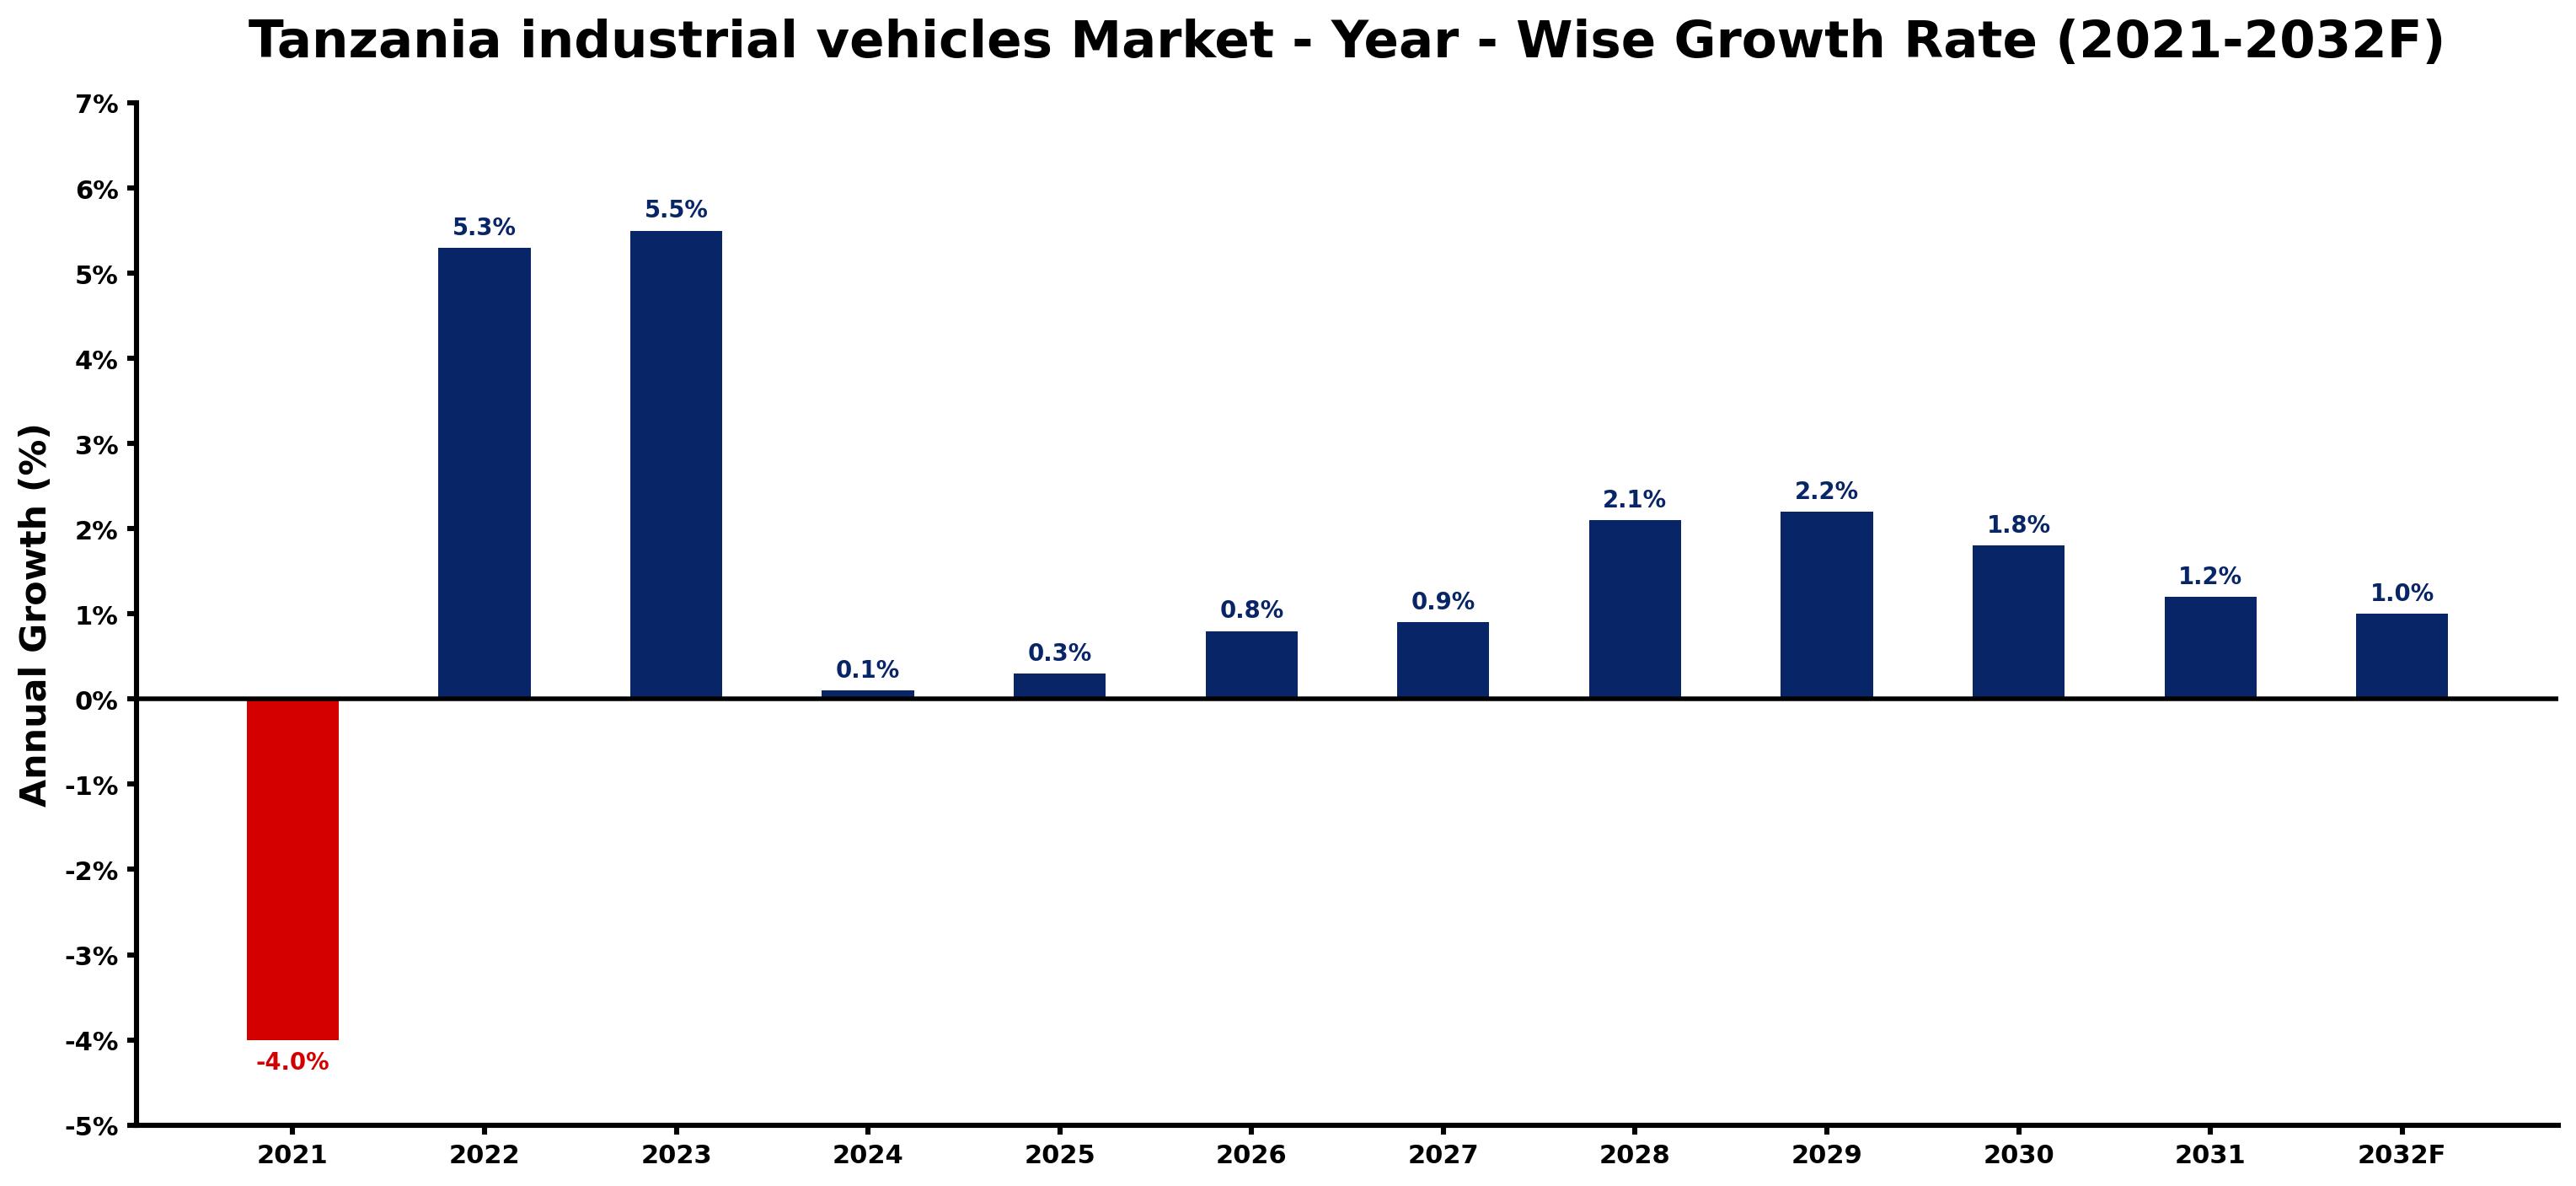
Tanzania industrial vehicles Market Growth Rate Analysis (2021-2032)
The industrial vehicles market in Tanzania has shown an upward trend following a challenging period in 2021, where it experienced a decline of 4.0%. A recovery began in 2022 with a growth of 5.3%, fueled by increased investments in infrastructure and industrial projects. This upward momentum continued into 2023 at 5.5%, reflecting heightened consumer demand and advancements in technology. While growth is projected to moderate, stabilizing at around 0.3% in 2025, the market is expected to gradually increase by 2.1% in 2028 and 1.2% by 2031, driven by ongoing energy transitions and improvements in supply chain efficiencies. The evolving policy landscape further supports this positive development.
Tanzania industrial vehicles Market Year-wise Growth Rate and Key Drivers
This graph highlights how the Tanzania industrial vehicles Market has steadily grown over the past five years, supported by major growth factors.
The table below presents the year wise growth rates along with the key drivers influencing the market
| Year | Growth Rate | Major Drivers |
| 2021 | -4.0% | Supply chain disruptions due to global shipping delays hampered timely deliveries, leading to decreased sales in 2021. |
| 2022 | 5.3% | Investment in infrastructure development boosts the need for heavy-duty vehicles significantly. |
| 2023 | 5.5% | Local manufacturing capabilities reduce reliance on imported industrial vehicles and parts. |
| 2024 | 0.1% | Emerging mining projects in the region create increased demand for specialized vehicles. |
| 2025 | 0.3% | Supply chain enhancements drive logistics sector growth, necessitating more industrial vehicles. |
| 2026 | 0.8% | Urbanization trends lead to higher demand for construction equipment across cities. |
| 2027 | 0.9% | Sustainability trends influence vehicle designs focusing on fuel efficiency and emissions. |
| 2028 | 2.1% | Partnerships with international firms enhance vehicle technology available in the local market. |
| 2029 | 2.2% | Increased financing options make industrial vehicles more accessible for small businesses. |
| 2030 | 1.8% | Advancements in telematics improve fleet management, encouraging adoption of modern vehicles. |
| 2031 | 1.2% | Growth in agriculture requires durable vehicles for efficient transportation of goods. |
| 2032 | 1.0% | Competitive pricing strategies among manufacturers stimulate market entry and consumer choice. |
Note - Market size estimations and growth projections presented in this report are based on 6Wresearch's advanced forecasting approach, validated with industry datasets as of June 2026.
Tanzania industrial vehicles Market Synopsis
The Tanzania industrial vehicles Market is projected to reach 0.8% and witness significant growth during the forecast period (2026-2032). This growth trajectory is bolstered by the expanding sectors such as construction, mining, agriculture, and logistics, which have seen an increased demand for a variety of industrial vehicles including trucks, forklifts, excavators, and tractors. The ongoing infrastructure development projects across the country are further contributing to this positive outlook, highlighting the pivotal role of industrial vehicles in supporting economic expansion.
Tanzania industrial vehicles Market Growth Drivers
The drivers contributing to the growth of the Tanzania industrial vehicles market are multifaceted:
- The robust infrastructure development initiatives by the government are stimulating the need for heavy-duty vehicles capable of handling increased operational demands.
- As the agricultural sector expands, there is a heightened requirement for tractors and specialized equipment to enhance productivity and efficiency.
- Growing urbanization and urban construction activities necessitate the use of industrial vehicles for transporting materials and equipment effectively.
- Initiatives to improve transportation networks are encouraging manufacturers to invest in modern vehicles, thus increasing demand.
- Investment in logistics and supply chain management necessitates the use of reliable vehicles for timely delivery and operational efficiency.
Tanzania industrial vehicles Market Trends and Opportunities
The Tanzania industrial vehicles market is not only growing but evolving with emerging trends that signify opportunities for stakeholders:
- There is a noticeable shift towards acquiring technologically advanced industrial vehicles, particularly those that are electric or hybrid, as organizations aim to minimize their carbon footprint.
- The integration of automation and telematics in industrial vehicles is enhancing operational efficiency, generating greater interest among companies aiming for productivity gains.
- A surge in leasing and rental services for industrial vehicles is offering firms a cost-effective alternative to outright purchase, allowing flexibility in financing.
- As businesses prioritize sustainability, there is potential for innovations focused on improving the environmental impact of industrial vehicles.
- The rising demand for maintenance and aftermarket services presents a lucrative opportunity for investors, as vehicle longevity and efficiency remain critical concerns for owners.
Tanzania industrial vehicles Market Challenges and Restraints
Despite its promising growth, the Tanzania industrial vehicles market faces several challenges that must be addressed:
- High import duties and taxes on vehicles create a significant financial burden, making it difficult for local distributors to compete effectively.
- Limited financing options for businesses intending to purchase vehicles can restrict market access and growth potential.
- Poor road conditions and inadequate infrastructure hinder the efficient movement of industrial vehicles, affecting overall productivity.
- A shortage of skilled mechanics and technicians results in maintenance challenges, impacting the operational reliability of industrial vehicles.
- Competition from cheaper second-hand vehicles from international markets poses a threat to local manufacturers and distributors, affecting pricing strategies.
Tanzania industrial vehicles Market Government Investment and Initiatives
The Tanzanian government has recognized the importance of the industrial vehicles market and has implemented various policies to foster its growth:
- Policies such as import tariffs and taxes aim to protect domestic manufacturers while encouraging local assembly and production of vehicles.
- Incentives including tax breaks and subsidies promote investment in local manufacturing, stimulating job creation and economic activity.
- The government is actively working on infrastructure improvement projects, which are critical for facilitating the movement of industrial vehicles across the nation.
- Regulatory frameworks concerning vehicle emissions and safety standards ensure that industrial vehicles meet quality and environmental benchmarks.
- By focusing on enhancing logistics and transportation networks, the government aims to improve operational efficiencies in industrial vehicle usage.
Tanzania industrial vehicles Market Latest Developments (May 2025 - June 2026)
In the period from May 2025 to June 2026, the Tanzania industrial vehicles market has seen notable developments:
- There has been a marked increase in investments in electric vehicles within the industrial sector, reflecting a shift towards cleaner technology.
- Companies are increasingly adopting telematics solutions to monitor vehicle performance and optimize maintenance schedules, enhancing overall efficiency.
- Partnerships between local businesses and international firms have become more prevalent, leading to knowledge transfer and skill development in vehicle maintenance.
- Greater emphasis has been placed on capacity-building programs aimed at training technicians, thus addressing the skill shortage in the market.
- The increasing interest in vehicle leasing options has led to the emergence of new service providers, expanding access to industrial vehicles for smaller firms.
Tanzania industrial vehicles Market - Key Attractiveness of the Report
- 10 Years of Market Numbers
- Historical Data Starting from 2022 to 2025
- Base Year: 2025
- Forecast Data until 2032
- Key Performance Indicators Impacting the Market
- Major Upcoming Developments and Projects
Key Highlights of the Report:
- Tanzania industrial vehicles Market Outlook
- Market Size of Tanzania industrial vehicles Market, 2025
- Forecast of Tanzania industrial vehicles Market, 2032F
- Historical Data and Forecast of Tanzania industrial vehicles Revenues & Volume for the Period 2022-2032F
- Tanzania industrial vehicles Market Trend Evolution
- Tanzania industrial vehicles Market Drivers and Challenges
- Tanzania industrial vehicles Price Trends
- Tanzania industrial vehicles Porter's Five Forces
- Tanzania industrial vehicles Industry Life Cycle
- Historical Data and Forecast of Tanzania industrial vehicles Market Revenues & Volume By Product Type for the Period 2022-2032F
- Historical Data and Forecast of Tanzania industrial vehicles Market Revenues & Volume By Forklift for the Period 2022-2032F
- Historical Data and Forecast of Tanzania industrial vehicles Market Revenues & Volume By Aisle Truck for the Period 2022-2032F
- Historical Data and Forecast of Tanzania industrial vehicles Market Revenues & Volume By Tow Tractor for the Period 2022-2032F
- Historical Data and Forecast of Tanzania industrial vehicles Market Revenues & Volume By Container Handler for the Period 2022-2032F
- Historical Data and Forecast of Tanzania industrial vehicles Market Revenues & Volume By Drive Type for the Period 2022-2032F
- Historical Data and Forecast of Tanzania industrial vehicles Market Revenues & Volume By Internal Combustion Engine for the Period 2022-2032F
- Historical Data and Forecast of Tanzania industrial vehicles Market Revenues & Volume By Battery-Operated for the Period 2022-2032F
- Historical Data and Forecast of Tanzania industrial vehicles Market Revenues & Volume By Gas-Powered for the Period 2022-2032F
- Historical Data and Forecast of Tanzania industrial vehicles Market Revenues & Volume By Application for the Period 2022-2032F
- Historical Data and Forecast of Tanzania industrial vehicles Market Revenues & Volume By Industrial for the Period 2022-2032F
- Historical Data and Forecast of Tanzania industrial vehicles Market Revenues & Volume By Cargo for the Period 2022-2032F
- Tanzania industrial vehicles Import Export Trade Statistics
- Market Opportunity Assessment By Product Type
- Market Opportunity Assessment By Drive Type
- Market Opportunity Assessment By Application
- Tanzania industrial vehicles Top Companies Market Share
- Tanzania industrial vehicles Competitive Benchmarking By Technical and Operational Parameters
- Tanzania industrial vehicles Company Profiles
- Tanzania industrial vehicles Key Strategic Recommendations
Frequently Asked Questions About the Market Study (FAQs):
The growth is primarily driven by infrastructure development, increased industrialization, and the rising demand for agricultural and construction vehicles.
Key challenges include high import duties, limited financing options, and inadequate maintenance services.
Yes, investment opportunities exist in distribution, maintenance services, and the supply of eco-friendly vehicles.
The government supports the market through tariffs, tax incentives, and initiatives aimed at improving infrastructure and local production.
6Wresearch actively monitors the Tanzania industrial vehicles Market and publishes its comprehensive annual report, highlighting emerging trends, growth drivers, revenue analysis, and forecast outlook. Our insights help businesses to make data-backed strategic decisions with ongoing market dynamics. Our analysts track relevent industries related to the Tanzania industrial vehicles Market, allowing our clients with actionable intelligence and reliable forecasts tailored to emerging regional needs.
Yes, we provide customisation as per your requirements. To learn more, feel free to contact us on sales@6wresearch.com
1 Executive Summary |
2 Introduction |
2.1 Key Highlights of the Report |
2.2 Report Description |
2.3 Market Scope & Segmentation |
2.4 Research Methodology |
2.5 Assumptions |
3 Tanzania industrial vehicles Market Overview |
3.1 Tanzania Country Macro Economic Indicators |
3.2 Tanzania industrial vehicles Market Revenues & Volume, 2022 & 2032F |
3.3 Tanzania industrial vehicles Market - Industry Life Cycle |
3.4 Tanzania industrial vehicles Market - Porter's Five Forces |
3.5 Tanzania industrial vehicles Market Revenues & Volume Share, By Product Type, 2022 & 2032F |
3.6 Tanzania industrial vehicles Market Revenues & Volume Share, By Drive Type, 2022 & 2032F |
3.7 Tanzania industrial vehicles Market Revenues & Volume Share, By Application, 2022 & 2032F |
4 Tanzania industrial vehicles Market Dynamics |
4.1 Impact Analysis |
4.2 Market Drivers |
4.2.1 Growth in industrialization and infrastructure development in Tanzania |
4.2.2 Increasing demand for efficient transportation and logistics solutions |
4.2.3 Government initiatives to support industrial development and investment in the transportation sector |
4.3 Market Restraints |
4.3.1 High import duties and taxes on industrial vehicles |
4.3.2 Limited availability of skilled labor for operating and maintaining industrial vehicles |
4.3.3 Infrastructure challenges such as poor road conditions affecting the performance of industrial vehicles |
5 Tanzania industrial vehicles Market Trends |
6 Tanzania industrial vehicles Market, By Types |
6.1 Tanzania industrial vehicles Market, By Product Type |
6.1.1 Overview and Analysis |
6.1.2 Tanzania industrial vehicles Market Revenues & Volume, By Product Type, 2022-2032F |
6.1.3 Tanzania industrial vehicles Market Revenues & Volume, By Forklift, 2022-2032F |
6.1.4 Tanzania industrial vehicles Market Revenues & Volume, By Aisle Truck, 2022-2032F |
6.1.5 Tanzania industrial vehicles Market Revenues & Volume, By Tow Tractor, 2022-2032F |
6.1.6 Tanzania industrial vehicles Market Revenues & Volume, By Container Handler, 2022-2032F |
6.2 Tanzania industrial vehicles Market, By Drive Type |
6.2.1 Overview and Analysis |
6.2.2 Tanzania industrial vehicles Market Revenues & Volume, By Internal Combustion Engine, 2022-2032F |
6.2.3 Tanzania industrial vehicles Market Revenues & Volume, By Battery-Operated, 2022-2032F |
6.2.4 Tanzania industrial vehicles Market Revenues & Volume, By Gas-Powered, 2022-2032F |
6.3 Tanzania industrial vehicles Market, By Application |
6.3.1 Overview and Analysis |
6.3.2 Tanzania industrial vehicles Market Revenues & Volume, By Industrial , 2022-2032F |
6.3.3 Tanzania industrial vehicles Market Revenues & Volume, By Cargo, 2022-2032F |
7 Tanzania industrial vehicles Market Import-Export Trade Statistics |
7.1 Tanzania industrial vehicles Market Export to Major Countries |
7.2 Tanzania industrial vehicles Market Imports from Major Countries |
8 Tanzania industrial vehicles Market Key Performance Indicators |
8.1 Average age of industrial vehicles in operation |
8.2 Adoption rate of fuel-efficient and environmentally friendly industrial vehicles |
8.3 Rate of technology integration in industrial vehicles |
9 Tanzania industrial vehicles Market - Opportunity Assessment |
9.1 Tanzania industrial vehicles Market Opportunity Assessment, By Product Type, 2022 & 2032F |
9.2 Tanzania industrial vehicles Market Opportunity Assessment, By Drive Type, 2022 & 2032F |
9.3 Tanzania industrial vehicles Market Opportunity Assessment, By Application, 2022 & 2032F |
10 Tanzania industrial vehicles Market - Competitive Landscape |
10.1 Tanzania industrial vehicles Market Revenue Share, By Companies, 2025 |
10.2 Tanzania industrial vehicles Market Competitive Benchmarking, By Operating and Technical Parameters |
11 Company Profiles |
12 Recommendations |
13 Disclaimer |
Global Go To Market Strategy - 2030
Export potential enables firms to identify high-growth global markets with greater confidence by combining advanced trade intelligence with a structured quantitative methodology. The framework analyzes emerging demand trends and country-level import patterns while integrating macroeconomic and trade datasets such as GDP and population forecasts, bilateral import–export flows, tariff structures, elasticity differentials between developed and developing economies, geographic distance, and import demand projections. Using weighted trade values from 2020–2024 as the base period to project country-to-country export potential for 2030, these inputs are operationalized through calculated drivers such as gravity model parameters, tariff impact factors, and projected GDP per-capita growth. Through an analysis of hidden potentials, demand hotspots, and market conditions that are most favorable to success, this method enables firms to focus on target countries, maximize returns, and global expansion with data, backed by accuracy.
By factoring in the projected importer demand gap that is currently unmet and could be potential opportunity, it identifies the potential for the Exporter (Country) among 190 countries, against the general trade analysis, which identifies the biggest importer or exporter.
To discover high-growth global markets and optimize your business strategy:
Click Here
Pricing
- Single User License$ 1,995
- Department License$ 2,400
- Site License$ 3,120
- Global License$ 3,795

Leadership Perspectives from Industry Events
Search
Thought Leadership and Analyst Meet


Our Clients
6WResearch In News
- India Air Conditioner Market Set for Strong Rebound in 2026 After Weather-Led Correction and GST-Driven Recovery: 6Wresearch
- ADAS in India: How Automatic Emergency Braking, Blind Spot Detection & Driver Monitoring are Transforming Road Safety
- Doha a strategic location for EV manufacturing hub: IPA Qatar
- Demand for luxury TVs surging in the GCC, says Samsung
- Empowering Growth: The Thriving Journey of Bangladesh’s Cable Industry
- Demand for luxury TVs surging in the GCC, says Samsung
Latest Reports
- Nicaragua RPG Gaming Market (2026-2032)
- New Zealand RPG Gaming Market (2026-2032)
- Netherlands RPG Gaming Market (2026-2032)
- Nauru RPG Gaming Market (2026-2032)
- Namibia RPG Gaming Market (2026-2032)
- Mozambique RPG Gaming Market (2026-2032)
- Montenegro RPG Gaming Market (2026-2032)
- Mongolia RPG Gaming Market (2026-2032)
- Monaco RPG Gaming Market (2026-2032)
- Micronesia RPG Gaming Market (2026-2032)
Industry Events and Analyst Meet

HIMTEX 2026

India Refining Summit 2026

India EV Show 2026

EV tech India Expo 2026

Auto Tech Asia 2026
Whitepaper
- Middle East & Africa Commercial Security Market Click here to view more.
- Middle East & Africa Fire Safety Systems & Equipment Market Click here to view more.
- GCC Drone Market Click here to view more.
- Middle East Lighting Fixture Market Click here to view more.
- GCC Physical & Perimeter Security Market Click here to view more.