Argentina Acrylic Monomers Market (2026-2032) | Trends, Value, Companies, Share, Outlook, Forecast, Industry, Analysis, Competitive Landscape, Size & Revenue, Growth, Segmentation
Market Forecast By Product (Acrylate, Acrylic Acids and Salts, Bisphenol Acrylics, Polyfunctional Acrylics, Fluorinated Acrylics, Acrylonitrile, Acrylamide and Methacrylamide, Malemide), By Application (Plastic, Adhesives and Sealants, Synthetic Resins, Acrylic Fibers, Building Materials, Fabrics, Acrylic Rubber), By End-user Industry (Paints annd coatings, Building and Construction, Automotive, Consumer Goods, Packaging, Marine, Aerospace) And Competitive Landscape
| Product Code: ETC6129986 | Publication Date: Sep 2024 | Updated Date: Feb 2026 | Product Type: Market Research Report | |
| Publisher: 6Wresearch | Author: Sumit Sagar | No. of Pages: 75 | No. of Figures: 35 | No. of Tables: 20 |
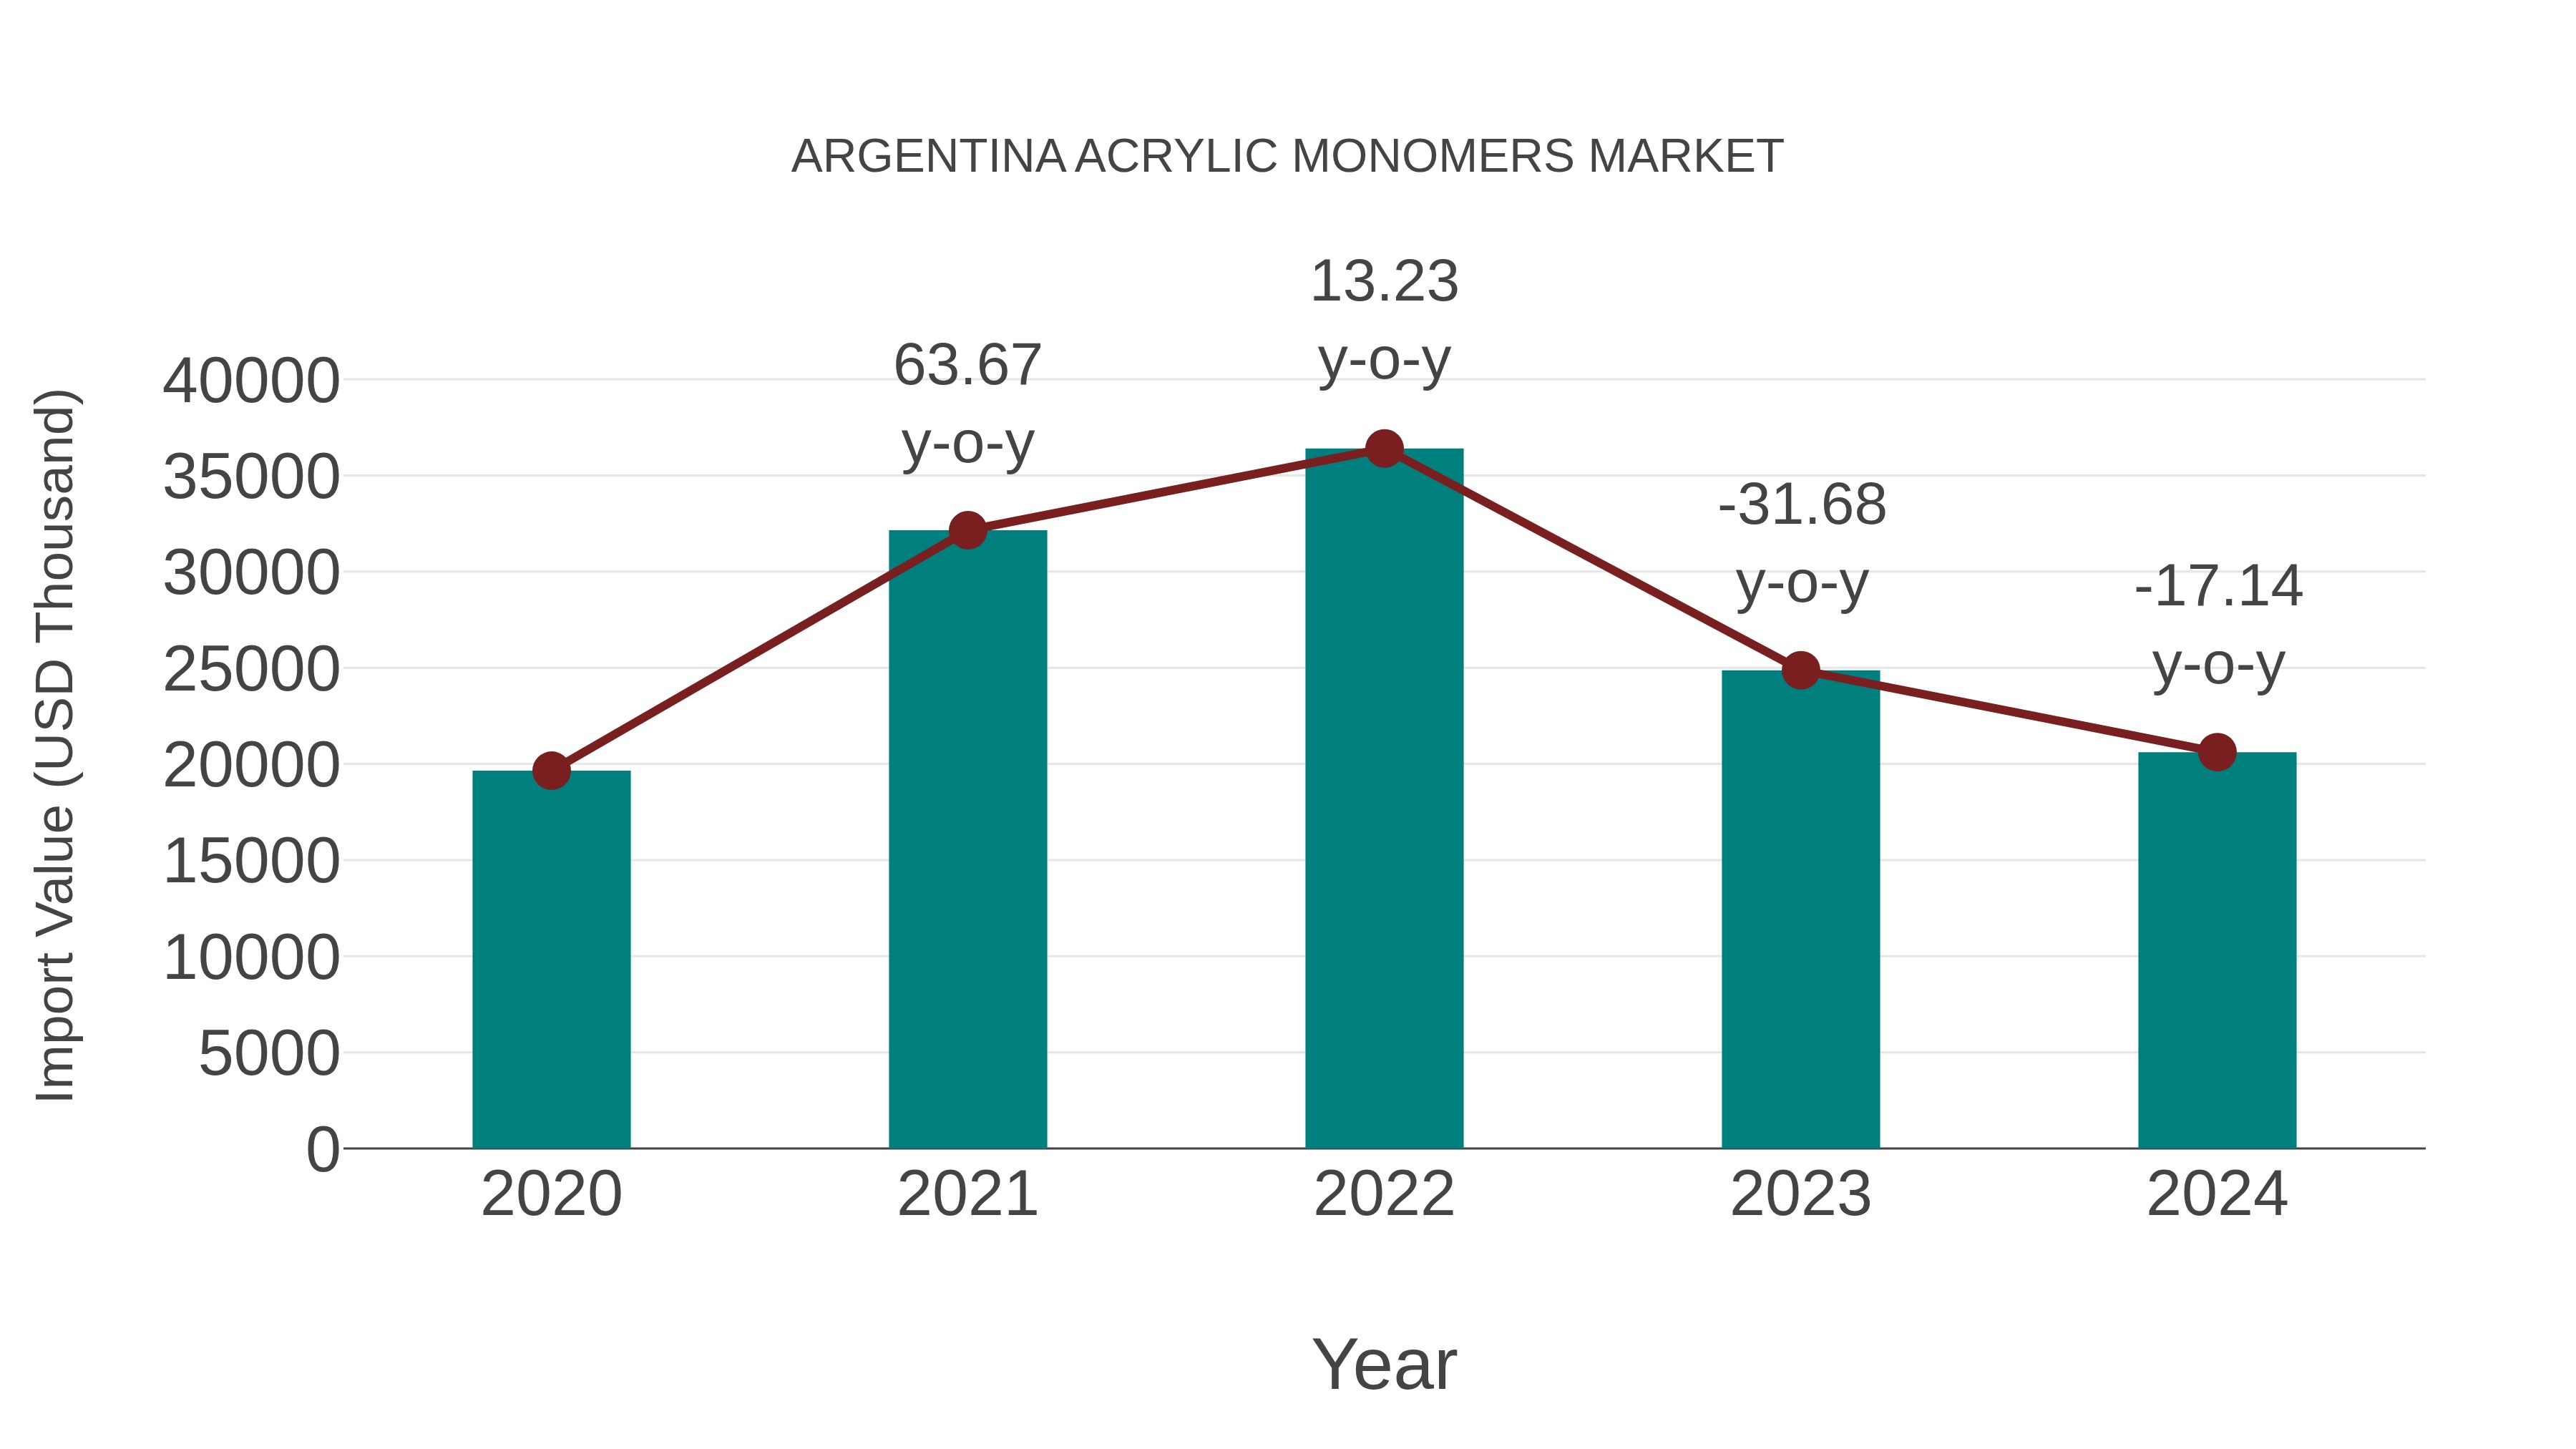
Argentina Acrylic Monomers Market: Import Trend Analysis
Argentina`s import trend for acrylic monomers experienced a notable decline from 2023 to 2024, with a growth rate of -17.96%. The compound annual growth rate (CAGR) for the period 2020-2024 stood at -1.53%. This downward trajectory could be attributed to shifts in demand dynamics or changes in trade policies affecting the market stability.
Key Highlights of the Report:
- Argentina Acrylic Monomers Market Outlook
- Market Size of Argentina Acrylic Monomers Market, 2025
- Forecast of Argentina Acrylic Monomers Market, 2032
- Historical Data and Forecast of Argentina Acrylic Monomers Revenues & Volume for the Period 2022-2032F
- Argentina Acrylic Monomers Market Trend Evolution
- Argentina Acrylic Monomers Market Drivers and Challenges
- Argentina Acrylic Monomers Price Trends
- Argentina Acrylic Monomers Porter's Five Forces
- Argentina Acrylic Monomers Industry Life Cycle
- Historical Data and Forecast of Argentina Acrylic Monomers Market Revenues & Volume By Product for the Period 2022-2032F
- Historical Data and Forecast of Argentina Acrylic Monomers Market Revenues & Volume By Acrylate for the Period 2022-2032F
- Historical Data and Forecast of Argentina Acrylic Monomers Market Revenues & Volume By Acrylic Acids and Salts for the Period 2022-2032F
- Historical Data and Forecast of Argentina Acrylic Monomers Market Revenues & Volume By Bisphenol Acrylics for the Period 2022-2032F
- Historical Data and Forecast of Argentina Acrylic Monomers Market Revenues & Volume By Polyfunctional Acrylics for the Period 2022-2032F
- Historical Data and Forecast of Argentina Acrylic Monomers Market Revenues & Volume By Fluorinated Acrylics for the Period 2022-2032F
- Historical Data and Forecast of Argentina Acrylic Monomers Market Revenues & Volume By Acrylonitrile for the Period 2022-2032F
- Historical Data and Forecast of Argentina Acrylic Monomers Market Revenues & Volume By Acrylamide and Methacrylamide for the Period 2022-2032F
- Historical Data and Forecast of Argentina Acrylate Acrylic Monomers Market Revenues & Volume By Malemide for the Period 2022-2032F
- Historical Data and Forecast of Argentina Acrylic Monomers Market Revenues & Volume By Application for the Period 2022-2032F
- Historical Data and Forecast of Argentina Acrylic Monomers Market Revenues & Volume By Plastic for the Period 2022-2032F
- Historical Data and Forecast of Argentina Acrylic Monomers Market Revenues & Volume By Adhesives and Sealants for the Period 2022-2032F
- Historical Data and Forecast of Argentina Acrylic Monomers Market Revenues & Volume By Synthetic Resins for the Period 2022-2032F
- Historical Data and Forecast of Argentina Acrylic Monomers Market Revenues & Volume By Acrylic Fibers for the Period 2022-2032F
- Historical Data and Forecast of Argentina Acrylic Monomers Market Revenues & Volume By Building Materials for the Period 2022-2032F
- Historical Data and Forecast of Argentina Acrylic Monomers Market Revenues & Volume By Fabrics for the Period 2022-2032F
- Historical Data and Forecast of Argentina Acrylic Monomers Market Revenues & Volume By Acrylic Rubber for the Period 2022-2032F
- Historical Data and Forecast of Argentina Acrylic Monomers Market Revenues & Volume By End-user Industry for the Period 2022-2032F
- Historical Data and Forecast of Argentina Acrylic Monomers Market Revenues & Volume By Paints annd coatings for the Period 2022-2032F
- Historical Data and Forecast of Argentina Acrylic Monomers Market Revenues & Volume By Building and Construction for the Period 2022-2032F
- Historical Data and Forecast of Argentina Acrylic Monomers Market Revenues & Volume By Automotive for the Period 2022-2032F
- Historical Data and Forecast of Argentina Acrylic Monomers Market Revenues & Volume By Consumer Goods for the Period 2022-2032F
- Historical Data and Forecast of Argentina Acrylic Monomers Market Revenues & Volume By Packaging for the Period 2022-2032F
- Historical Data and Forecast of Argentina Acrylic Monomers Market Revenues & Volume By Marine for the Period 2022-2032F
- Historical Data and Forecast of Argentina Acrylic Monomers Market Revenues & Volume By Aerospace for the Period 2022-2032F
- Argentina Acrylic Monomers Import Export Trade Statistics
- Market Opportunity Assessment By Product
- Market Opportunity Assessment By Application
- Market Opportunity Assessment By End-user Industry
- Argentina Acrylic Monomers Top Companies Market Share
- Argentina Acrylic Monomers Competitive Benchmarking By Technical and Operational Parameters
- Argentina Acrylic Monomers Company Profiles
- Argentina Acrylic Monomers Key Strategic Recommendations
Frequently Asked Questions About the Market Study (FAQs):
6Wresearch actively monitors the Argentina Acrylic Monomers Market and publishes its comprehensive annual report, highlighting emerging trends, growth drivers, revenue analysis, and forecast outlook. Our insights help businesses to make data-backed strategic decisions with ongoing market dynamics. Our analysts track relevent industries related to the Argentina Acrylic Monomers Market, allowing our clients with actionable intelligence and reliable forecasts tailored to emerging regional needs.
Yes, we provide customisation as per your requirements. To learn more, feel free to contact us on sales@6wresearch.com
1 Executive Summary |
2 Introduction |
2.1 Key Highlights of the Report |
2.2 Report Description |
2.3 Market Scope & Segmentation |
2.4 Research Methodology |
2.5 Assumptions |
3 Argentina Acrylic Monomers Market Overview |
3.1 Argentina Country Macro Economic Indicators |
3.2 Argentina Acrylic Monomers Market Revenues & Volume, 2022 & 2032F |
3.3 Argentina Acrylic Monomers Market - Industry Life Cycle |
3.4 Argentina Acrylic Monomers Market - Porter's Five Forces |
3.5 Argentina Acrylic Monomers Market Revenues & Volume Share, By Product, 2022 & 2032F |
3.6 Argentina Acrylic Monomers Market Revenues & Volume Share, By Application, 2022 & 2032F |
3.7 Argentina Acrylic Monomers Market Revenues & Volume Share, By End-user Industry, 2022 & 2032F |
4 Argentina Acrylic Monomers Market Dynamics |
4.1 Impact Analysis |
4.2 Market Drivers |
4.2.1 Growing demand for acrylic monomers in the paints and coatings industry due to their superior properties such as high durability and weather resistance. |
4.2.2 Increasing adoption of acrylic monomers in the adhesives and sealants sector for applications requiring high strength and bonding capabilities. |
4.2.3 Rising investments in infrastructure projects driving the demand for acrylic monomers in construction materials. |
4.3 Market Restraints |
4.3.1 Fluctuating raw material prices impacting the production cost of acrylic monomers. |
4.3.2 Stringent environmental regulations regarding the use and disposal of acrylic monomers leading to compliance challenges. |
4.3.3 Competition from alternative materials such as epoxy resins and polyurethanes affecting the market growth. |
5 Argentina Acrylic Monomers Market Trends |
6 Argentina Acrylic Monomers Market, By Types |
6.1 Argentina Acrylic Monomers Market, By Product |
6.1.1 Overview and Analysis |
6.1.2 Argentina Acrylic Monomers Market Revenues & Volume, By Product, 2022-2032F |
6.1.3 Argentina Acrylic Monomers Market Revenues & Volume, By Acrylate, 2022-2032F |
6.1.4 Argentina Acrylic Monomers Market Revenues & Volume, By Acrylic Acids and Salts, 2022-2032F |
6.1.5 Argentina Acrylic Monomers Market Revenues & Volume, By Bisphenol Acrylics, 2022-2032F |
6.1.6 Argentina Acrylic Monomers Market Revenues & Volume, By Polyfunctional Acrylics, 2022-2032F |
6.1.7 Argentina Acrylic Monomers Market Revenues & Volume, By Fluorinated Acrylics, 2022-2032F |
6.1.8 Argentina Acrylic Monomers Market Revenues & Volume, By Acrylonitrile, 2022-2032F |
6.1.9 Argentina Acrylic Monomers Market Revenues & Volume, By Malemide, 2022-2032F |
6.1.10 Argentina Acrylic Monomers Market Revenues & Volume, By Malemide, 2022-2032F |
6.2 Argentina Acrylic Monomers Market, By Application |
6.2.1 Overview and Analysis |
6.2.2 Argentina Acrylic Monomers Market Revenues & Volume, By Plastic, 2022-2032F |
6.2.3 Argentina Acrylic Monomers Market Revenues & Volume, By Adhesives and Sealants, 2022-2032F |
6.2.4 Argentina Acrylic Monomers Market Revenues & Volume, By Synthetic Resins, 2022-2032F |
6.2.5 Argentina Acrylic Monomers Market Revenues & Volume, By Acrylic Fibers, 2022-2032F |
6.2.6 Argentina Acrylic Monomers Market Revenues & Volume, By Building Materials, 2022-2032F |
6.2.7 Argentina Acrylic Monomers Market Revenues & Volume, By Fabrics, 2022-2032F |
6.3 Argentina Acrylic Monomers Market, By End-user Industry |
6.3.1 Overview and Analysis |
6.3.2 Argentina Acrylic Monomers Market Revenues & Volume, By Paints annd coatings, 2022-2032F |
6.3.3 Argentina Acrylic Monomers Market Revenues & Volume, By Building and Construction, 2022-2032F |
6.3.4 Argentina Acrylic Monomers Market Revenues & Volume, By Automotive, 2022-2032F |
6.3.5 Argentina Acrylic Monomers Market Revenues & Volume, By Consumer Goods, 2022-2032F |
6.3.6 Argentina Acrylic Monomers Market Revenues & Volume, By Packaging, 2022-2032F |
6.3.7 Argentina Acrylic Monomers Market Revenues & Volume, By Marine, 2022-2032F |
7 Argentina Acrylic Monomers Market Import-Export Trade Statistics |
7.1 Argentina Acrylic Monomers Market Export to Major Countries |
7.2 Argentina Acrylic Monomers Market Imports from Major Countries |
8 Argentina Acrylic Monomers Market Key Performance Indicators |
8.1 Average selling price of acrylic monomers in the Argentina market. |
8.2 Number of new product innovations and developments in the acrylic monomers sector. |
8.3 Capacity utilization rate of acrylic monomer production facilities in Argentina. |
8.4 Adoption rate of acrylic monomers in key end-use industries such as paints, coatings, adhesives, and sealants. |
8.5 Export volume of acrylic monomers from Argentina to other countries. |
9 Argentina Acrylic Monomers Market - Opportunity Assessment |
9.1 Argentina Acrylic Monomers Market Opportunity Assessment, By Product, 2022 & 2032F |
9.2 Argentina Acrylic Monomers Market Opportunity Assessment, By Application, 2022 & 2032F |
9.3 Argentina Acrylic Monomers Market Opportunity Assessment, By End-user Industry, 2022 & 2032F |
10 Argentina Acrylic Monomers Market - Competitive Landscape |
10.1 Argentina Acrylic Monomers Market Revenue Share, By Companies, 2025 |
10.2 Argentina Acrylic Monomers Market Competitive Benchmarking, By Operating and Technical Parameters |
11 Company Profiles |
12 Recommendations |
13 Disclaimer |
Export potential assessment - trade Analytics for 2030
Export potential enables firms to identify high-growth global markets with greater confidence by combining advanced trade intelligence with a structured quantitative methodology. The framework analyzes emerging demand trends and country-level import patterns while integrating macroeconomic and trade datasets such as GDP and population forecasts, bilateral import–export flows, tariff structures, elasticity differentials between developed and developing economies, geographic distance, and import demand projections. Using weighted trade values from 2020–2024 as the base period to project country-to-country export potential for 2030, these inputs are operationalized through calculated drivers such as gravity model parameters, tariff impact factors, and projected GDP per-capita growth. Through an analysis of hidden potentials, demand hotspots, and market conditions that are most favorable to success, this method enables firms to focus on target countries, maximize returns, and global expansion with data, backed by accuracy.
By factoring in the projected importer demand gap that is currently unmet and could be potential opportunity, it identifies the potential for the Exporter (Country) among 190 countries, against the general trade analysis, which identifies the biggest importer or exporter.
To discover high-growth global markets and optimize your business strategy:
Click Here
Pricing
- Single User License$ 1,995
- Department License$ 2,400
- Site License$ 3,120
- Global License$ 3,795

Search
Thought Leadership and Analyst Meet


Our Clients
Latest Reports
- China Electric Appliance Rental Market (2026-2032) | Trends, Revenue, Growth, Challenges, Size, Value, Outlook, Pricing, Strategy, Insights, Restraints, segmentation, Companies, Investment Opportunities, Analysis, Demand, Drivers, Competition, Forecast, Share
- Chile Electric Appliance Rental Market (2026-2032) | Outlook, Competition, Drivers, Strategy, Revenue, Analysis, Value, Pricing, Restraints, Size, Demand, Share, Growth, Forecast, Challenges, Insights, Investment Opportunities, Companies, Trends, segmentation
- Cambodia Electric Appliance Rental Market (2026-2032) | Companies, Analysis, Restraints, Pricing, Insights, Challenges, Outlook, Strategy, Forecast, Trends, Competition, Value, Revenue, Investment Opportunities, segmentation, Drivers, Size, Demand, Growth, Share
- Brazil Electric Appliance Rental Market (2026-2032) | Revenue, Strategy, Forecast, Companies, segmentation, Competition, Size, Investment Opportunities, Pricing, Restraints, Outlook, Challenges, Analysis, Drivers, Value, Demand, Insights, Trends, Growth, Share
- Bangladesh Electric Appliance Rental Market (2026-2032) | Drivers, Forecast, Investment Opportunities, Strategy, Insights, Demand, Challenges, Outlook, Trends, Competition, Value, Revenue, Size, Pricing, Analysis, Companies, Restraints, segmentation, Share, Growth
- Bahrain Electric Appliance Rental Market (2026-2032) | Outlook, Size, Competition, Restraints, Drivers, Value, Trends, Investment Opportunities, Insights, Forecast, Revenue, Strategy, Growth, Share, Demand, Analysis, Challenges, Companies, segmentation, Pricing
- Azerbaijan Electric Appliance Rental Market (2026-2032) | Trends, Investment Opportunities, Restraints, Insights, Strategy, Competition, Value, Growth, Demand, Drivers, Analysis, Forecast, Size, Share, Outlook, segmentation, Pricing, Challenges, Revenue, Companies
- Australia Electric Appliance Rental Market (2026-2032) | Challenges, Restraints, Forecast, Demand, Size, Competition, Pricing, Investment Opportunities, Revenue, Trends, Drivers, Growth, Outlook, Analysis, Strategy, Value, segmentation, Insights, Companies, Share
- Argentina Electric Appliance Rental Market (2026-2032) | Growth, Trends, Insights, Outlook, Forecast, Size, Drivers, Analysis, Restraints, Challenges, Share, Revenue, Investment Opportunities, Strategy, Demand, Value, Companies, segmentation, Competition, Pricing
- Algeria Electric Appliance Rental Market (2026-2032) | Share, Size, Value, Strategy, Competition, Outlook, Challenges, Companies, Trends, Pricing, Insights, Forecast, Investment Opportunities, Revenue, Growth, Restraints, segmentation, Analysis, Demand, Drivers
Industry Events and Analyst Meet

HIMTEX 2026

India Refining Summit 2026

India EV Show 2026

EV tech India Expo 2026

Auto Tech Asia 2026
Whitepaper
- Middle East & Africa Commercial Security Market Click here to view more.
- Middle East & Africa Fire Safety Systems & Equipment Market Click here to view more.
- GCC Drone Market Click here to view more.
- Middle East Lighting Fixture Market Click here to view more.
- GCC Physical & Perimeter Security Market Click here to view more.
6WResearch In News
- Doha a strategic location for EV manufacturing hub: IPA Qatar
- Demand for luxury TVs surging in the GCC, says Samsung
- Empowering Growth: The Thriving Journey of Bangladesh’s Cable Industry
- Demand for luxury TVs surging in the GCC, says Samsung
- Video call with a traditional healer? Once unthinkable, it’s now common in South Africa
- Intelligent Buildings To Smooth GCC’s Path To Net Zero