Argentina Interactive Tables Market (2026-2032) Outlook | Companies, Share, Analysis, Forecast, Trends, Size, Growth, Value, Industry & Revenue
Market Forecast By Technology (LCD, LED, Capacitive, Others), By Screen Size (32-65 Inch, 65 Inch & Above), By Application (Exhibition & Trade Shows, Education, Retail, Control Room, Hospitality, Transportation, Others) And Competitive Landscape
| Product Code: ETC275045 | Publication Date: Aug 2022 | Updated Date: Mar 2026 | Product Type: Market Research Report | |
| Publisher: 6Wresearch | Author: Ravi Bhandari | No. of Pages: 75 | No. of Figures: 35 | No. of Tables: 20 |
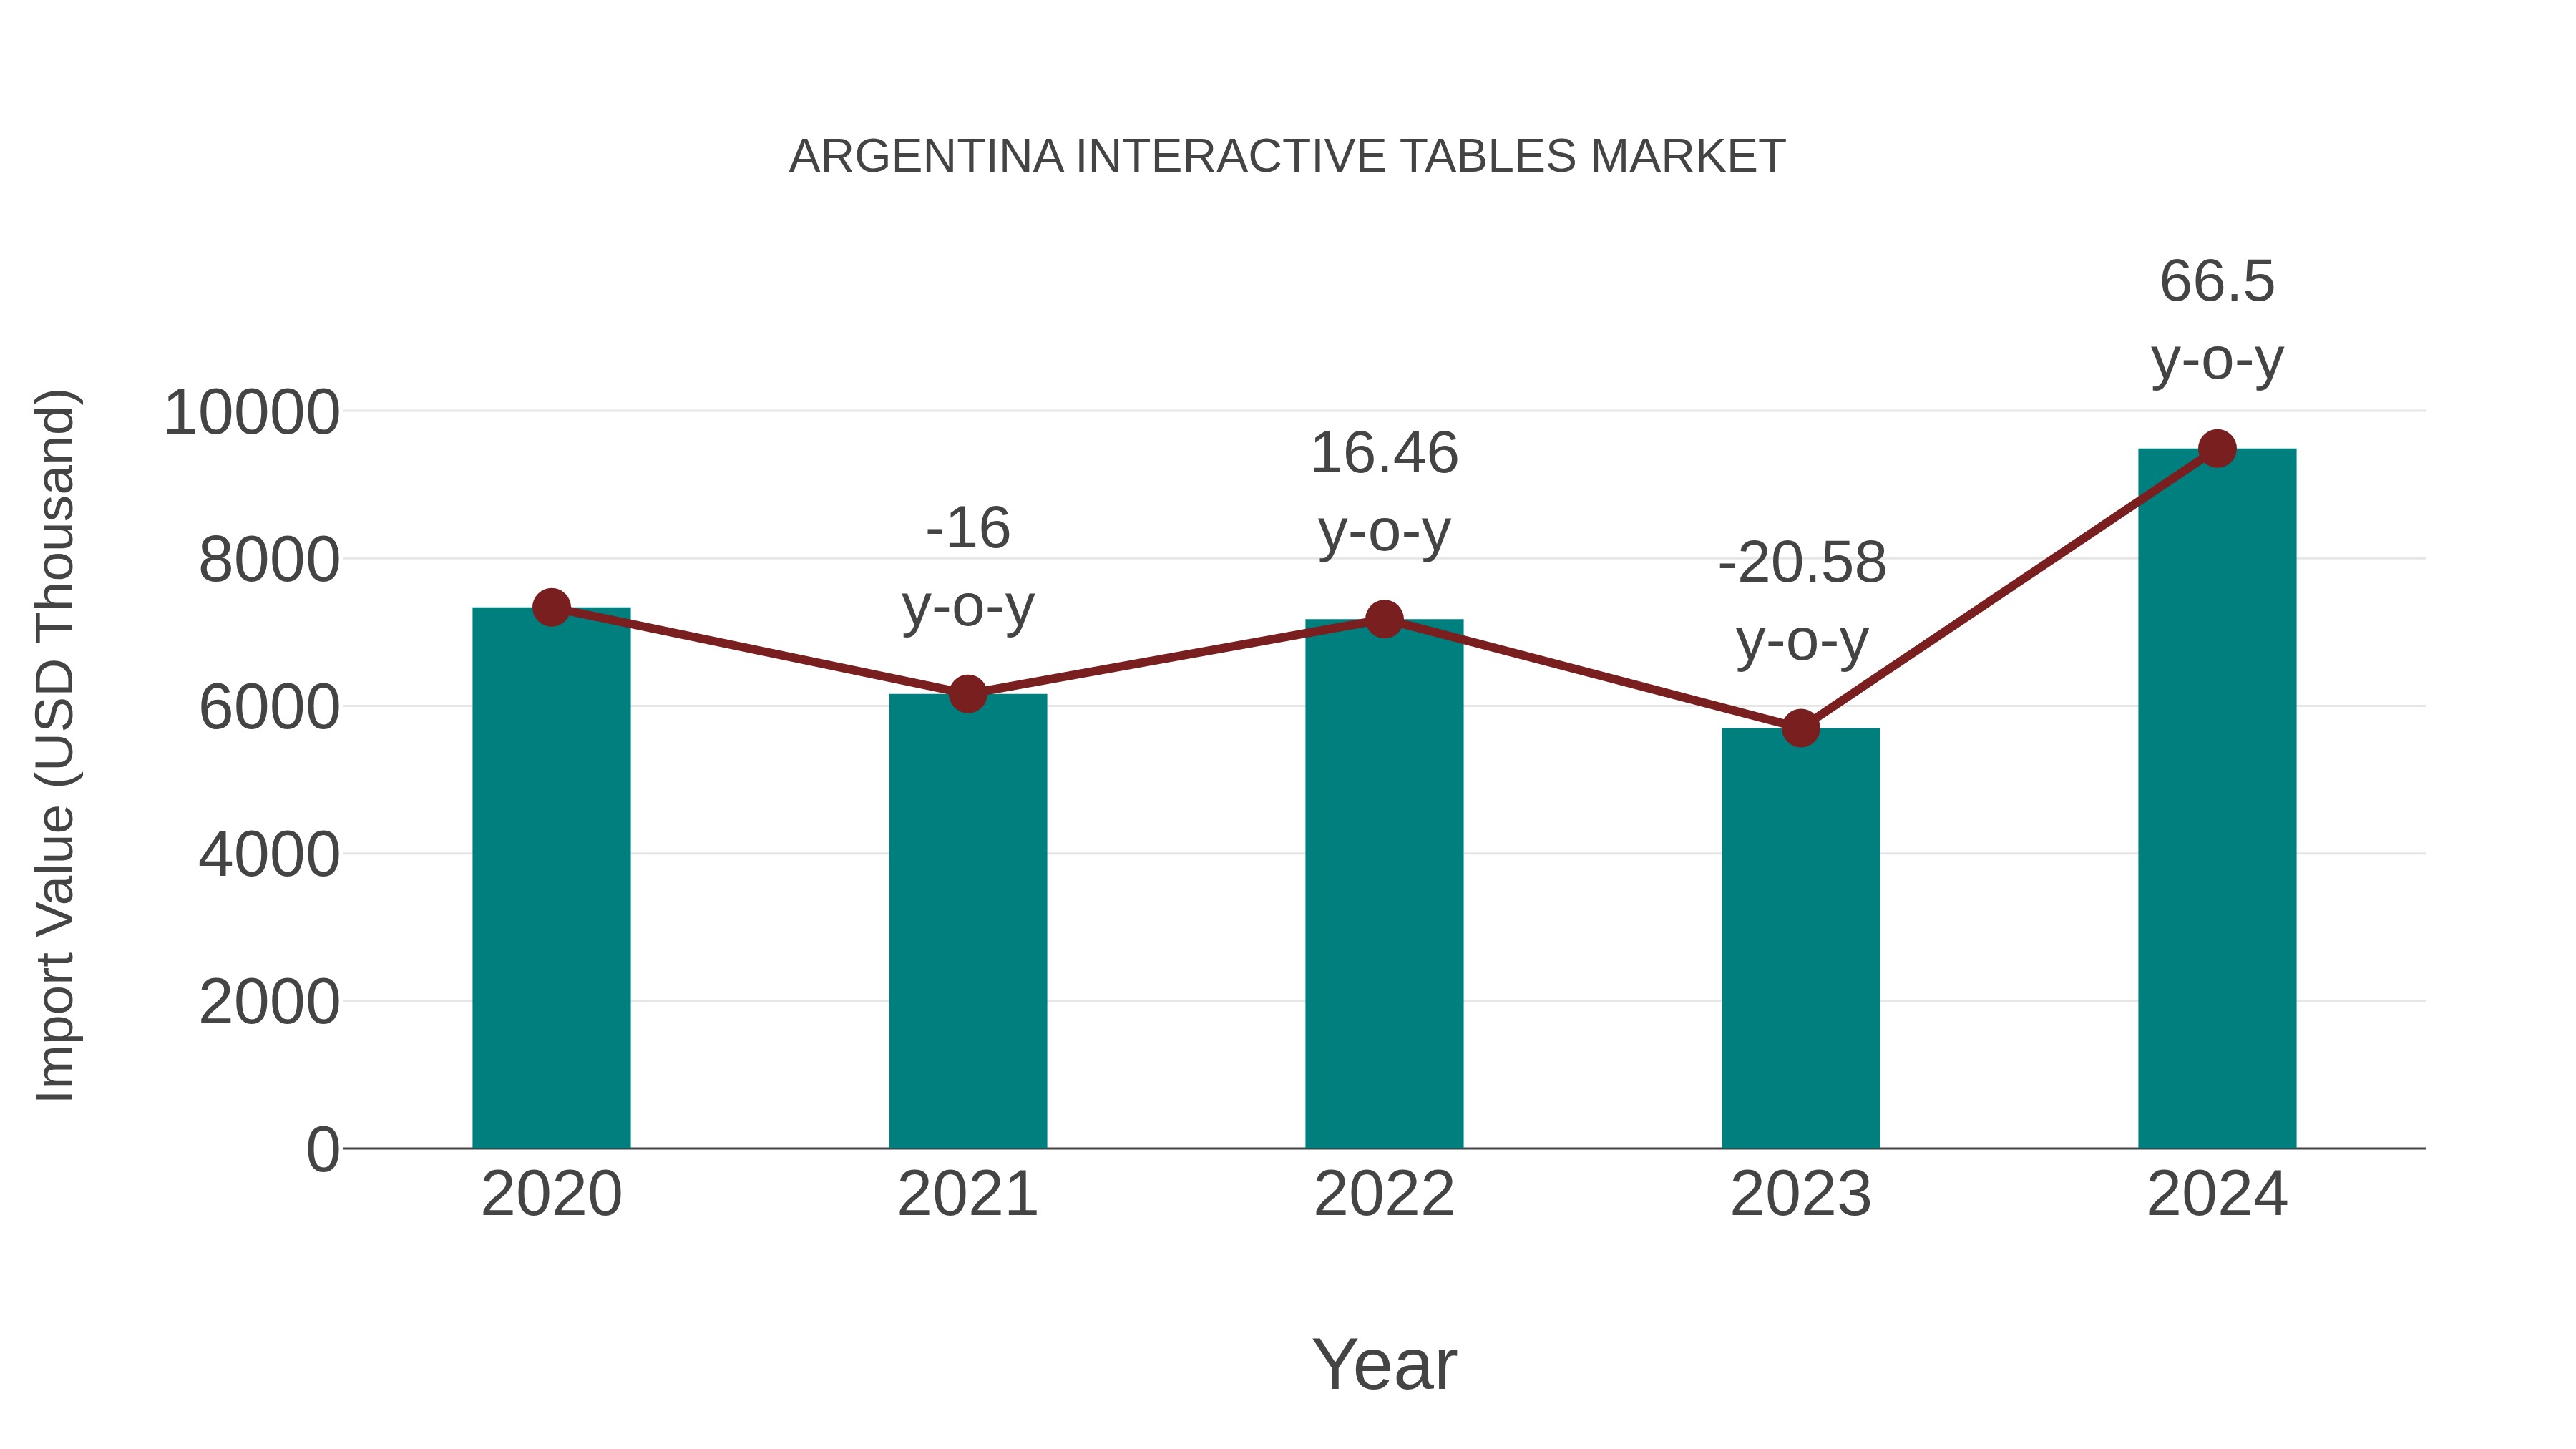
Argentina Interactive Tables Market: Import Trend Analysis
The Argentina interactive tables market witnessed a steady increase in imports from 2020 to 2024. The Compound Annual Growth Rate (CAGR) for the period 2020-2024 stood at 6.64%. Notably, the year-on-year growth rate spiked to 66.50% in 2023-2024, indicating a significant surge in imports during that period.
Argentina Interactive Tables Market Synopsis
Interactive Tables are redefining the concept of shared digital spaces in Argentina, facilitating collaborative work environments, interactive gaming experiences, and engaging retail interactions. These multitouch surfaces enable intuitive interaction with digital content, fostering creativity, communication, and productivity. As businesses and institutions seek to enhance engagement and collaboration, the demand for Interactive Tables is on the rise.
Drivers of the market
The Argentina Interactive Tables Market is witnessing significant growth driven by the rising demand for immersive and interactive experiences across hospitality, entertainment, and retail sectors. Interactive tables integrate touchscreen technology with interactive software applications, enabling users to engage with digital content, place orders, or explore product offerings in a tactile manner. As businesses in Argentina seek to differentiate themselves and enhance customer engagement, interactive tables are increasingly being adopted to create memorable experiences and drive foot traffic.
Challenges of the market
The Argentina Interactive Tables Market faces challenges such as ensuring durability and reliability of interactive table hardware for prolonged use in diverse settings such as restaurants, retail stores, and educational institutions. Technical challenges related to multi-touch functionality, gesture recognition, and compatibility with various software applications need to be addressed for optimal user experience. Moreover, addressing concerns about hygiene and cleanliness, especially in public settings, is crucial for market acceptance. Additionally, educating end-users about the benefits and potential applications of interactive tables is essential for driving adoption.
Government Policy of the market
Argentina government has recognized the potential of interactive tables to enhance collaborative learning, interactive experiences, and customer engagement. Government policies aim to support the adoption of interactive table technologies through various measures. These include incentives for educational institutions to invest in interactive learning environments, tax breaks for businesses deploying interactive tables in retail and hospitality settings, and funding support for cultural institutions showcasing interactive exhibits. Moreover, regulatory frameworks focus on accessibility, data privacy, and content standards for interactive tables to ensure inclusivity and protect user rights. Government-industry partnerships aim to promote research and development, technology diffusion, and best practices sharing to accelerate the growth of the interactive table market, driving innovation and economic development.
Key Highlights of the Report:
- Argentina Interactive Tables Market Outlook
- Market Size of Argentina Interactive Tables Market, 2025
- Forecast of Argentina Interactive Tables Market, 2032
- Historical Data and Forecast of Argentina Interactive Tables Revenues & Volume for the Period 2022-2032F
- Argentina Interactive Tables Market Trend Evolution
- Argentina Interactive Tables Market Drivers and Challenges
- Argentina Interactive Tables Price Trends
- Argentina Interactive Tables Porter's Five Forces
- Argentina Interactive Tables Industry Life Cycle
- Historical Data and Forecast of Argentina Interactive Tables Market Revenues & Volume By Technology for the Period 2022-2032F
- Historical Data and Forecast of Argentina Interactive Tables Market Revenues & Volume By LCD for the Period 2022-2032F
- Historical Data and Forecast of Argentina Interactive Tables Market Revenues & Volume By LED for the Period 2022-2032F
- Historical Data and Forecast of Argentina Interactive Tables Market Revenues & Volume By Capacitive for the Period 2022-2032F
- Historical Data and Forecast of Argentina Interactive Tables Market Revenues & Volume By Others for the Period 2022-2032F
- Historical Data and Forecast of Argentina Interactive Tables Market Revenues & Volume By Screen Size for the Period 2022-2032F
- Historical Data and Forecast of Argentina Interactive Tables Market Revenues & Volume By 32-65 Inch for the Period 2022-2032F
- Historical Data and Forecast of Argentina Interactive Tables Market Revenues & Volume By 65 Inch & Above for the Period 2022-2032F
- Historical Data and Forecast of Argentina Interactive Tables Market Revenues & Volume By Application for the Period 2022-2032F
- Historical Data and Forecast of Argentina Interactive Tables Market Revenues & Volume By Exhibition & Trade Shows for the Period 2022-2032F
- Historical Data and Forecast of Argentina Interactive Tables Market Revenues & Volume By Education for the Period 2022-2032F
- Historical Data and Forecast of Argentina Interactive Tables Market Revenues & Volume By Retail for the Period 2022-2032F
- Historical Data and Forecast of Argentina Interactive Tables Market Revenues & Volume By Control Room for the Period 2022-2032F
- Historical Data and Forecast of Argentina Interactive Tables Market Revenues & Volume By Hospitality for the Period 2022-2032F
- Historical Data and Forecast of Argentina Interactive Tables Market Revenues & Volume By Transportation for the Period 2022-2032F
- Historical Data and Forecast of Argentina Interactive Tables Market Revenues & Volume By Others for the Period 2022-2032F
- Argentina Interactive Tables Import Export Trade Statistics
- Market Opportunity Assessment By Technology
- Market Opportunity Assessment By Screen Size
- Market Opportunity Assessment By Application
- Argentina Interactive Tables Top Companies Market Share
- Argentina Interactive Tables Competitive Benchmarking By Technical and Operational Parameters
- Argentina Interactive Tables Company Profiles
- Argentina Interactive Tables Key Strategic Recommendations
Argentina Interactive Tables Market (2026-2032): FAQs
6Wresearch actively monitors the Argentina Interactive Tables Market and publishes its comprehensive annual report, highlighting emerging trends, growth drivers, revenue analysis, and forecast outlook. Our insights help businesses to make data-backed strategic decisions with ongoing market dynamics. Our analysts track relevent industries related to the Argentina Interactive Tables Market, allowing our clients with actionable intelligence and reliable forecasts tailored to emerging regional needs.
Yes, we provide customisation as per your requirements. To learn more, feel free to contact us on sales@6wresearch.com
1 Executive Summary |
2 Introduction |
2.1 Key Highlights of the Report |
2.2 Report Description |
2.3 Market Scope & Segmentation |
2.4 Research Methodology |
2.5 Assumptions |
3 Argentina Interactive Tables Market Overview |
3.1 Argentina Country Macro Economic Indicators |
3.2 Argentina Interactive Tables Market Revenues & Volume, 2022 & 2032F |
3.3 Argentina Interactive Tables Market - Industry Life Cycle |
3.4 Argentina Interactive Tables Market - Porter's Five Forces |
3.5 Argentina Interactive Tables Market Revenues & Volume Share, By Technology, 2022 & 2032F |
3.6 Argentina Interactive Tables Market Revenues & Volume Share, By Screen Size, 2022 & 2032F |
3.7 Argentina Interactive Tables Market Revenues & Volume Share, By Application, 2022 & 2032F |
4 Argentina Interactive Tables Market Dynamics |
4.1 Impact Analysis |
4.2 Market Drivers |
4.2.1 Increasing demand for interactive and engaging technologies in educational institutions and corporate settings |
4.2.2 Growing trend of digital transformation across various industries in Argentina |
4.2.3 Rising adoption of interactive tables for enhancing customer experience in retail and hospitality sectors |
4.3 Market Restraints |
4.3.1 High initial investment costs associated with deploying interactive tables |
4.3.2 Limited awareness and understanding of the benefits of interactive tables among potential users |
4.3.3 Challenges related to technical compatibility and integration with existing systems and software |
5 Argentina Interactive Tables Market Trends |
6 Argentina Interactive Tables Market, By Types |
6.1 Argentina Interactive Tables Market, By Technology |
6.1.1 Overview and Analysis |
6.1.2 Argentina Interactive Tables Market Revenues & Volume, By Technology, 2022-2032F |
6.1.3 Argentina Interactive Tables Market Revenues & Volume, By LCD, 2022-2032F |
6.1.4 Argentina Interactive Tables Market Revenues & Volume, By LED, 2022-2032F |
6.1.5 Argentina Interactive Tables Market Revenues & Volume, By Capacitive, 2022-2032F |
6.1.6 Argentina Interactive Tables Market Revenues & Volume, By Others, 2022-2032F |
6.2 Argentina Interactive Tables Market, By Screen Size |
6.2.1 Overview and Analysis |
6.2.2 Argentina Interactive Tables Market Revenues & Volume, By 32-65 Inch, 2022-2032F |
6.2.3 Argentina Interactive Tables Market Revenues & Volume, By 65 Inch & Above, 2022-2032F |
6.3 Argentina Interactive Tables Market, By Application |
6.3.1 Overview and Analysis |
6.3.2 Argentina Interactive Tables Market Revenues & Volume, By Exhibition & Trade Shows, 2022-2032F |
6.3.3 Argentina Interactive Tables Market Revenues & Volume, By Education, 2022-2032F |
6.3.4 Argentina Interactive Tables Market Revenues & Volume, By Retail, 2022-2032F |
6.3.5 Argentina Interactive Tables Market Revenues & Volume, By Control Room, 2022-2032F |
6.3.6 Argentina Interactive Tables Market Revenues & Volume, By Hospitality, 2022-2032F |
6.3.7 Argentina Interactive Tables Market Revenues & Volume, By Transportation, 2022-2032F |
7 Argentina Interactive Tables Market Import-Export Trade Statistics |
7.1 Argentina Interactive Tables Market Export to Major Countries |
7.2 Argentina Interactive Tables Market Imports from Major Countries |
8 Argentina Interactive Tables Market Key Performance Indicators |
8.1 Average time spent per user interacting with the interactive tables |
8.2 Number of new applications or software developed specifically for interactive tables in Argentina |
8.3 Percentage increase in the number of interactive table deployments in educational institutions and corporate offices |
9 Argentina Interactive Tables Market - Opportunity Assessment |
9.1 Argentina Interactive Tables Market Opportunity Assessment, By Technology, 2022 & 2032F |
9.2 Argentina Interactive Tables Market Opportunity Assessment, By Screen Size, 2022 & 2032F |
9.3 Argentina Interactive Tables Market Opportunity Assessment, By Application, 2022 & 2032F |
10 Argentina Interactive Tables Market - Competitive Landscape |
10.1 Argentina Interactive Tables Market Revenue Share, By Companies, 2025 |
10.2 Argentina Interactive Tables Market Competitive Benchmarking, By Operating and Technical Parameters |
11 Company Profiles |
12 Recommendations |
13 Disclaimer |
Global Go To Market Strategy - 2030
Export potential enables firms to identify high-growth global markets with greater confidence by combining advanced trade intelligence with a structured quantitative methodology. The framework analyzes emerging demand trends and country-level import patterns while integrating macroeconomic and trade datasets such as GDP and population forecasts, bilateral import–export flows, tariff structures, elasticity differentials between developed and developing economies, geographic distance, and import demand projections. Using weighted trade values from 2020–2024 as the base period to project country-to-country export potential for 2030, these inputs are operationalized through calculated drivers such as gravity model parameters, tariff impact factors, and projected GDP per-capita growth. Through an analysis of hidden potentials, demand hotspots, and market conditions that are most favorable to success, this method enables firms to focus on target countries, maximize returns, and global expansion with data, backed by accuracy.
By factoring in the projected importer demand gap that is currently unmet and could be potential opportunity, it identifies the potential for the Exporter (Country) among 190 countries, against the general trade analysis, which identifies the biggest importer or exporter.
To discover high-growth global markets and optimize your business strategy:
Click Here
Pricing
- Single User License$ 1,995
- Department License$ 2,400
- Site License$ 3,120
- Global License$ 3,795

Leadership Perspectives from Industry Events
Search
Thought Leadership and Analyst Meet


Our Clients
6WResearch In News
- India Air Conditioner Market Set for Strong Rebound in 2026 After Weather-Led Correction and GST-Driven Recovery: 6Wresearch
- ADAS in India: How Automatic Emergency Braking, Blind Spot Detection & Driver Monitoring are Transforming Road Safety
- Doha a strategic location for EV manufacturing hub: IPA Qatar
- Demand for luxury TVs surging in the GCC, says Samsung
- Empowering Growth: The Thriving Journey of Bangladesh’s Cable Industry
- Demand for luxury TVs surging in the GCC, says Samsung
Latest Reports
- Nicaragua RPG Gaming Market (2026-2032)
- New Zealand RPG Gaming Market (2026-2032)
- Netherlands RPG Gaming Market (2026-2032)
- Nauru RPG Gaming Market (2026-2032)
- Namibia RPG Gaming Market (2026-2032)
- Mozambique RPG Gaming Market (2026-2032)
- Montenegro RPG Gaming Market (2026-2032)
- Mongolia RPG Gaming Market (2026-2032)
- Monaco RPG Gaming Market (2026-2032)
- Micronesia RPG Gaming Market (2026-2032)
Industry Events and Analyst Meet

EV India Expo 2026

HIMTEX 2026

India Refining Summit 2026

India EV Show 2026

EV tech India Expo 2026
Whitepaper
- Middle East & Africa Commercial Security Market Click here to view more.
- Middle East & Africa Fire Safety Systems & Equipment Market Click here to view more.
- GCC Drone Market Click here to view more.
- Middle East Lighting Fixture Market Click here to view more.
- GCC Physical & Perimeter Security Market Click here to view more.