Argentina Levulinic Acid Market (2026-2032) Outlook | Analysis, Growth, Revenue, Trends, Value, Size, Forecast, Share, Industry & Companies
Market Forecast By Application (Plasticizers, Pharmaceuticals & Cosmetics), By Technology (Acid Hydrolysis, Biofine) And Competitive Landscape
| Product Code: ETC4486026 | Publication Date: Jul 2023 | Updated Date: Mar 2026 | Product Type: Report | |
| Publisher: 6Wresearch | Author: Dhaval Chaurasia | No. of Pages: 85 | No. of Figures: 45 | No. of Tables: 25 |
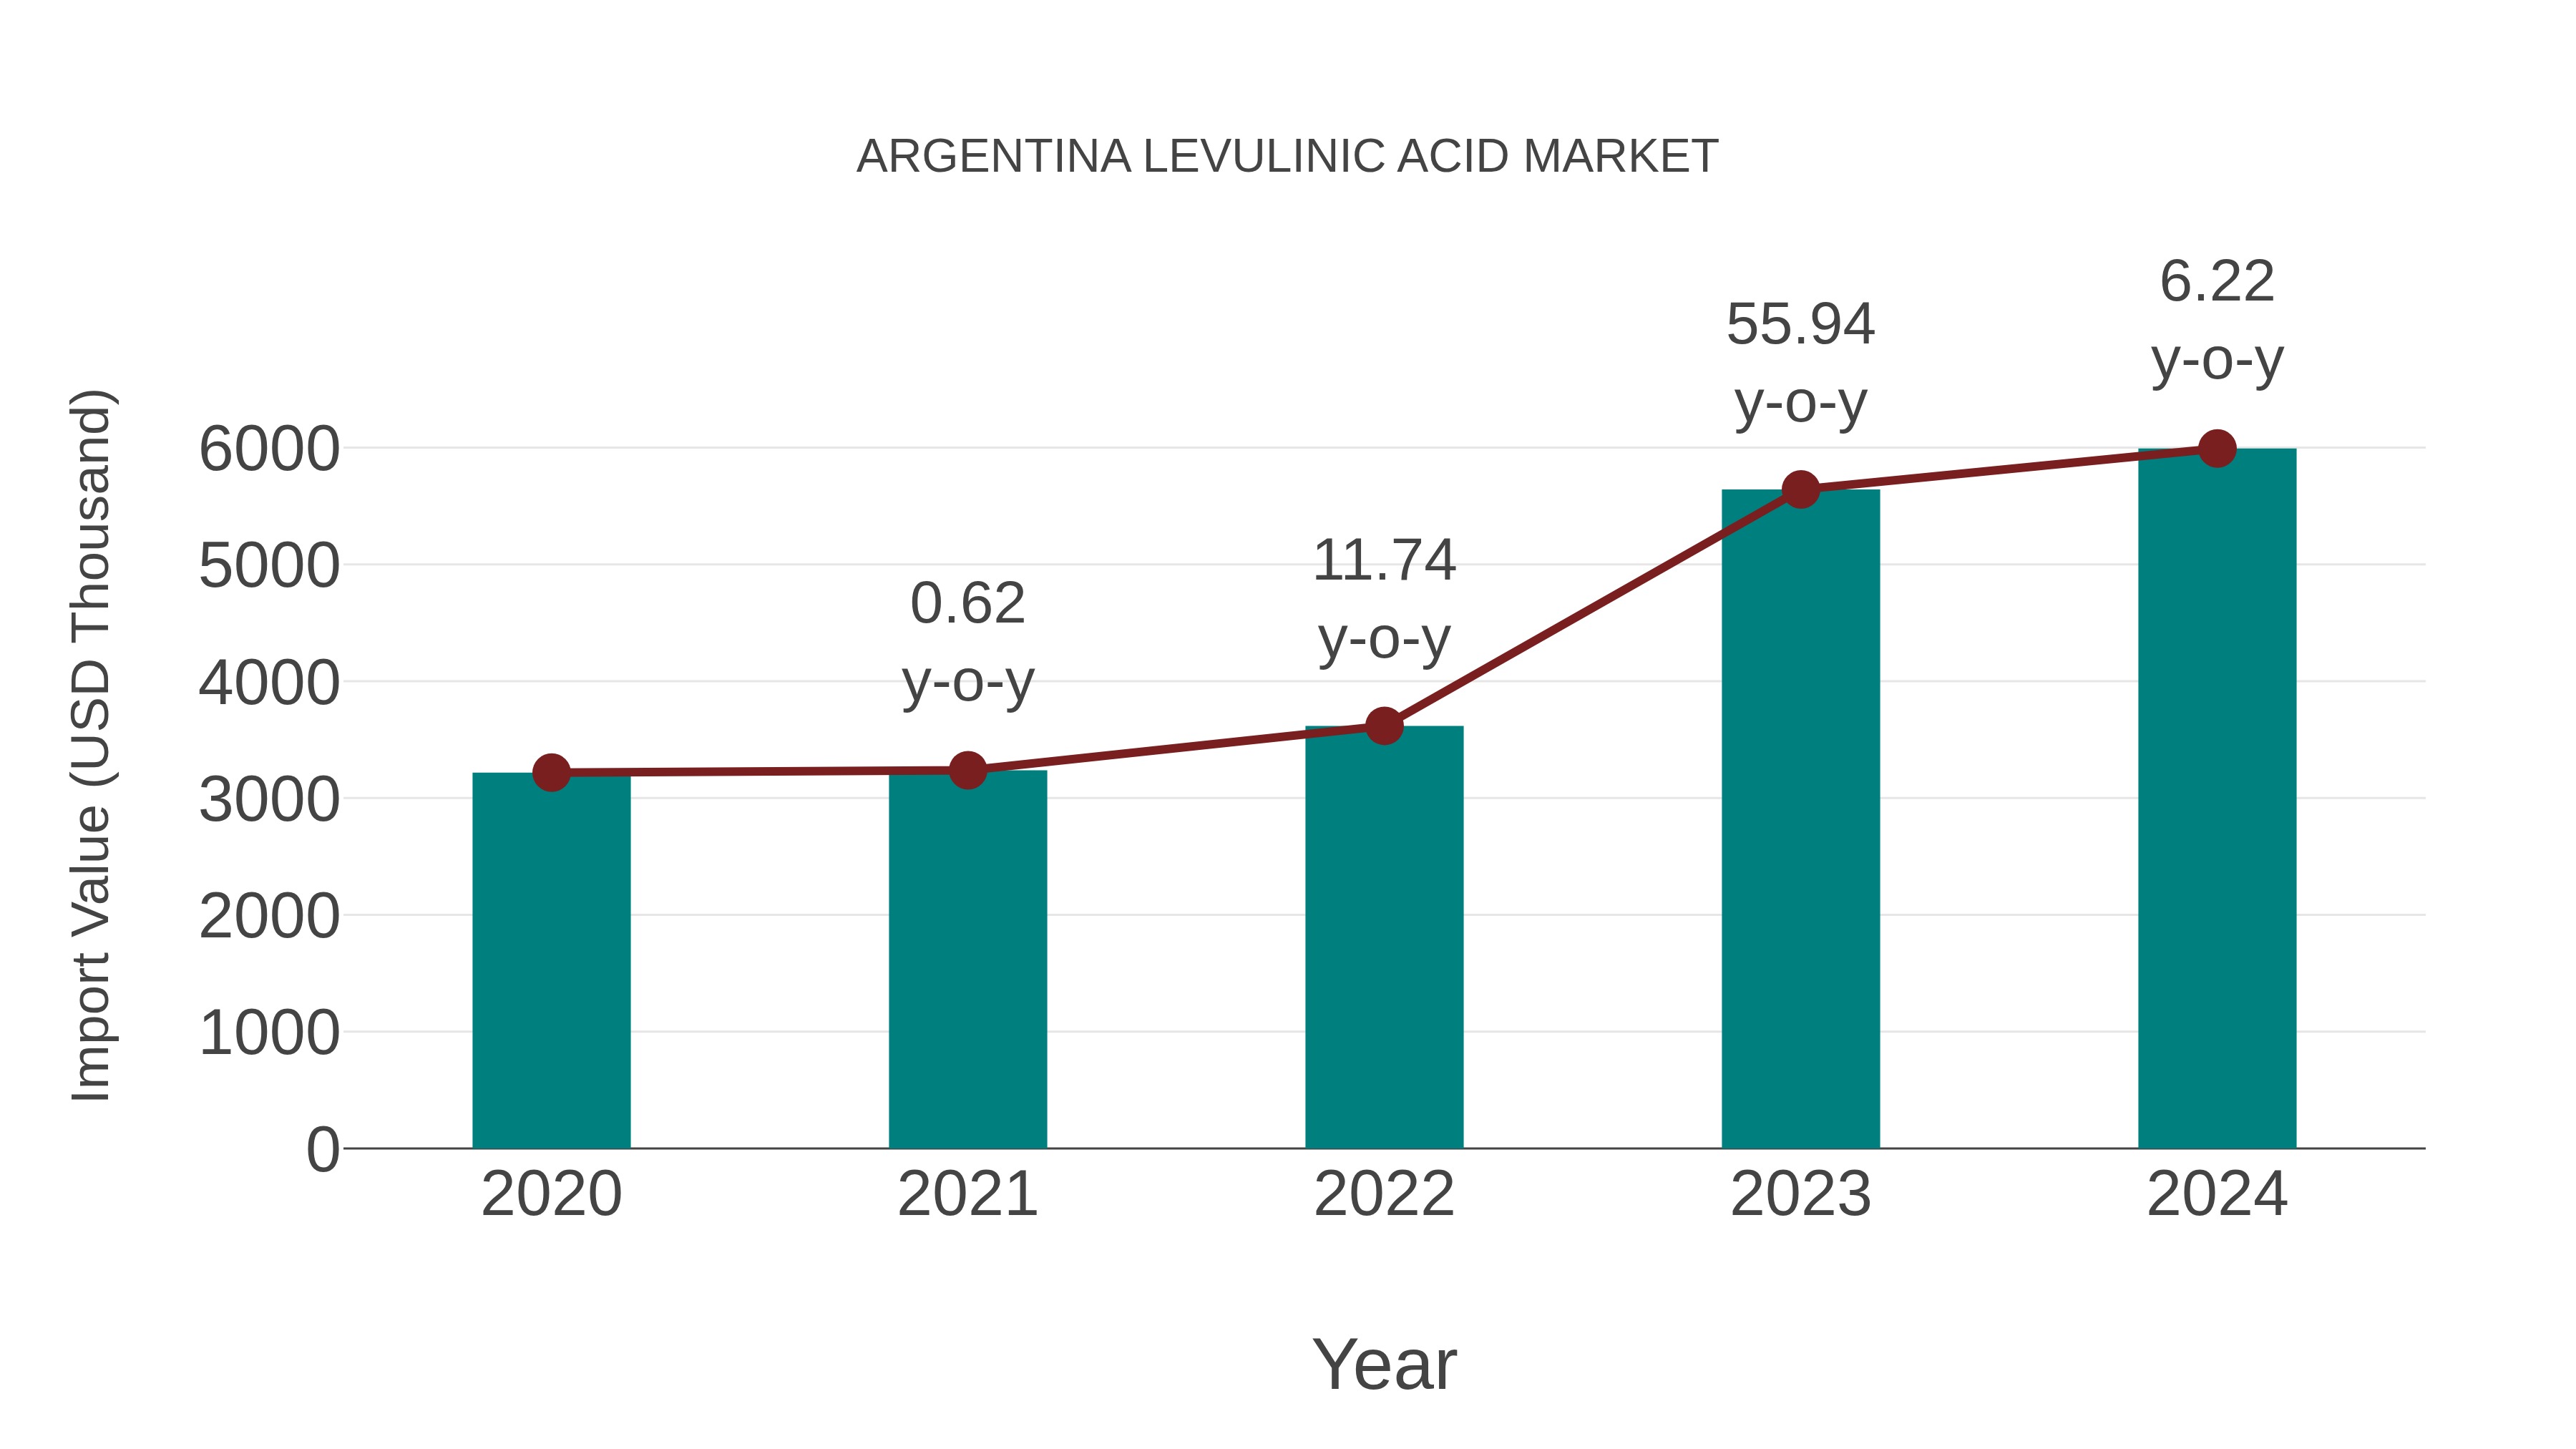
Argentina Levulinic Acid Market: Import Trend Analysis
Argentina`s import trend for levulinic acid experienced a notable decline with a Compound Annual Growth Rate (CAGR) of -92.31% between 2020 and 2024. This drastic decrease in imports indicates a significant shift in demand or market dynamics, impacting the overall trade performance in the sector.
Argentina Levulinic Acid Market Synopsis
The Argentina Levulinic Acid market is experiencing significant growth driven by the increasing demand for sustainable and bio-based chemicals in various industries including pharmaceuticals, agriculture, and cosmetics. With levulinic acid being a versatile platform chemical, there is a rising interest in its production and applications in Argentina.
Drivers of the market
The Argentina Levulinic Acid Market is witnessing growth due to the increasing demand for sustainable and bio-based chemicals in various industries such as pharmaceuticals, cosmetics, and agrochemicals. Levulinic acid, derived from renewable feedstocks such as biomass, offers several advantages including biodegradability, non-toxicity, and versatility. The growing emphasis on environmental sustainability and the shift towards bio-economy are driving the adoption of levulinic acid in Argentina. Moreover, the expanding applications of levulinic acid as a precursor for various chemical derivatives are further fueling market growth.
Challenges of the market
The Argentina levulinic acid market faces challenges related to production dynamics, market competition, and regulatory constraints. Fluctuations in feedstock availability and pricing, such as biomass or agricultural residues used in levulinic acid production, can impact the cost competitiveness of domestic manufacturers. Moreover, competition from international levulinic acid producers and alternative bio-based chemicals poses challenges for Argentina levulinic acid industry to maintain market share and competitiveness. Regulatory requirements concerning environmental sustainability, chemical safety, and product quality certifications add complexity to the production and marketing of levulinic acid, increasing compliance costs for manufacturers. Additionally, fluctuations in currency exchange rates and economic instability can impact the profitability and pricing strategies of levulinic acid producers in Argentina market, further complicating market dynamics.
Government Policy of the market
Recognizing the potential of levulinic acid as a renewable chemical building block, the Argentina government has introduced policies to support research and development initiatives in the production of levulinic acid from biomass. These policies include grants for bio-refinery projects, tax incentives for companies investing in levulinic acid production technology, and regulatory frameworks to facilitate commercialization and market access.
Key Highlights of the Report:
- Argentina Levulinic Acid Market Outlook
- Market Size of Argentina Levulinic Acid Market, 2025
- Forecast of Argentina Levulinic Acid Market, 2032
- Historical Data and Forecast of Argentina Levulinic Acid Revenues & Volume for the Period 2022-2032F
- Argentina Levulinic Acid Market Trend Evolution
- Argentina Levulinic Acid Market Drivers and Challenges
- Argentina Levulinic Acid Price Trends
- Argentina Levulinic Acid Porter's Five Forces
- Argentina Levulinic Acid Industry Life Cycle
- Historical Data and Forecast of Argentina Levulinic Acid Market Revenues & Volume By Application for the Period 2022-2032F
- Historical Data and Forecast of Argentina Levulinic Acid Market Revenues & Volume By Plasticizers for the Period 2022-2032F
- Historical Data and Forecast of Argentina Levulinic Acid Market Revenues & Volume By Pharmaceuticals & Cosmetics for the Period 2022-2032F
- Historical Data and Forecast of Argentina Levulinic Acid Market Revenues & Volume By Technology for the Period 2022-2032F
- Historical Data and Forecast of Argentina Levulinic Acid Market Revenues & Volume By Acid Hydrolysis for the Period 2022-2032F
- Historical Data and Forecast of Argentina Levulinic Acid Market Revenues & Volume By Biofine for the Period 2022-2032F
- Argentina Levulinic Acid Import Export Trade Statistics
- Market Opportunity Assessment By Application
- Market Opportunity Assessment By Technology
- Argentina Levulinic Acid Top Companies Market Share
- Argentina Levulinic Acid Competitive Benchmarking By Technical and Operational Parameters
- Argentina Levulinic Acid Company Profiles
- Argentina Levulinic Acid Key Strategic Recommendations
Argentina Levulinic Acid Market (2026-2032): FAQs
6Wresearch actively monitors the Argentina Levulinic Acid Market and publishes its comprehensive annual report, highlighting emerging trends, growth drivers, revenue analysis, and forecast outlook. Our insights help businesses to make data-backed strategic decisions with ongoing market dynamics. Our analysts track relevent industries related to the Argentina Levulinic Acid Market, allowing our clients with actionable intelligence and reliable forecasts tailored to emerging regional needs.
Yes, we provide customisation as per your requirements. To learn more, feel free to contact us on sales@6wresearch.com
1 Executive Summary |
2 Introduction |
2.1 Key Highlights of the Report |
2.2 Report Description |
2.3 Market Scope & Segmentation |
2.4 Research Methodology |
2.5 Assumptions |
3 Argentina Levulinic Acid Market Overview |
3.1 Argentina Country Macro Economic Indicators |
3.2 Argentina Levulinic Acid Market Revenues & Volume, 2022 & 2032F |
3.3 Argentina Levulinic Acid Market - Industry Life Cycle |
3.4 Argentina Levulinic Acid Market - Porter's Five Forces |
3.5 Argentina Levulinic Acid Market Revenues & Volume Share, By Application, 2022 & 2032F |
3.6 Argentina Levulinic Acid Market Revenues & Volume Share, By Technology, 2022 & 2032F |
4 Argentina Levulinic Acid Market Dynamics |
4.1 Impact Analysis |
4.2 Market Drivers |
4.2.1 Increasing demand for bio-based products and chemicals in Argentina |
4.2.2 Rising awareness about environmental sustainability |
4.2.3 Government initiatives and regulations promoting the use of bio-based chemicals in the country |
4.3 Market Restraints |
4.3.1 High production costs associated with levulinic acid manufacturing |
4.3.2 Lack of widespread adoption and awareness about levulinic acid |
4.3.3 Competition from conventional chemical alternatives |
5 Argentina Levulinic Acid Market Trends |
6 Argentina Levulinic Acid Market, By Types |
6.1 Argentina Levulinic Acid Market, By Application |
6.1.1 Overview and Analysis |
6.1.2 Argentina Levulinic Acid Market Revenues & Volume, By Application, 2022-2032F |
6.1.3 Argentina Levulinic Acid Market Revenues & Volume, By Plasticizers, 2022-2032F |
6.1.4 Argentina Levulinic Acid Market Revenues & Volume, By Pharmaceuticals & Cosmetics, 2022-2032F |
6.2 Argentina Levulinic Acid Market, By Technology |
6.2.1 Overview and Analysis |
6.2.2 Argentina Levulinic Acid Market Revenues & Volume, By Acid Hydrolysis, 2022-2032F |
6.2.3 Argentina Levulinic Acid Market Revenues & Volume, By Biofine, 2022-2032F |
7 Argentina Levulinic Acid Market Import-Export Trade Statistics |
7.1 Argentina Levulinic Acid Market Export to Major Countries |
7.2 Argentina Levulinic Acid Market Imports from Major Countries |
8 Argentina Levulinic Acid Market Key Performance Indicators |
8.1 Research and development investment in levulinic acid technology |
8.2 Number of new product launches using levulinic acid |
8.3 Percentage increase in the use of bio-based chemicals in various industries |
9 Argentina Levulinic Acid Market - Opportunity Assessment |
9.1 Argentina Levulinic Acid Market Opportunity Assessment, By Application, 2022 & 2032F |
9.2 Argentina Levulinic Acid Market Opportunity Assessment, By Technology, 2022 & 2032F |
10 Argentina Levulinic Acid Market - Competitive Landscape |
10.1 Argentina Levulinic Acid Market Revenue Share, By Companies, 2025 |
10.2 Argentina Levulinic Acid Market Competitive Benchmarking, By Operating and Technical Parameters |
11 Company Profiles |
12 Recommendations |
13 Disclaimer |
Global Go To Market Strategy - 2030
Export potential enables firms to identify high-growth global markets with greater confidence by combining advanced trade intelligence with a structured quantitative methodology. The framework analyzes emerging demand trends and country-level import patterns while integrating macroeconomic and trade datasets such as GDP and population forecasts, bilateral import–export flows, tariff structures, elasticity differentials between developed and developing economies, geographic distance, and import demand projections. Using weighted trade values from 2020–2024 as the base period to project country-to-country export potential for 2030, these inputs are operationalized through calculated drivers such as gravity model parameters, tariff impact factors, and projected GDP per-capita growth. Through an analysis of hidden potentials, demand hotspots, and market conditions that are most favorable to success, this method enables firms to focus on target countries, maximize returns, and global expansion with data, backed by accuracy.
By factoring in the projected importer demand gap that is currently unmet and could be potential opportunity, it identifies the potential for the Exporter (Country) among 190 countries, against the general trade analysis, which identifies the biggest importer or exporter.
To discover high-growth global markets and optimize your business strategy:
Click Here
Pricing
- Single User License$ 1,995
- Department License$ 2,400
- Site License$ 3,120
- Global License$ 3,795

Leadership Perspectives from Industry Events
Search
Thought Leadership and Analyst Meet


Our Clients
6WResearch In News
- Doha a strategic location for EV manufacturing hub: IPA Qatar
- Demand for luxury TVs surging in the GCC, says Samsung
- Empowering Growth: The Thriving Journey of Bangladesh’s Cable Industry
- Demand for luxury TVs surging in the GCC, says Samsung
- Video call with a traditional healer? Once unthinkable, it’s now common in South Africa
- Intelligent Buildings To Smooth GCC’s Path To Net Zero
Latest Reports
- Taiwan Airport Wireless Infrastructure Market (2026-2032)
- Vietnam Airport Wireless Infrastructure Market (2026-2032)
- Thailand Airport Wireless Infrastructure Market (2026-2032)
- South Korea Airport Wireless Infrastructure Market (2026-2032)
- Romania Airport Wireless Infrastructure Market (2026-2032)
- Qatar Airport Wireless Infrastructure Market (2026-2032)
- Philippines Airport Wireless Infrastructure Market (2026-2032)
- Japan Airport Wireless Infrastructure Market (2026-2032)
- Taiwan Airport Winter Services Market (2026-2032)
- Vietnam Airport Winter Services Market (2026-2032)
Industry Events and Analyst Meet

HIMTEX 2026

India Refining Summit 2026

India EV Show 2026

EV tech India Expo 2026

Auto Tech Asia 2026
Whitepaper
- Middle East & Africa Commercial Security Market Click here to view more.
- Middle East & Africa Fire Safety Systems & Equipment Market Click here to view more.
- GCC Drone Market Click here to view more.
- Middle East Lighting Fixture Market Click here to view more.
- GCC Physical & Perimeter Security Market Click here to view more.