Armenia Grab and Go Container Market (2026-2032) | Analysis, Companies, Competitive Landscape, Share, Trends, Growth, Value, Segmentation, Size & Revenue, Industry, Forecast, Outlook
Market Forecast By Product (Cups, Bowls, Cans, Trays, Bottles, Deli Containers), By Material (Plastic, PET, PE, PVC, Paper, Others), By End Use (B2B, Food Service Outlets, Educational Institutes, Corporate Offices, Healthcare Facilities, B2C (Retail), E-commerce, Supermarket) And Competitive Landscape
| Product Code: ETC6160229 | Publication Date: Sep 2024 | Updated Date: Feb 2026 | Product Type: Market Research Report | |
| Publisher: 6Wresearch | Author: Dhaval Chaurasia | No. of Pages: 75 | No. of Figures: 35 | No. of Tables: 20 |
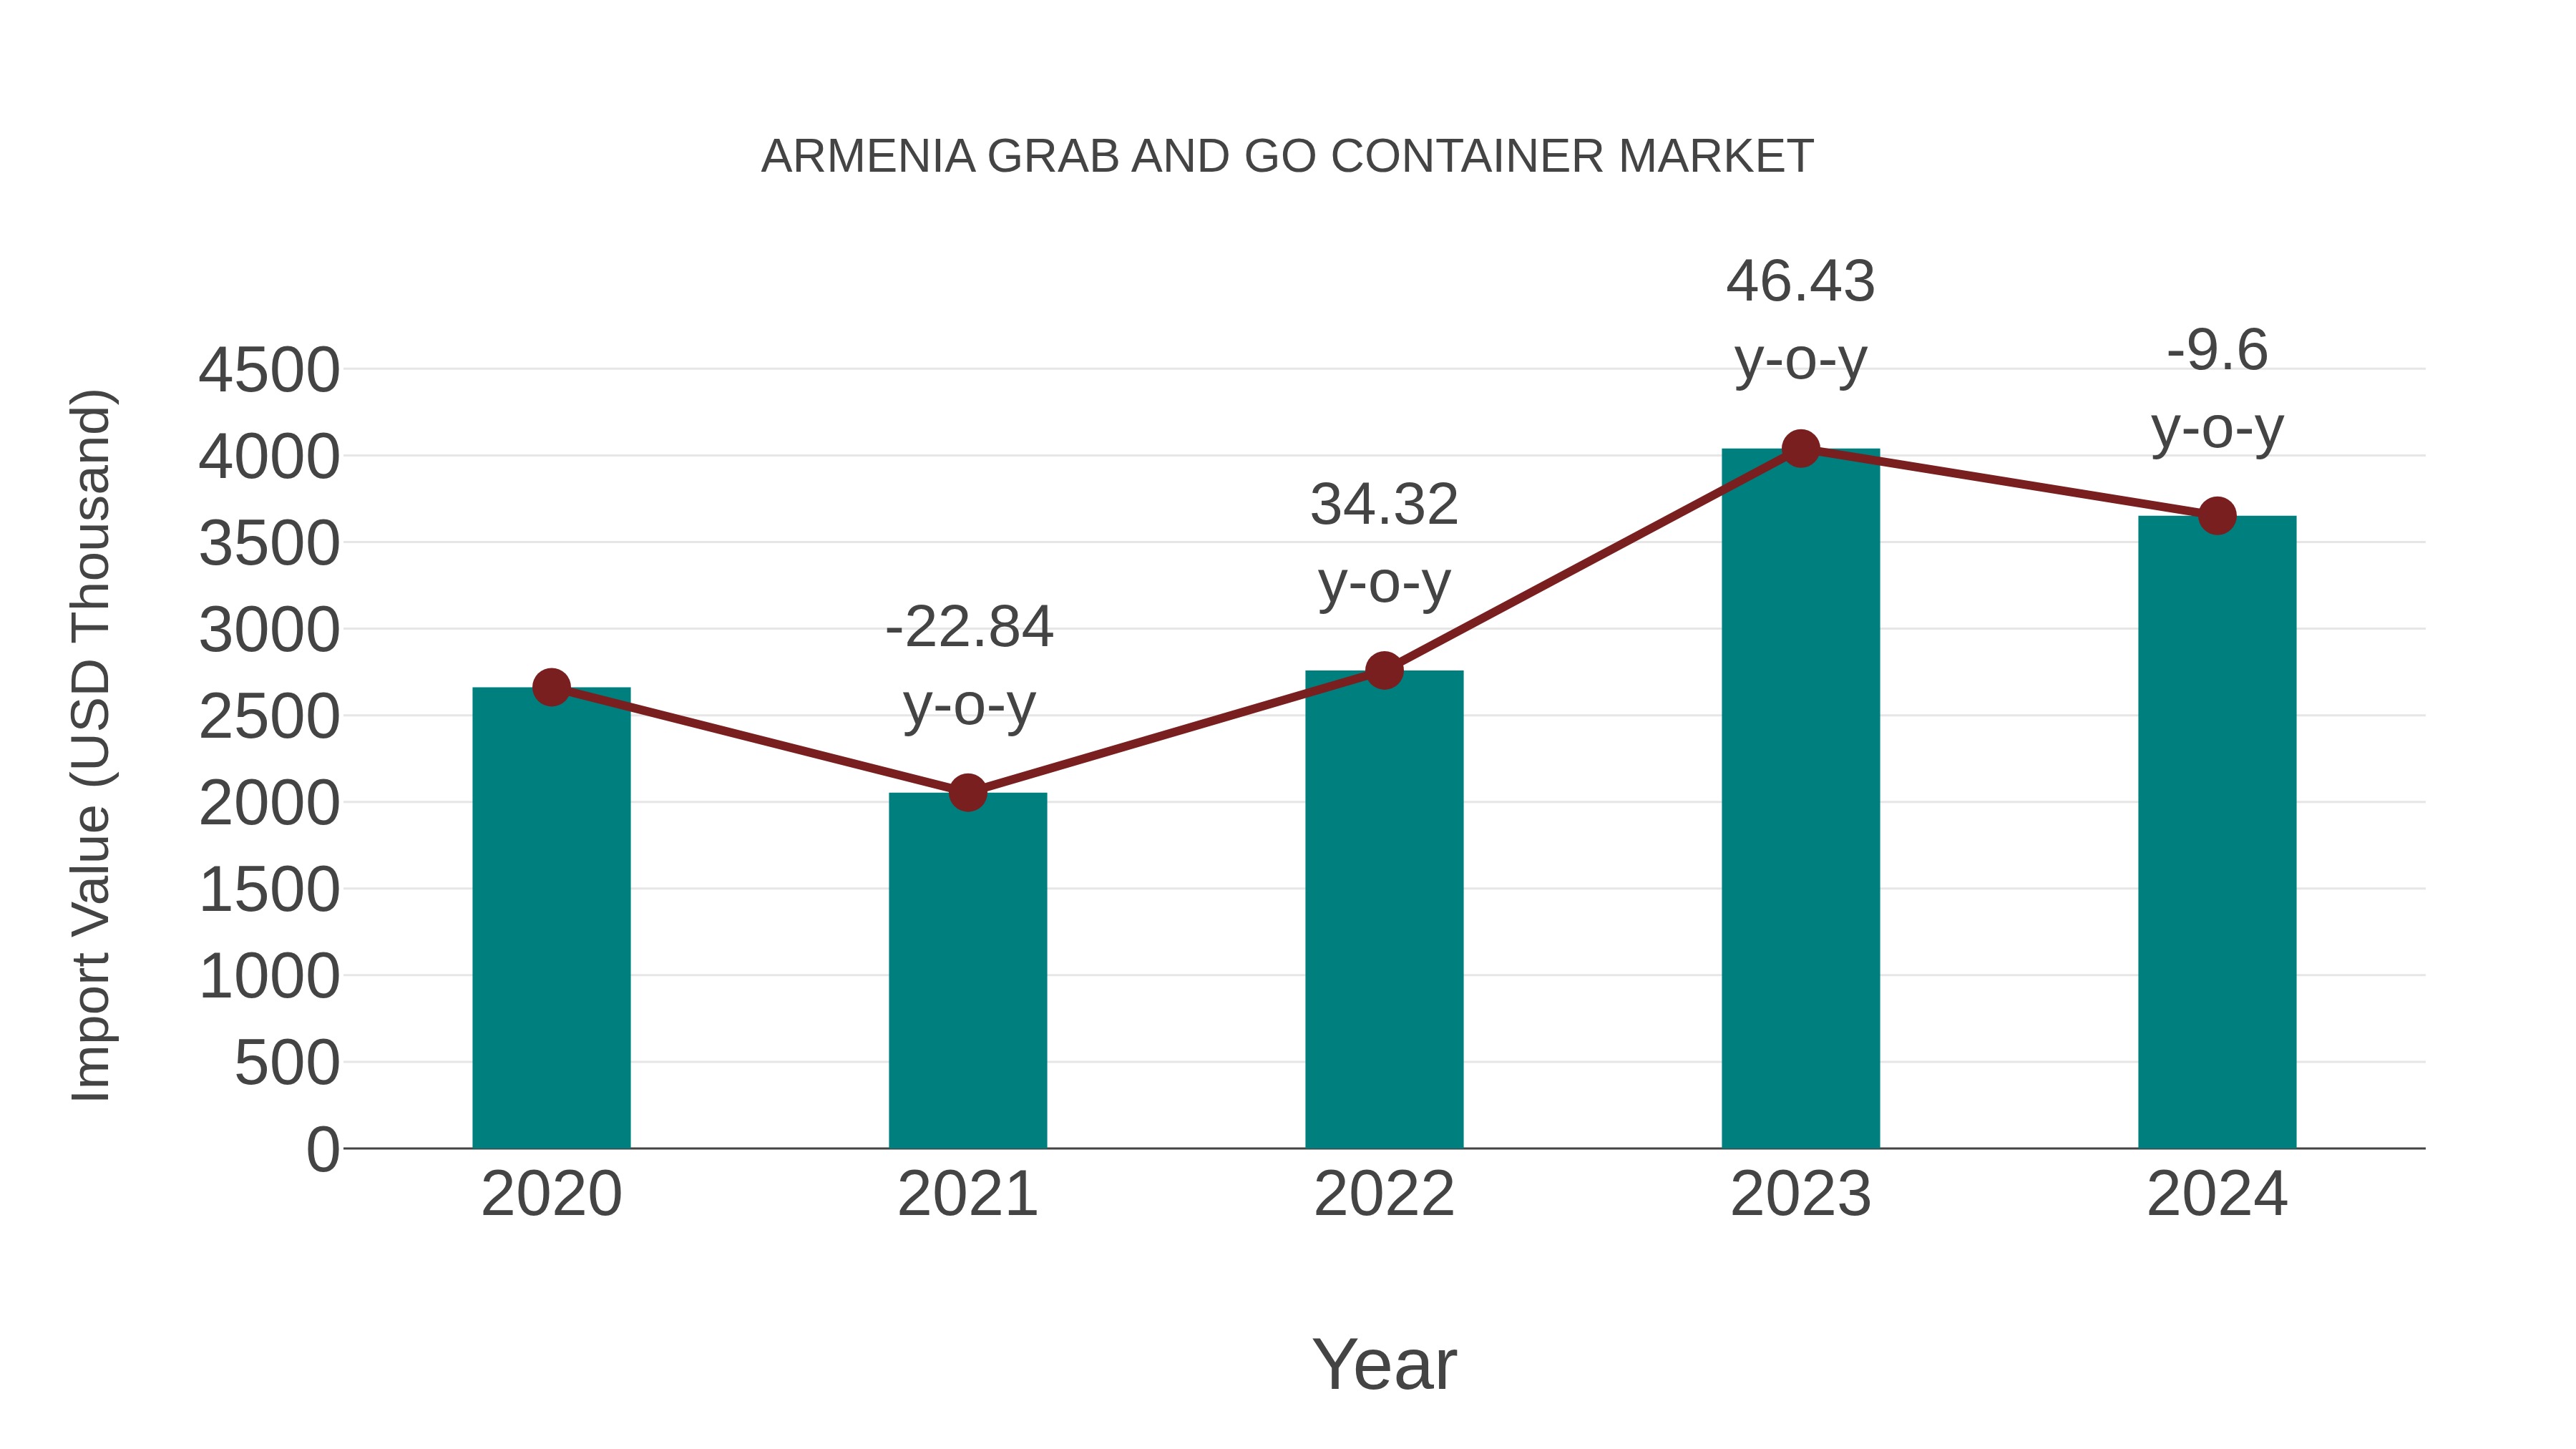
Armenia Grab and Go Container Market: Import Trend Analysis
Armenia import trend for the grab-and-go container market saw a decline in growth rate from 2023 to 2024, with a -9.6% change. However, the compound annual growth rate (CAGR) for 2020-2024 was 8.23%. This dip in import momentum in 2024 could be attributed to shifting consumer preferences or changes in trade policies impacting the market dynamics.
Key Highlights of the Report:
- Armenia Grab and Go Container Market Outlook
- Market Size of Armenia Grab and Go Container Market, 2025
- Forecast of Armenia Grab and Go Container Market, 2032
- Historical Data and Forecast of Armenia Grab and Go Container Revenues & Volume for the Period 2022-2032F
- Armenia Grab and Go Container Market Trend Evolution
- Armenia Grab and Go Container Market Drivers and Challenges
- Armenia Grab and Go Container Price Trends
- Armenia Grab and Go Container Porter's Five Forces
- Armenia Grab and Go Container Industry Life Cycle
- Historical Data and Forecast of Armenia Grab and Go Container Market Revenues & Volume By Product for the Period 2022-2032F
- Historical Data and Forecast of Armenia Grab and Go Container Market Revenues & Volume By Cups for the Period 2022-2032F
- Historical Data and Forecast of Armenia Grab and Go Container Market Revenues & Volume By Bowls for the Period 2022-2032F
- Historical Data and Forecast of Armenia Grab and Go Container Market Revenues & Volume By Cans for the Period 2022-2032F
- Historical Data and Forecast of Armenia Grab and Go Container Market Revenues & Volume By Trays for the Period 2022-2032F
- Historical Data and Forecast of Armenia Grab and Go Container Market Revenues & Volume By Bottles for the Period 2022-2032F
- Historical Data and Forecast of Armenia Grab and Go Container Market Revenues & Volume By Deli Containers for the Period 2022-2032F
- Historical Data and Forecast of Armenia Grab and Go Container Market Revenues & Volume By Material for the Period 2022-2032F
- Historical Data and Forecast of Armenia Grab and Go Container Market Revenues & Volume By Plastic for the Period 2022-2032F
- Historical Data and Forecast of Armenia Grab and Go Container Market Revenues & Volume By PET for the Period 2022-2032F
- Historical Data and Forecast of Armenia Grab and Go Container Market Revenues & Volume By PE for the Period 2022-2032F
- Historical Data and Forecast of Armenia Grab and Go Container Market Revenues & Volume By PVC for the Period 2022-2032F
- Historical Data and Forecast of Armenia Grab and Go Container Market Revenues & Volume By Paper for the Period 2022-2032F
- Historical Data and Forecast of Armenia Grab and Go Container Market Revenues & Volume By Others for the Period 2022-2032F
- Historical Data and Forecast of Armenia Grab and Go Container Market Revenues & Volume By End Use for the Period 2022-2032F
- Historical Data and Forecast of Armenia Grab and Go Container Market Revenues & Volume By B2B for the Period 2022-2032F
- Historical Data and Forecast of Armenia Grab and Go Container Market Revenues & Volume By Food Service Outlets for the Period 2022-2032F
- Historical Data and Forecast of Armenia Grab and Go Container Market Revenues & Volume By Educational Institutes for the Period 2022-2032F
- Historical Data and Forecast of Armenia Grab and Go Container Market Revenues & Volume By Corporate Offices for the Period 2022-2032F
- Historical Data and Forecast of Armenia Grab and Go Container Market Revenues & Volume By Healthcare Facilities for the Period 2022-2032F
- Historical Data and Forecast of Armenia Grab and Go Container Market Revenues & Volume By B2C (Retail) for the Period 2022-2032F
- Historical Data and Forecast of Armenia Grab and Go Container Market Revenues & Volume By E-commerce for the Period 2022-2032F
- Historical Data and Forecast of Armenia Grab and Go Container Market Revenues & Volume By Supermarket for the Period 2022-2032F
- Armenia Grab and Go Container Import Export Trade Statistics
- Market Opportunity Assessment By Product
- Market Opportunity Assessment By Material
- Market Opportunity Assessment By End Use
- Armenia Grab and Go Container Top Companies Market Share
- Armenia Grab and Go Container Competitive Benchmarking By Technical and Operational Parameters
- Armenia Grab and Go Container Company Profiles
- Armenia Grab and Go Container Key Strategic Recommendations
Frequently Asked Questions About the Market Study (FAQs):
6Wresearch actively monitors the Armenia Grab and Go Container Market and publishes its comprehensive annual report, highlighting emerging trends, growth drivers, revenue analysis, and forecast outlook. Our insights help businesses to make data-backed strategic decisions with ongoing market dynamics. Our analysts track relevent industries related to the Armenia Grab and Go Container Market, allowing our clients with actionable intelligence and reliable forecasts tailored to emerging regional needs.
Yes, we provide customisation as per your requirements. To learn more, feel free to contact us on sales@6wresearch.com
1 Executive Summary |
2 Introduction |
2.1 Key Highlights of the Report |
2.2 Report Description |
2.3 Market Scope & Segmentation |
2.4 Research Methodology |
2.5 Assumptions |
3 Armenia Grab and Go Container Market Overview |
3.1 Armenia Country Macro Economic Indicators |
3.2 Armenia Grab and Go Container Market Revenues & Volume, 2022 & 2032F |
3.3 Armenia Grab and Go Container Market - Industry Life Cycle |
3.4 Armenia Grab and Go Container Market - Porter's Five Forces |
3.5 Armenia Grab and Go Container Market Revenues & Volume Share, By Product, 2022 & 2032F |
3.6 Armenia Grab and Go Container Market Revenues & Volume Share, By Material, 2022 & 2032F |
3.7 Armenia Grab and Go Container Market Revenues & Volume Share, By End Use, 2022 & 2032F |
4 Armenia Grab and Go Container Market Dynamics |
4.1 Impact Analysis |
4.2 Market Drivers |
4.2.1 Increasing urbanization and busy lifestyles leading to a higher demand for convenient and quick food options |
4.2.2 Growing awareness about reducing food waste and the environmental benefits of using grab and go containers |
4.2.3 Government initiatives promoting sustainable practices and reducing single-use plastics |
4.3 Market Restraints |
4.3.1 High initial cost of purchasing grab and go containers for businesses |
4.3.2 Limited consumer awareness and adoption of reusable containers in Armenia |
4.3.3 Lack of infrastructure and facilities to support the grab and go container market |
5 Armenia Grab and Go Container Market Trends |
6 Armenia Grab and Go Container Market, By Types |
6.1 Armenia Grab and Go Container Market, By Product |
6.1.1 Overview and Analysis |
6.1.2 Armenia Grab and Go Container Market Revenues & Volume, By Product, 2022-2032F |
6.1.3 Armenia Grab and Go Container Market Revenues & Volume, By Cups, 2022-2032F |
6.1.4 Armenia Grab and Go Container Market Revenues & Volume, By Bowls, 2022-2032F |
6.1.5 Armenia Grab and Go Container Market Revenues & Volume, By Cans, 2022-2032F |
6.1.6 Armenia Grab and Go Container Market Revenues & Volume, By Trays, 2022-2032F |
6.1.7 Armenia Grab and Go Container Market Revenues & Volume, By Bottles, 2022-2032F |
6.1.8 Armenia Grab and Go Container Market Revenues & Volume, By Deli Containers, 2022-2032F |
6.2 Armenia Grab and Go Container Market, By Material |
6.2.1 Overview and Analysis |
6.2.2 Armenia Grab and Go Container Market Revenues & Volume, By Plastic, 2022-2032F |
6.2.3 Armenia Grab and Go Container Market Revenues & Volume, By PET, 2022-2032F |
6.2.4 Armenia Grab and Go Container Market Revenues & Volume, By PE, 2022-2032F |
6.2.5 Armenia Grab and Go Container Market Revenues & Volume, By PVC, 2022-2032F |
6.2.6 Armenia Grab and Go Container Market Revenues & Volume, By Paper, 2022-2032F |
6.2.7 Armenia Grab and Go Container Market Revenues & Volume, By Others, 2022-2032F |
6.3 Armenia Grab and Go Container Market, By End Use |
6.3.1 Overview and Analysis |
6.3.2 Armenia Grab and Go Container Market Revenues & Volume, By B2B, 2022-2032F |
6.3.3 Armenia Grab and Go Container Market Revenues & Volume, By Food Service Outlets, 2022-2032F |
6.3.4 Armenia Grab and Go Container Market Revenues & Volume, By Educational Institutes, 2022-2032F |
6.3.5 Armenia Grab and Go Container Market Revenues & Volume, By Corporate Offices, 2022-2032F |
6.3.6 Armenia Grab and Go Container Market Revenues & Volume, By Healthcare Facilities, 2022-2032F |
6.3.7 Armenia Grab and Go Container Market Revenues & Volume, By B2C (Retail), 2022-2032F |
6.3.8 Armenia Grab and Go Container Market Revenues & Volume, By Supermarket, 2022-2032F |
6.3.9 Armenia Grab and Go Container Market Revenues & Volume, By Supermarket, 2022-2032F |
7 Armenia Grab and Go Container Market Import-Export Trade Statistics |
7.1 Armenia Grab and Go Container Market Export to Major Countries |
7.2 Armenia Grab and Go Container Market Imports from Major Countries |
8 Armenia Grab and Go Container Market Key Performance Indicators |
8.1 Percentage increase in the number of businesses offering grab and go container options |
8.2 Growth in the number of refill stations and collection points for grab and go containers |
8.3 Reduction in single-use plastic waste through the use of grab and go containers |
8.4 Increase in customer satisfaction and repeat purchases due to the availability of grab and go container options |
8.5 Improvement in overall carbon footprint and environmental impact of businesses using grab and go containers |
9 Armenia Grab and Go Container Market - Opportunity Assessment |
9.1 Armenia Grab and Go Container Market Opportunity Assessment, By Product, 2022 & 2032F |
9.2 Armenia Grab and Go Container Market Opportunity Assessment, By Material, 2022 & 2032F |
9.3 Armenia Grab and Go Container Market Opportunity Assessment, By End Use, 2022 & 2032F |
10 Armenia Grab and Go Container Market - Competitive Landscape |
10.1 Armenia Grab and Go Container Market Revenue Share, By Companies, 2025 |
10.2 Armenia Grab and Go Container Market Competitive Benchmarking, By Operating and Technical Parameters |
11 Company Profiles |
12 Recommendations |
13 Disclaimer |
Export potential assessment - trade Analytics for 2030
Export potential enables firms to identify high-growth global markets with greater confidence by combining advanced trade intelligence with a structured quantitative methodology. The framework analyzes emerging demand trends and country-level import patterns while integrating macroeconomic and trade datasets such as GDP and population forecasts, bilateral import–export flows, tariff structures, elasticity differentials between developed and developing economies, geographic distance, and import demand projections. Using weighted trade values from 2020–2024 as the base period to project country-to-country export potential for 2030, these inputs are operationalized through calculated drivers such as gravity model parameters, tariff impact factors, and projected GDP per-capita growth. Through an analysis of hidden potentials, demand hotspots, and market conditions that are most favorable to success, this method enables firms to focus on target countries, maximize returns, and global expansion with data, backed by accuracy.
By factoring in the projected importer demand gap that is currently unmet and could be potential opportunity, it identifies the potential for the Exporter (Country) among 190 countries, against the general trade analysis, which identifies the biggest importer or exporter.
To discover high-growth global markets and optimize your business strategy:
Click Here
Pricing
- Single User License$ 1,995
- Department License$ 2,400
- Site License$ 3,120
- Global License$ 3,795

Search
Thought Leadership and Analyst Meet


Our Clients
Latest Reports
- China Electric Appliance Rental Market (2026-2032) | Trends, Revenue, Growth, Challenges, Size, Value, Outlook, Pricing, Strategy, Insights, Restraints, segmentation, Companies, Investment Opportunities, Analysis, Demand, Drivers, Competition, Forecast, Share
- Chile Electric Appliance Rental Market (2026-2032) | Outlook, Competition, Drivers, Strategy, Revenue, Analysis, Value, Pricing, Restraints, Size, Demand, Share, Growth, Forecast, Challenges, Insights, Investment Opportunities, Companies, Trends, segmentation
- Cambodia Electric Appliance Rental Market (2026-2032) | Companies, Analysis, Restraints, Pricing, Insights, Challenges, Outlook, Strategy, Forecast, Trends, Competition, Value, Revenue, Investment Opportunities, segmentation, Drivers, Size, Demand, Growth, Share
- Brazil Electric Appliance Rental Market (2026-2032) | Revenue, Strategy, Forecast, Companies, segmentation, Competition, Size, Investment Opportunities, Pricing, Restraints, Outlook, Challenges, Analysis, Drivers, Value, Demand, Insights, Trends, Growth, Share
- Bangladesh Electric Appliance Rental Market (2026-2032) | Drivers, Forecast, Investment Opportunities, Strategy, Insights, Demand, Challenges, Outlook, Trends, Competition, Value, Revenue, Size, Pricing, Analysis, Companies, Restraints, segmentation, Share, Growth
- Bahrain Electric Appliance Rental Market (2026-2032) | Outlook, Size, Competition, Restraints, Drivers, Value, Trends, Investment Opportunities, Insights, Forecast, Revenue, Strategy, Growth, Share, Demand, Analysis, Challenges, Companies, segmentation, Pricing
- Azerbaijan Electric Appliance Rental Market (2026-2032) | Trends, Investment Opportunities, Restraints, Insights, Strategy, Competition, Value, Growth, Demand, Drivers, Analysis, Forecast, Size, Share, Outlook, segmentation, Pricing, Challenges, Revenue, Companies
- Australia Electric Appliance Rental Market (2026-2032) | Challenges, Restraints, Forecast, Demand, Size, Competition, Pricing, Investment Opportunities, Revenue, Trends, Drivers, Growth, Outlook, Analysis, Strategy, Value, segmentation, Insights, Companies, Share
- Argentina Electric Appliance Rental Market (2026-2032) | Growth, Trends, Insights, Outlook, Forecast, Size, Drivers, Analysis, Restraints, Challenges, Share, Revenue, Investment Opportunities, Strategy, Demand, Value, Companies, segmentation, Competition, Pricing
- Algeria Electric Appliance Rental Market (2026-2032) | Share, Size, Value, Strategy, Competition, Outlook, Challenges, Companies, Trends, Pricing, Insights, Forecast, Investment Opportunities, Revenue, Growth, Restraints, segmentation, Analysis, Demand, Drivers
Industry Events and Analyst Meet

HIMTEX 2026

India Refining Summit 2026

India EV Show 2026

EV tech India Expo 2026

Auto Tech Asia 2026
Whitepaper
- Middle East & Africa Commercial Security Market Click here to view more.
- Middle East & Africa Fire Safety Systems & Equipment Market Click here to view more.
- GCC Drone Market Click here to view more.
- Middle East Lighting Fixture Market Click here to view more.
- GCC Physical & Perimeter Security Market Click here to view more.
6WResearch In News
- Doha a strategic location for EV manufacturing hub: IPA Qatar
- Demand for luxury TVs surging in the GCC, says Samsung
- Empowering Growth: The Thriving Journey of Bangladesh’s Cable Industry
- Demand for luxury TVs surging in the GCC, says Samsung
- Video call with a traditional healer? Once unthinkable, it’s now common in South Africa
- Intelligent Buildings To Smooth GCC’s Path To Net Zero