Australia Bee Products Market (2025 - 2031) | Industry, Trends, Forecast, Revenue, Size, Growth, Value, Analysis, Share, Outlook, Companies & COVID-19 IMPACT
Market Forecast By Product Type (Propolis, Honey, Others), By Application (Food Industry, Cosmetic Industry, Pharmaceutical Industry, Others) And Competitive Landscape
| Product Code: ETC170034 | Publication Date: Jan 2022 | Updated Date: Jan 2026 | Product Type: Market Research Report | |
| Publisher: 6Wresearch | Author: Ravi Bhandari | No. of Pages: 70 | No. of Figures: 35 | No. of Tables: 5 |
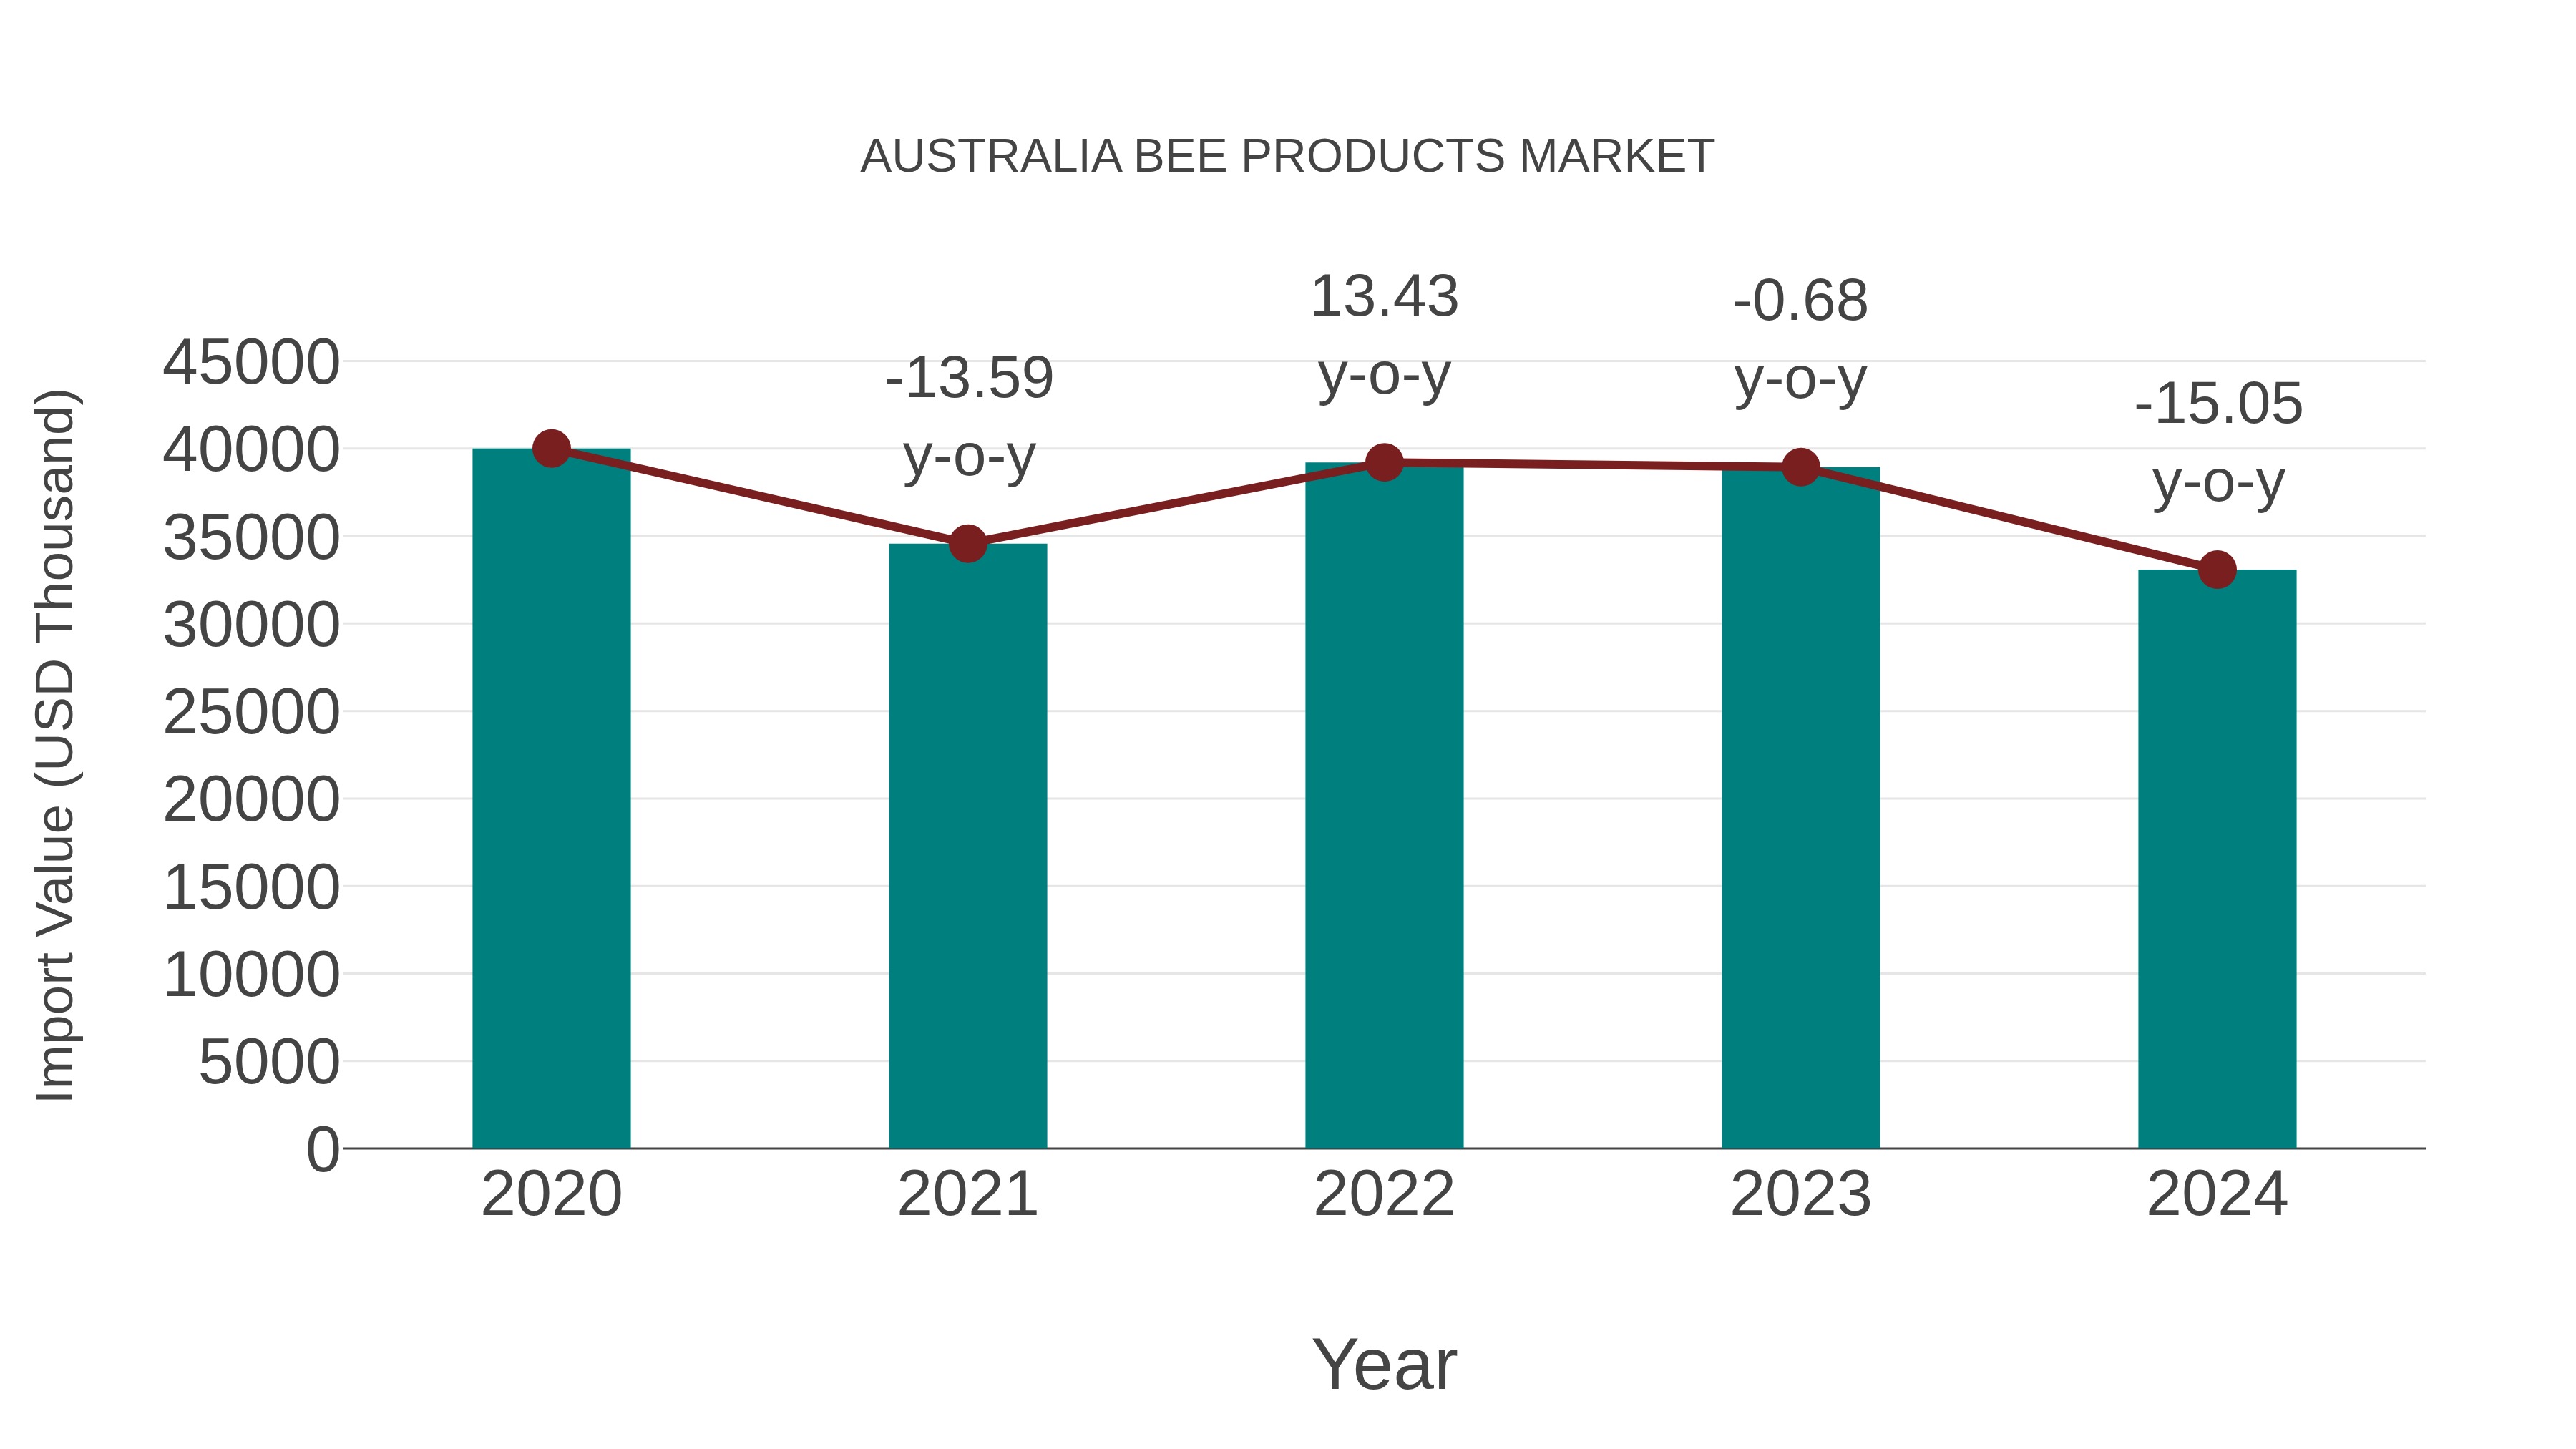
Australia Bee Products Market: Import Trend Analysis
In the Australia bee products market, the import trend experienced a decline with a growth rate of -15.05% from 2023 to 2024. The compound annual growth rate (CAGR) for the period 2020-2024 stood at -4.64%. This negative import momentum could be attributed to shifts in consumer preferences or changes in trade policies impacting market stability.
Australia Bee Products Market Overview
Australia bee products market encompasses honey, beeswax, propolis, royal jelly, and bee pollen, produced by honeybees for food, health, and skincare applications. Bee products offer nutritional, medicinal, and cosmetic benefits, driving their consumption among consumers, health enthusiasts, and beauty brands.
Drivers of the market
The Australia bee products market is witnessing substantial growth, driven by various factors. One significant driver is the increasing consumer awareness of the health benefits associated with bee-derived products such as honey, propolis, royal jelly, and bee pollen. These products are recognized for their nutritional value, antioxidant properties, and potential therapeutic benefits, leading to growing demand among health-conscious consumers. Additionally, the rise in natural and organic food trends contributes to the popularity of bee products as alternatives to conventional sweeteners and supplements. Moreover, the expansion of beekeeping activities and the adoption of sustainable beekeeping practices ensure a steady supply of high-quality bee products in the market. Furthermore, the growing use of bee products in the food, cosmetics, and pharmaceutical industries drives market growth, supported by product innovation and marketing initiatives aimed at highlighting their unique properties and applications.
Challenges of the market
Ensuring product purity and addressing concerns regarding bee population decline are challenges in the Australia bee products market. Adapting to changing consumer preferences for natural remedies and addressing competition from synthetic alternatives pose ongoing challenges for beekeepers and product manufacturers.
Government Policy of the market
Australia bee products market includes honey, beeswax, royal jelly, propolis, and bee pollen, sourced from local beekeepers. Government regulations ensure the safety, quality, and authenticity of bee products, including standards for production, labeling, and hygiene. Compliance with these regulations is essential for market participants to maintain consumer trust and meet industry standards. Additionally, government initiatives promoting sustainable beekeeping practices, biodiversity conservation, and honeybee health may influence market dynamics in the Australia bee products market, driving demand for natural and ethically sourced bee products.
Key Highlights of the Report:
- Australia Bee Products Market Outlook
- Market Size of Australia Bee Products Market, 2024
- Forecast of Australia Bee Products Market, 2031
- Historical Data and Forecast of Australia Bee Products Revenues & Volume for the Period 2021-2031
- Australia Bee Products Market Trend Evolution
- Australia Bee Products Market Drivers and Challenges
- Australia Bee Products Price Trends
- Australia Bee Products Porter's Five Forces
- Australia Bee Products Industry Life Cycle
- Historical Data and Forecast of Australia Bee Products Market Revenues & Volume By Product Type for the Period 2021-2031
- Historical Data and Forecast of Australia Bee Products Market Revenues & Volume By Propolis for the Period 2021-2031
- Historical Data and Forecast of Australia Bee Products Market Revenues & Volume By Honey for the Period 2021-2031
- Historical Data and Forecast of Australia Bee Products Market Revenues & Volume By Others for the Period 2021-2031
- Historical Data and Forecast of Australia Bee Products Market Revenues & Volume By Application for the Period 2021-2031
- Historical Data and Forecast of Australia Bee Products Market Revenues & Volume By Food Industry for the Period 2021-2031
- Historical Data and Forecast of Australia Bee Products Market Revenues & Volume By Cosmetic Industry for the Period 2021-2031
- Historical Data and Forecast of Australia Bee Products Market Revenues & Volume By Pharmaceutical Industry for the Period 2021-2031
- Historical Data and Forecast of Australia Bee Products Market Revenues & Volume By Others for the Period 2021-2031
- Australia Bee Products Import Export Trade Statistics
- Market Opportunity Assessment By Product Type
- Market Opportunity Assessment By Application
- Australia Bee Products Top Companies Market Share
- Australia Bee Products Competitive Benchmarking By Technical and Operational Parameters
- Australia Bee Products Company Profiles
- Australia Bee Products Key Strategic Recommendations
Frequently Asked Questions About the Market Study (FAQs):
6Wresearch actively monitors the Australia Bee Products Market and publishes its comprehensive annual report, highlighting emerging trends, growth drivers, revenue analysis, and forecast outlook. Our insights help businesses to make data-backed strategic decisions with ongoing market dynamics. Our analysts track relevent industries related to the Australia Bee Products Market, allowing our clients with actionable intelligence and reliable forecasts tailored to emerging regional needs.
Yes, we provide customisation as per your requirements. To learn more, feel free to contact us on sales@6wresearch.com
1 Executive Summary |
2 Introduction |
2.1 Key Highlights of the Report |
2.2 Report Description |
2.3 Market Scope & Segmentation |
2.4 Research Methodology |
2.5 Assumptions |
3 Australia Bee Products Market Overview |
3.1 Australia Country Macro Economic Indicators |
3.2 Australia Bee Products Market Revenues & Volume, 2021 & 2031F |
3.3 Australia Bee Products Market - Industry Life Cycle |
3.4 Australia Bee Products Market - Porter's Five Forces |
3.5 Australia Bee Products Market Revenues & Volume Share, By Product Type, 2021 & 2031F |
3.6 Australia Bee Products Market Revenues & Volume Share, By Application, 2021 & 2031F |
4 Australia Bee Products Market Dynamics |
4.1 Impact Analysis |
4.2 Market Drivers |
4.2.1 Growing consumer awareness and demand for natural and organic products |
4.2.2 Increasing focus on health and wellness trends |
4.2.3 Rising popularity of alternative medicine and natural remedies |
4.3 Market Restraints |
4.3.1 Seasonal variations and environmental factors affecting bee product production |
4.3.2 Regulatory challenges and compliance requirements |
4.3.3 Competition from synthetic alternatives and other natural health products |
5 Australia Bee Products Market Trends |
6 Australia Bee Products Market, By Types |
6.1 Australia Bee Products Market, By Product Type |
6.1.1 Overview and Analysis |
6.1.2 Australia Bee Products Market Revenues & Volume, By Product Type, 2021-2031F |
6.1.3 Australia Bee Products Market Revenues & Volume, By Propolis, 2021-2031F |
6.1.4 Australia Bee Products Market Revenues & Volume, By Honey, 2021-2031F |
6.1.5 Australia Bee Products Market Revenues & Volume, By Others, 2021-2031F |
6.2 Australia Bee Products Market, By Application |
6.2.1 Overview and Analysis |
6.2.2 Australia Bee Products Market Revenues & Volume, By Food Industry, 2021-2031F |
6.2.3 Australia Bee Products Market Revenues & Volume, By Cosmetic Industry, 2021-2031F |
6.2.4 Australia Bee Products Market Revenues & Volume, By Pharmaceutical Industry, 2021-2031F |
6.2.5 Australia Bee Products Market Revenues & Volume, By Others, 2021-2031F |
7 Australia Bee Products Market Import-Export Trade Statistics |
7.1 Australia Bee Products Market Export to Major Countries |
7.2 Australia Bee Products Market Imports from Major Countries |
8 Australia Bee Products Market Key Performance Indicators |
8.1 Number of new bee products launched in the market |
8.2 Consumer satisfaction and repeat purchase rates |
8.3 Percentage of market share held by Australian bee products compared to imports |
8.4 Number of research studies highlighting the benefits of bee products |
8.5 Adoption rate of bee products in mainstream retail channels |
9 Australia Bee Products Market - Opportunity Assessment |
9.1 Australia Bee Products Market Opportunity Assessment, By Product Type, 2021 & 2031F |
9.2 Australia Bee Products Market Opportunity Assessment, By Application, 2021 & 2031F |
10 Australia Bee Products Market - Competitive Landscape |
10.1 Australia Bee Products Market Revenue Share, By Companies, 2024 |
10.2 Australia Bee Products Market Competitive Benchmarking, By Operating and Technical Parameters |
11 Company Profiles |
12 Recommendations |
13 Disclaimer |
Export potential assessment - trade Analytics for 2030
Export potential enables firms to identify high-growth global markets with greater confidence by combining advanced trade intelligence with a structured quantitative methodology. The framework analyzes emerging demand trends and country-level import patterns while integrating macroeconomic and trade datasets such as GDP and population forecasts, bilateral import–export flows, tariff structures, elasticity differentials between developed and developing economies, geographic distance, and import demand projections. Using weighted trade values from 2020–2024 as the base period to project country-to-country export potential for 2030, these inputs are operationalized through calculated drivers such as gravity model parameters, tariff impact factors, and projected GDP per-capita growth. Through an analysis of hidden potentials, demand hotspots, and market conditions that are most favorable to success, this method enables firms to focus on target countries, maximize returns, and global expansion with data, backed by accuracy.
By factoring in the projected importer demand gap that is currently unmet and could be potential opportunity, it identifies the potential for the Exporter (Country) among 190 countries, against the general trade analysis, which identifies the biggest importer or exporter.
To discover high-growth global markets and optimize your business strategy:
Click Here
Pricing
- Single User License$ 1,995
- Department License$ 2,400
- Site License$ 3,120
- Global License$ 3,795

Search
Thought Leadership and Analyst Meet


Our Clients
Related Reports
- India Switchgear Market Outlook (2026 - 2032) | Size, Share, Trends, Growth, Revenue, Forecast, Analysis, Value, Outlook
- Pakistan Contraceptive Implants Market (2025-2031) | Demand, Growth, Size, Share, Industry, Pricing Analysis, Competitive, Strategic Insights, Strategy, Consumer Insights, Analysis, Investment Trends, Opportunities, Revenue, Segments, Value, Segmentation, Supply, Forecast, Restraints, Outlook, Competition, Drivers, Trends, Companies, Challenges
- Sri Lanka Packaging Market (2026-2032) | Outlook, Competition, Drivers, Trends, Demand, Pricing Analysis, Competitive, Strategic Insights, Companies, Challenges, Strategy, Consumer Insights, Analysis, Investment Trends, Opportunities, Growth, Size, Share, Industry, Revenue, Segments, Value, Segmentation, Supply, Forecast, Restraints
- India Kids Watches Market (2026-2032) | Strategy, Consumer Insights, Analysis, Investment Trends, Opportunities, Growth, Size, Share, Industry, Revenue, Segments, Value, Segmentation, Supply, Forecast, Restraints, Outlook, Competition, Drivers, Trends, Demand, Pricing Analysis, Competitive, Strategic Insights, Companies, Challenges
- Saudi Arabia Core Assurance Service Market (2025-2031) | Strategy, Consumer Insights, Analysis, Investment Trends, Opportunities, Growth, Size, Share, Industry, Revenue, Segments, Value, Segmentation, Supply, Forecast, Restraints, Outlook, Competition, Drivers, Trends, Demand, Pricing Analysis, Competitive, Strategic Insights, Companies, Challenges
- Romania Uninterruptible Power Supply (UPS) Market (2026-2032) | Industry, Analysis, Revenue, Size, Forecast, Outlook, Value, Trends, Share, Growth & Companies
- Saudi Arabia Car Window Tinting Film, Paint Protection Film (PPF), and Ceramic Coating Market (2025-2031) | Strategy, Consumer Insights, Analysis, Investment Trends, Opportunities, Growth, Size, Share, Industry, Revenue, Segments, Value, Segmentation, Supply, Forecast, Restraints, Outlook, Competition, Drivers, Trends, Demand, Pricing Analysis, Competitive, Strategic Insights, Companies, Challenges
- South Africa Stationery Market (2025-2031) | Share, Size, Industry, Value, Growth, Revenue, Analysis, Trends, Segmentation & Outlook
- Afghanistan Rocking Chairs And Adirondack Chairs Market (2026-2032) | Size & Revenue, Competitive Landscape, Share, Segmentation, Industry, Value, Outlook, Analysis, Trends, Growth, Forecast, Companies
- Afghanistan Apparel Market (2026-2032) | Growth, Outlook, Industry, Segmentation, Forecast, Size, Companies, Trends, Value, Share, Analysis & Revenue
Industry Events and Analyst Meet

EV tech India Expo 2026

Auto Tech Asia 2026

Battery Tech India 2026

Smart Production Solutions Guangzhou 2026

Stationery & Paper Expo Saudi Arabia 2026
Whitepaper
- Middle East & Africa Commercial Security Market Click here to view more.
- Middle East & Africa Fire Safety Systems & Equipment Market Click here to view more.
- GCC Drone Market Click here to view more.
- Middle East Lighting Fixture Market Click here to view more.
- GCC Physical & Perimeter Security Market Click here to view more.
6WResearch In News
- Doha a strategic location for EV manufacturing hub: IPA Qatar
- Demand for luxury TVs surging in the GCC, says Samsung
- Empowering Growth: The Thriving Journey of Bangladesh’s Cable Industry
- Demand for luxury TVs surging in the GCC, says Samsung
- Video call with a traditional healer? Once unthinkable, it’s now common in South Africa
- Intelligent Buildings To Smooth GCC’s Path To Net Zero