Australia Beverage Flavoring Systems Market (2026-2032) Outlook | Share, Industry, Analysis, Size, Companies, Revenue, Value, Growth, Forecast & Trends
Market Forecast By Ingredient (Flavorings, Carriers, Enhancers), By Type (Browns, Dairy, Botanicals, Fruits), By Origin (Natural, Artificial, Nature-identical), By Form (Dry, Liquid), By Origin (Natural, Artificial, Nature-identical) And Competitive Landscape
| Product Code: ETC4542936 | Publication Date: Jul 2023 | Updated Date: Mar 2026 | Product Type: Report | |
| Publisher: 6Wresearch | Author: Summon Dutta | No. of Pages: 85 | No. of Figures: 45 | No. of Tables: 25 |
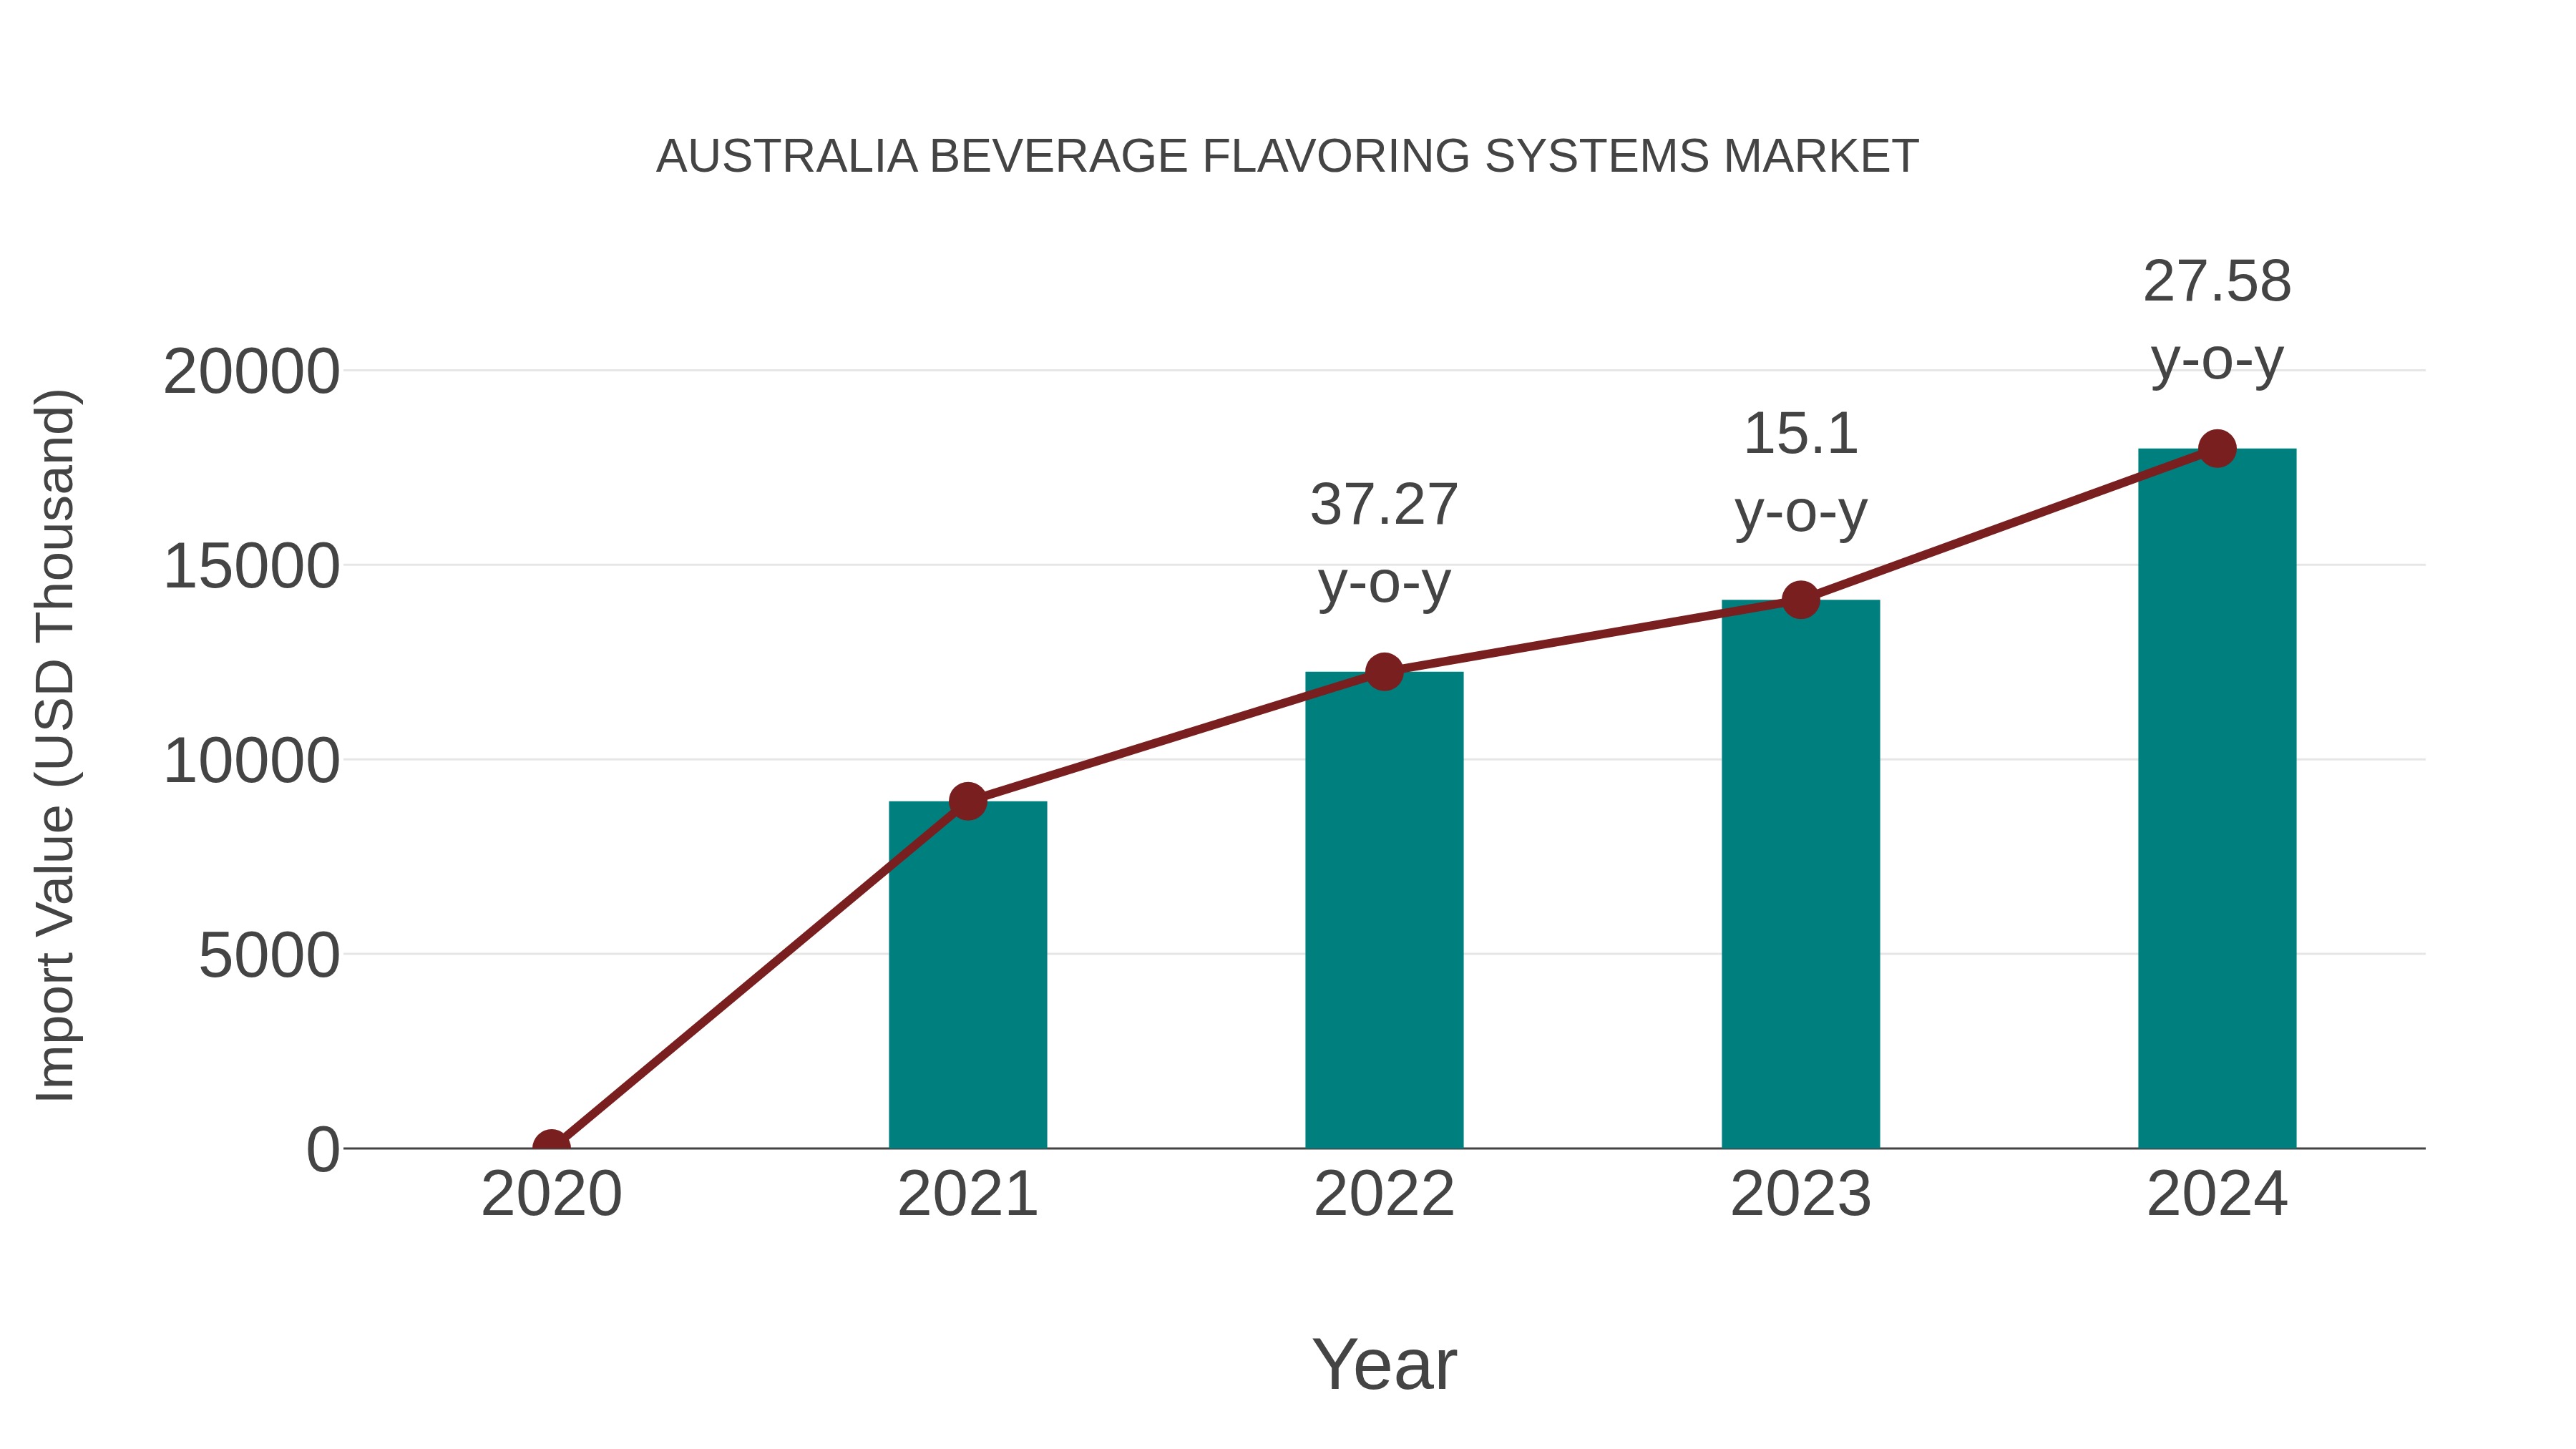
Australia Beverage Flavoring Systems Market: Import Trend Analysis
In the Australia beverage flavoring systems market, the import trend exhibited significant growth from 2023 to 2024, with a growth rate of 27.58%. The compound annual growth rate (CAGR) for the period 2020-2024 stood at 26.32%. This surge in imports can be attributed to a notable shift in consumer preferences towards innovative and diverse flavor profiles, driving increased demand for imported beverage flavoring systems in the Australian market.
Australia Beverage Flavoring Systems Market Overview
Australia beverage flavoring systems market is growing with increasing demand for flavored beverages and consumer preferences for diverse taste experiences. Beverage flavoring systems offer natural and artificial flavors for enhancing the taste, aroma, and appeal of soft drinks, teas, and flavored waters, driving innovation and product differentiation in the beverage industry.
Drivers of the market
The Australia Beverage Flavoring Systems market witnesses growth driven by the evolving consumer preferences for diverse and unique beverage flavors, coupled with the demand for natural and clean-label ingredients. Flavoring systems enable beverage manufacturers to create a wide range of flavor profiles, including fruit, botanical, and savory notes, to meet changing consumer tastes. Moreover, advancements in flavor encapsulation techniques and ingredient sourcing enhance the stability and authenticity of flavoring systems, contributing to their widespread adoption. Additionally, collaborations between flavor suppliers and beverage companies to develop innovative flavor formulations further stimulate market growth.
Challenges of the market
Ensuring flavor consistency and addressing concerns regarding artificial additives are challenges in the Australia beverage flavoring systems market. Adapting to changes in consumer preferences for natural and clean-label ingredients and meeting regulatory standards for food additives are ongoing challenges for beverage flavoring system manufacturers.
Government Policy of the market
Australia beverage flavoring systems market provides ingredients and additives used to enhance the taste, aroma, and visual appeal of beverages. Government regulations ensure the safety, quality, and permissible usage levels of flavoring systems, including standards for food additives, labeling requirements, and consumer protection. Compliance with these regulations is essential for flavor manufacturers and beverage producers to maintain product safety and meet regulatory requirements. Additionally, government initiatives promoting healthy eating, clean label trends, and consumer preference for natural ingredients may influence market dynamics in the Australia beverage flavoring systems market, driving demand for natural and innovative flavor solutions.
Key Highlights of the Report:
- Australia Beverage Flavoring Systems Market Outlook
- Market Size of Australia Beverage Flavoring Systems Market, 2025
- Forecast of Australia Beverage Flavoring Systems Market, 2032
- Historical Data and Forecast of Australia Beverage Flavoring Systems Revenues & Volume for the Period 2022-2032F
- Australia Beverage Flavoring Systems Market Trend Evolution
- Australia Beverage Flavoring Systems Market Drivers and Challenges
- Australia Beverage Flavoring Systems Price Trends
- Australia Beverage Flavoring Systems Porter's Five Forces
- Australia Beverage Flavoring Systems Industry Life Cycle
- Historical Data and Forecast of Australia Beverage Flavoring Systems Market Revenues & Volume By Ingredient for the Period 2022-2032F
- Historical Data and Forecast of Australia Beverage Flavoring Systems Market Revenues & Volume By Flavorings for the Period 2022-2032F
- Historical Data and Forecast of Australia Beverage Flavoring Systems Market Revenues & Volume By Carriers for the Period 2022-2032F
- Historical Data and Forecast of Australia Beverage Flavoring Systems Market Revenues & Volume By Enhancers for the Period 2022-2032F
- Historical Data and Forecast of Australia Beverage Flavoring Systems Market Revenues & Volume By Type for the Period 2022-2032F
- Historical Data and Forecast of Australia Beverage Flavoring Systems Market Revenues & Volume By Browns for the Period 2022-2032F
- Historical Data and Forecast of Australia Beverage Flavoring Systems Market Revenues & Volume By Dairy for the Period 2022-2032F
- Historical Data and Forecast of Australia Beverage Flavoring Systems Market Revenues & Volume By Botanicals for the Period 2022-2032F
- Historical Data and Forecast of Australia Beverage Flavoring Systems Market Revenues & Volume By Fruits for the Period 2022-2032F
- Historical Data and Forecast of Australia Beverage Flavoring Systems Market Revenues & Volume By Origin for the Period 2022-2032F
- Historical Data and Forecast of Australia Beverage Flavoring Systems Market Revenues & Volume By Natural for the Period 2022-2032F
- Historical Data and Forecast of Australia Beverage Flavoring Systems Market Revenues & Volume By Artificial for the Period 2022-2032F
- Historical Data and Forecast of Australia Beverage Flavoring Systems Market Revenues & Volume By Nature-identical for the Period 2022-2032F
- Historical Data and Forecast of Australia Beverage Flavoring Systems Market Revenues & Volume By Form for the Period 2022-2032F
- Historical Data and Forecast of Australia Beverage Flavoring Systems Market Revenues & Volume By Dry for the Period 2022-2032F
- Historical Data and Forecast of Australia Beverage Flavoring Systems Market Revenues & Volume By Liquid for the Period 2022-2032F
- Historical Data and Forecast of Australia Beverage Flavoring Systems Market Revenues & Volume By Origin for the Period 2022-2032F
- Historical Data and Forecast of Australia Beverage Flavoring Systems Market Revenues & Volume By Natural for the Period 2022-2032F
- Historical Data and Forecast of Australia Beverage Flavoring Systems Market Revenues & Volume By Artificial for the Period 2022-2032F
- Historical Data and Forecast of Australia Beverage Flavoring Systems Market Revenues & Volume By Nature-identical for the Period 2022-2032F
- Australia Beverage Flavoring Systems Import Export Trade Statistics
- Market Opportunity Assessment By Ingredient
- Market Opportunity Assessment By Type
- Market Opportunity Assessment By Origin
- Market Opportunity Assessment By Form
- Market Opportunity Assessment By Origin
- Australia Beverage Flavoring Systems Top Companies Market Share
- Australia Beverage Flavoring Systems Competitive Benchmarking By Technical and Operational Parameters
- Australia Beverage Flavoring Systems Company Profiles
- Australia Beverage Flavoring Systems Key Strategic Recommendations
Australia Beverage Flavoring Systems Market (2026-2032): FAQs
6Wresearch actively monitors the Australia Beverage Flavoring Systems Market and publishes its comprehensive annual report, highlighting emerging trends, growth drivers, revenue analysis, and forecast outlook. Our insights help businesses to make data-backed strategic decisions with ongoing market dynamics. Our analysts track relevent industries related to the Australia Beverage Flavoring Systems Market, allowing our clients with actionable intelligence and reliable forecasts tailored to emerging regional needs.
Yes, we provide customisation as per your requirements. To learn more, feel free to contact us on sales@6wresearch.com
1 Executive Summary |
2 Introduction |
2.1 Key Highlights of the Report |
2.2 Report Description |
2.3 Market Scope & Segmentation |
2.4 Research Methodology |
2.5 Assumptions |
3 Australia Beverage Flavoring Systems Market Overview |
3.1 Australia Country Macro Economic Indicators |
3.2 Australia Beverage Flavoring Systems Market Revenues & Volume, 2022 & 2032F |
3.3 Australia Beverage Flavoring Systems Market - Industry Life Cycle |
3.4 Australia Beverage Flavoring Systems Market - Porter's Five Forces |
3.5 Australia Beverage Flavoring Systems Market Revenues & Volume Share, By Ingredient, 2022 & 2032F |
3.6 Australia Beverage Flavoring Systems Market Revenues & Volume Share, By Type, 2022 & 2032F |
3.7 Australia Beverage Flavoring Systems Market Revenues & Volume Share, By Origin, 2022 & 2032F |
3.8 Australia Beverage Flavoring Systems Market Revenues & Volume Share, By Form, 2022 & 2032F |
3.9 Australia Beverage Flavoring Systems Market Revenues & Volume Share, By Origin, 2022 & 2032F |
4 Australia Beverage Flavoring Systems Market Dynamics |
4.1 Impact Analysis |
4.2 Market Drivers |
4.2.1 Increasing demand for natural and clean label ingredients in beverages |
4.2.2 Growing trend of personalized and unique flavor experiences in beverages |
4.2.3 Innovation in flavoring technologies leading to a wide variety of flavor options |
4.3 Market Restraints |
4.3.1 Stringent regulations and guidelines regarding food additives and flavoring ingredients |
4.3.2 Fluctuating prices of raw materials impacting production costs |
4.3.3 Competition from substitute products such as ready-to-drink beverages |
5 Australia Beverage Flavoring Systems Market Trends |
6 Australia Beverage Flavoring Systems Market, By Types |
6.1 Australia Beverage Flavoring Systems Market, By Ingredient |
6.1.1 Overview and Analysis |
6.1.2 Australia Beverage Flavoring Systems Market Revenues & Volume, By Ingredient, 2022-2032F |
6.1.3 Australia Beverage Flavoring Systems Market Revenues & Volume, By Flavorings, 2022-2032F |
6.1.4 Australia Beverage Flavoring Systems Market Revenues & Volume, By Carriers, 2022-2032F |
6.1.5 Australia Beverage Flavoring Systems Market Revenues & Volume, By Enhancers, 2022-2032F |
6.2 Australia Beverage Flavoring Systems Market, By Type |
6.2.1 Overview and Analysis |
6.2.2 Australia Beverage Flavoring Systems Market Revenues & Volume, By Browns, 2022-2032F |
6.2.3 Australia Beverage Flavoring Systems Market Revenues & Volume, By Dairy, 2022-2032F |
6.2.4 Australia Beverage Flavoring Systems Market Revenues & Volume, By Botanicals, 2022-2032F |
6.2.5 Australia Beverage Flavoring Systems Market Revenues & Volume, By Fruits, 2022-2032F |
6.3 Australia Beverage Flavoring Systems Market, By Origin |
6.3.1 Overview and Analysis |
6.3.2 Australia Beverage Flavoring Systems Market Revenues & Volume, By Natural, 2022-2032F |
6.3.3 Australia Beverage Flavoring Systems Market Revenues & Volume, By Artificial, 2022-2032F |
6.3.4 Australia Beverage Flavoring Systems Market Revenues & Volume, By Nature-identical, 2022-2032F |
6.4 Australia Beverage Flavoring Systems Market, By Form |
6.4.1 Overview and Analysis |
6.4.2 Australia Beverage Flavoring Systems Market Revenues & Volume, By Dry, 2022-2032F |
6.4.3 Australia Beverage Flavoring Systems Market Revenues & Volume, By Liquid, 2022-2032F |
6.5 Australia Beverage Flavoring Systems Market, By Origin |
6.5.1 Overview and Analysis |
6.5.2 Australia Beverage Flavoring Systems Market Revenues & Volume, By Natural, 2022-2032F |
6.5.3 Australia Beverage Flavoring Systems Market Revenues & Volume, By Artificial, 2022-2032F |
6.5.4 Australia Beverage Flavoring Systems Market Revenues & Volume, By Nature-identical, 2022-2032F |
7 Australia Beverage Flavoring Systems Market Import-Export Trade Statistics |
7.1 Australia Beverage Flavoring Systems Market Export to Major Countries |
7.2 Australia Beverage Flavoring Systems Market Imports from Major Countries |
8 Australia Beverage Flavoring Systems Market Key Performance Indicators |
8.1 Consumer engagement with new flavor launches |
8.2 Adoption rate of innovative flavoring technologies in the market |
8.3 Percentage of market share held by natural and clean label flavoring systems |
9 Australia Beverage Flavoring Systems Market - Opportunity Assessment |
9.1 Australia Beverage Flavoring Systems Market Opportunity Assessment, By Ingredient, 2022 & 2032F |
9.2 Australia Beverage Flavoring Systems Market Opportunity Assessment, By Type, 2022 & 2032F |
9.3 Australia Beverage Flavoring Systems Market Opportunity Assessment, By Origin, 2022 & 2032F |
9.4 Australia Beverage Flavoring Systems Market Opportunity Assessment, By Form, 2022 & 2032F |
9.5 Australia Beverage Flavoring Systems Market Opportunity Assessment, By Origin, 2022 & 2032F |
10 Australia Beverage Flavoring Systems Market - Competitive Landscape |
10.1 Australia Beverage Flavoring Systems Market Revenue Share, By Companies, 2025 |
10.2 Australia Beverage Flavoring Systems Market Competitive Benchmarking, By Operating and Technical Parameters |
11 Company Profiles |
12 Recommendations |
13 Disclaimer |
Global Go To Market Strategy - 2030
Export potential enables firms to identify high-growth global markets with greater confidence by combining advanced trade intelligence with a structured quantitative methodology. The framework analyzes emerging demand trends and country-level import patterns while integrating macroeconomic and trade datasets such as GDP and population forecasts, bilateral import–export flows, tariff structures, elasticity differentials between developed and developing economies, geographic distance, and import demand projections. Using weighted trade values from 2020–2024 as the base period to project country-to-country export potential for 2030, these inputs are operationalized through calculated drivers such as gravity model parameters, tariff impact factors, and projected GDP per-capita growth. Through an analysis of hidden potentials, demand hotspots, and market conditions that are most favorable to success, this method enables firms to focus on target countries, maximize returns, and global expansion with data, backed by accuracy.
By factoring in the projected importer demand gap that is currently unmet and could be potential opportunity, it identifies the potential for the Exporter (Country) among 190 countries, against the general trade analysis, which identifies the biggest importer or exporter.
To discover high-growth global markets and optimize your business strategy:
Click Here
Pricing
- Single User License$ 1,995
- Department License$ 2,400
- Site License$ 3,120
- Global License$ 3,795

Leadership Perspectives from Industry Events
Search
Thought Leadership and Analyst Meet


Our Clients
6WResearch In News
- India Air Conditioner Market Set for Strong Rebound in 2026 After Weather-Led Correction and GST-Driven Recovery: 6Wresearch
- ADAS in India: How Automatic Emergency Braking, Blind Spot Detection & Driver Monitoring are Transforming Road Safety
- Doha a strategic location for EV manufacturing hub: IPA Qatar
- Demand for luxury TVs surging in the GCC, says Samsung
- Empowering Growth: The Thriving Journey of Bangladesh’s Cable Industry
- Demand for luxury TVs surging in the GCC, says Samsung
Latest Reports
- Poland Fire Protection Systems Market (2026-2032)
- Cape Verde Portable Hand-Thrown Extinguisher Market (2026-2032)
- Canada Portable Hand-Thrown Extinguisher Market (2026-2032)
- Cameroon Portable Hand-Thrown Extinguisher Market (2026-2032)
- Burundi Portable Hand-Thrown Extinguisher Market (2026-2032)
- Burkina Faso Portable Hand-Thrown Extinguisher Market (2026-2032)
- Bulgaria Portable Hand-Thrown Extinguisher Market (2026-2032)
- Brunei Portable Hand-Thrown Extinguisher Market (2026-2032)
- Botswana Portable Hand-Thrown Extinguisher Market (2026-2032)
- Bosnia and Herzegovina Portable Hand-Thrown Extinguisher Market (2026-2032)
Industry Events and Analyst Meet

HIMTEX 2026

India Refining Summit 2026

India EV Show 2026

EV tech India Expo 2026

Auto Tech Asia 2026
Whitepaper
- Middle East & Africa Commercial Security Market Click here to view more.
- Middle East & Africa Fire Safety Systems & Equipment Market Click here to view more.
- GCC Drone Market Click here to view more.
- Middle East Lighting Fixture Market Click here to view more.
- GCC Physical & Perimeter Security Market Click here to view more.