Australia Casein Market Outlook | Revenue, Companies, Size, Trends, Industry, Growth, Share, Value, Analysis, Forecast & COVID-19 IMPACT
Market Forecast By Product Type (Acid Casein, Rennet Casein), By End-users (Food andBeverages, Pharmaceuticals, Cosmetics, Industrial, Others) And Competitive Landscape
| Product Code: ETC089754 | Publication Date: Jun 2021 | Updated Date: Mar 2026 | Product Type: Report | |
| Publisher: 6Wresearch | Author: Ravi Bhandari | No. of Pages: 70 | No. of Figures: 35 | No. of Tables: 5 |
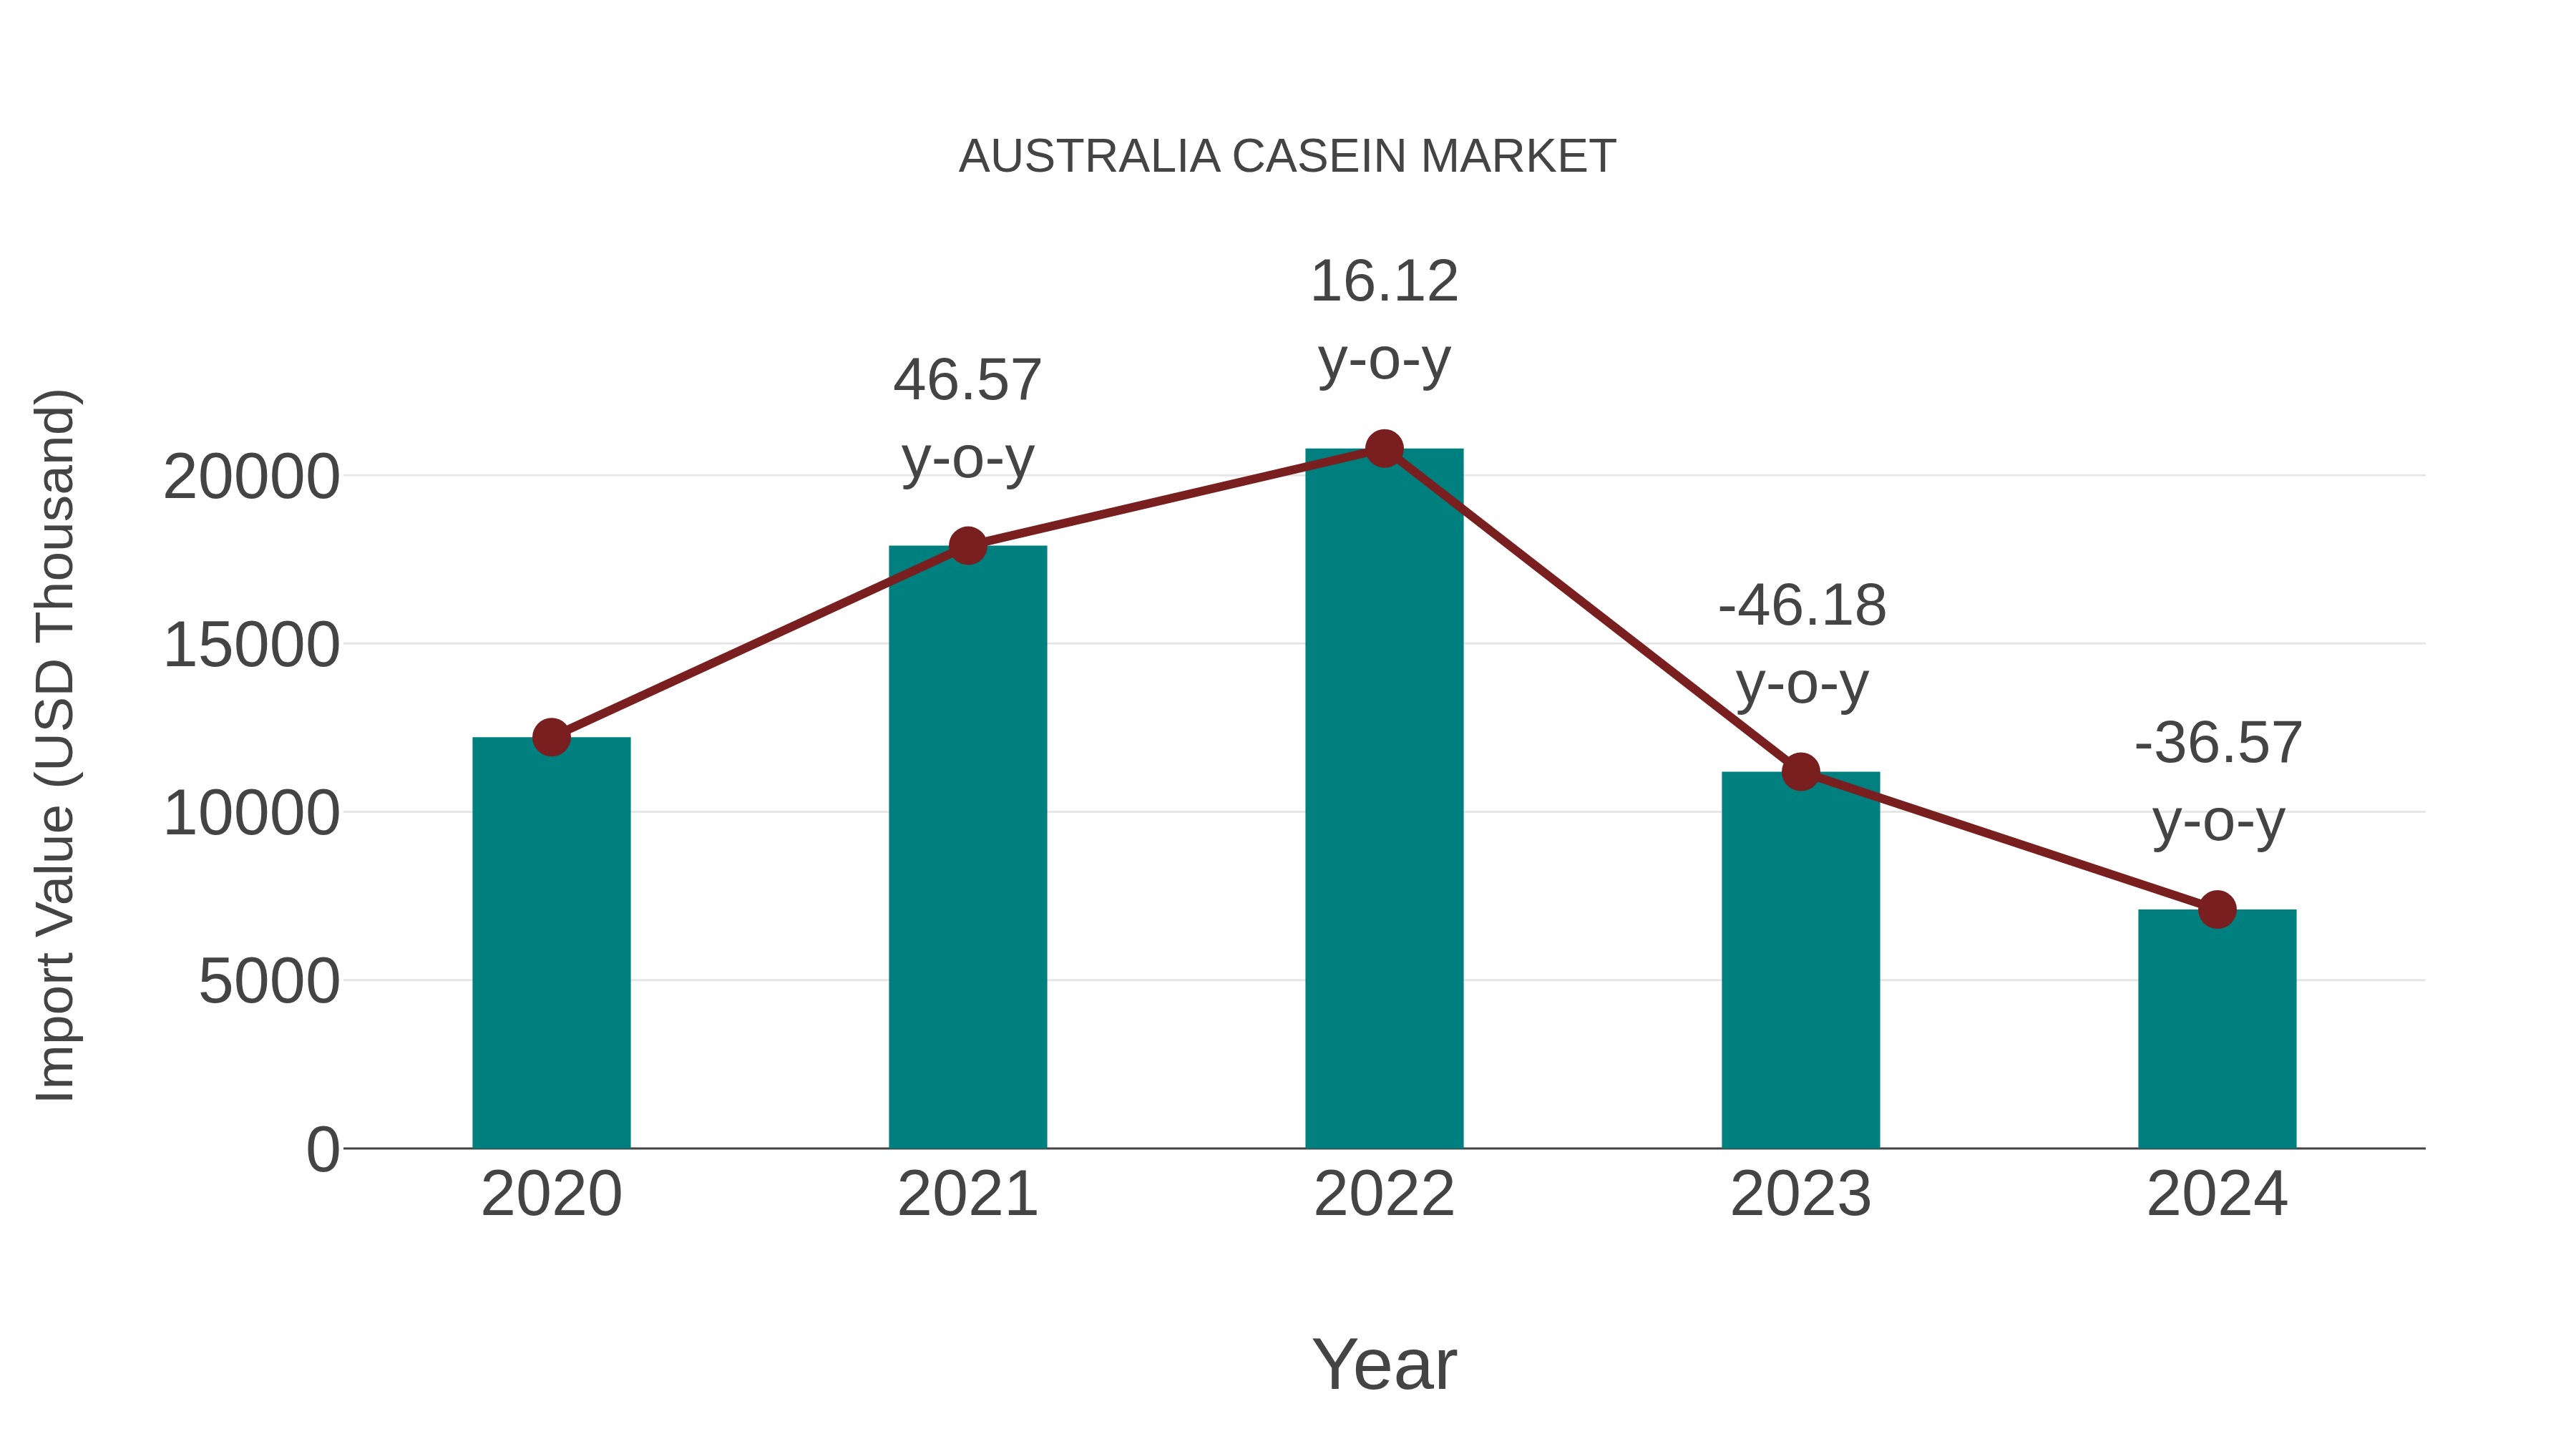
Australia Casein Market: Import Trend Analysis
In the Australia casein market, the import trend experienced a notable decline from 2023 to 2024, with a growth rate of -36.57%. The compound annual growth rate (CAGR) for the period of 2020 to 2024 stood at -12.69%. This decline could be attributed to shifting consumer preferences or changes in trade policies impacting import momentum.
Australia Casein Market Overview
Casein is a protein derived from milk, valued for its nutritional properties, functional attributes, and versatility in food and non-food applications. In Australia, the casein market serves dairy processors, food manufacturers, and ingredient suppliers, offering a range of casein products such as edible casein, industrial casein, and casein derivatives for various uses. Edible casein is used in dairy products, nutritional supplements, and protein fortification, while industrial casein finds applications in adhesives, coatings, paints, and textile finishes. With advancements in processing technology and growing demand for protein-rich ingredients, the casein market continues to evolve, offering innovative solutions for diverse industries and consumer preferences in Australia and beyond.
Drivers of the market
The Australia casein market is driven by factors influencing the dairy industry, food and beverage sector, and nutritional supplement market. Casein, a protein found in milk, is valued for its nutritional benefits, functional properties, and wide range of applications. Market drivers include the growing demand for protein-rich foods, the popularity of sports nutrition products, and the increasing consumption of functional and fortified dairy products. Additionally, technological advancements in dairy processing, product innovations, and marketing strategies contribute to the expansion of the casein market. Moreover, factors such as supply chain dynamics, pricing trends, and consumer preferences influence market dynamics in Australia.
Challenges of the market
Challenges in the casein market include competition from plant-based protein alternatives, fluctuating milk prices affecting raw material costs, and the need for product diversification to expand market reach beyond traditional applications.
Government Policy of the market
Challenges in Australia casein market may include fluctuating demand from various industries, quality control issues, and competition from alternative protein sources. Government policies may focus on promoting dairy industry sustainability, supporting value-added processing activities, and facilitating market access for local casein producers to address these challenges and strengthen the position of Australia casein in the global market.
Key Highlights of the Report:
- Australia Casein Market Outlook
- Market Size of Australia Casein Market, 2025
- Forecast of Australia Casein Market, 2032
- Historical Data and Forecast of Australia Casein Revenues & Volume for the Period 2018 - 2032
- Australia Casein Market Trend Evolution
- Australia Casein Market Drivers and Challenges
- Australia Casein Price Trends
- Australia Casein Porter's Five Forces
- Australia Casein Industry Life Cycle
- Historical Data and Forecast of Australia Casein Market Revenues & Volume By Product Type for the Period 2018 - 2032
- Historical Data and Forecast of Australia Casein Market Revenues & Volume By Acid Casein for the Period 2018 - 2032
- Historical Data and Forecast of Australia Casein Market Revenues & Volume By Rennet Casein for the Period 2018 - 2032
- Historical Data and Forecast of Australia Casein Market Revenues & Volume By End-users for the Period 2018 - 2032
- Historical Data and Forecast of Australia Casein Market Revenues & Volume By Food andBeverages for the Period 2018 - 2032
- Historical Data and Forecast of Australia Casein Market Revenues & Volume By Pharmaceuticals for the Period 2018 - 2032
- Historical Data and Forecast of Australia Casein Market Revenues & Volume By Cosmetics for the Period 2018 - 2032
- Historical Data and Forecast of Australia Casein Market Revenues & Volume By Industrial for the Period 2018 - 2032
- Historical Data and Forecast of Australia Casein Market Revenues & Volume By Others for the Period 2018 - 2032
- Australia Casein Import Export Trade Statistics
- Market Opportunity Assessment By Product Type
- Market Opportunity Assessment By End-users
- Australia Casein Top Companies Market Share
- Australia Casein Competitive Benchmarking By Technical and Operational Parameters
- Australia Casein Company Profiles
- Australia Casein Key Strategic Recommendations
Australia Casein Market: FAQs
6Wresearch actively monitors the Australia Casein Market and publishes its comprehensive annual report, highlighting emerging trends, growth drivers, revenue analysis, and forecast outlook. Our insights help businesses to make data-backed strategic decisions with ongoing market dynamics. Our analysts track relevent industries related to the Australia Casein Market, allowing our clients with actionable intelligence and reliable forecasts tailored to emerging regional needs.
Yes, we provide customisation as per your requirements. To learn more, feel free to contact us on sales@6wresearch.com
1 Executive Summary |
2 Introduction |
2.1 Key Highlights of the Report |
2.2 Report Description |
2.3 Market Scope & Segmentation |
2.4 Research Methodology |
2.5 Assumptions |
3 Australia Casein Market Overview |
3.1 Australia Country Macro Economic Indicators |
3.2 Australia Casein Market Revenues & Volume, 2022 & 2032F |
3.3 Australia Casein Market - Industry Life Cycle |
3.4 Australia Casein Market - Porter's Five Forces |
3.5 Australia Casein Market Revenues & Volume Share, By Product Type, 2022 & 2032F |
3.6 Australia Casein Market Revenues & Volume Share, By End-users, 2022 & 2032F |
4 Australia Casein Market Dynamics |
4.1 Impact Analysis |
4.2 Market Drivers |
4.2.1 Increasing awareness about the health benefits of casein protein |
4.2.2 Growing demand for functional food and beverages |
4.2.3 Rising disposable income leading to higher spending on premium dairy products |
4.3 Market Restraints |
4.3.1 Fluctuating prices of raw milk impacting production costs |
4.3.2 Intense competition from alternative protein sources |
4.3.3 Regulatory challenges related to food safety and labeling |
5 Australia Casein Market Trends |
6 Australia Casein Market, By Types |
6.1 Australia Casein Market, By Product Type |
6.1.1 Overview and Analysis |
6.1.2 Australia Casein Market Revenues & Volume, By Product Type, 2022 - 2032F |
6.1.3 Australia Casein Market Revenues & Volume, By Acid Casein, 2022 - 2032F |
6.1.4 Australia Casein Market Revenues & Volume, By Rennet Casein, 2022 - 2032F |
6.2 Australia Casein Market, By End-users |
6.2.1 Overview and Analysis |
6.2.2 Australia Casein Market Revenues & Volume, By Food and Beverages, 2022 - 2032F |
6.2.3 Australia Casein Market Revenues & Volume, By Pharmaceuticals, 2022 - 2032F |
6.2.4 Australia Casein Market Revenues & Volume, By Cosmetics, 2022 - 2032F |
6.2.5 Australia Casein Market Revenues & Volume, By Industrial, 2022 - 2032F |
6.2.6 Australia Casein Market Revenues & Volume, By Others, 2022 - 2032F |
7 Australia Casein Market Import-Export Trade Statistics |
7.1 Australia Casein Market Export to Major Countries |
7.2 Australia Casein Market Imports from Major Countries |
8 Australia Casein Market Key Performance Indicators |
8.1 Average selling price of casein products |
8.2 Number of new product launches in the casein market |
8.3 Percentage of market share held by premium casein products |
8.4 Consumer satisfaction ratings for casein products |
9 Australia Casein Market - Opportunity Assessment |
9.1 Australia Casein Market Opportunity Assessment, By Product Type, 2022 & 2032F |
9.2 Australia Casein Market Opportunity Assessment, By End-users, 2022 & 2032F |
10 Australia Casein Market - Competitive Landscape |
10.1 Australia Casein Market Revenue Share, By Companies, 2025 |
10.2 Australia Casein Market Competitive Benchmarking, By Operating and Technical Parameters |
11 Company Profiles |
12 Recommendations |
13 Disclaimer |
Global Go To Market Strategy - 2030
Export potential enables firms to identify high-growth global markets with greater confidence by combining advanced trade intelligence with a structured quantitative methodology. The framework analyzes emerging demand trends and country-level import patterns while integrating macroeconomic and trade datasets such as GDP and population forecasts, bilateral import–export flows, tariff structures, elasticity differentials between developed and developing economies, geographic distance, and import demand projections. Using weighted trade values from 2020–2024 as the base period to project country-to-country export potential for 2030, these inputs are operationalized through calculated drivers such as gravity model parameters, tariff impact factors, and projected GDP per-capita growth. Through an analysis of hidden potentials, demand hotspots, and market conditions that are most favorable to success, this method enables firms to focus on target countries, maximize returns, and global expansion with data, backed by accuracy.
By factoring in the projected importer demand gap that is currently unmet and could be potential opportunity, it identifies the potential for the Exporter (Country) among 190 countries, against the general trade analysis, which identifies the biggest importer or exporter.
To discover high-growth global markets and optimize your business strategy:
Click Here
Pricing
- Single User License$ 1,995
- Department License$ 2,400
- Site License$ 3,120
- Global License$ 3,795

Leadership Perspectives from Industry Events
Search
Thought Leadership and Analyst Meet


Our Clients
6WResearch In News
- India Air Conditioner Market Set for Strong Rebound in 2026 After Weather-Led Correction and GST-Driven Recovery: 6Wresearch
- ADAS in India: How Automatic Emergency Braking, Blind Spot Detection & Driver Monitoring are Transforming Road Safety
- Doha a strategic location for EV manufacturing hub: IPA Qatar
- Demand for luxury TVs surging in the GCC, says Samsung
- Empowering Growth: The Thriving Journey of Bangladesh’s Cable Industry
- Demand for luxury TVs surging in the GCC, says Samsung
Latest Reports
- Nicaragua RPG Gaming Market (2026-2032)
- New Zealand RPG Gaming Market (2026-2032)
- Netherlands RPG Gaming Market (2026-2032)
- Nauru RPG Gaming Market (2026-2032)
- Namibia RPG Gaming Market (2026-2032)
- Mozambique RPG Gaming Market (2026-2032)
- Montenegro RPG Gaming Market (2026-2032)
- Mongolia RPG Gaming Market (2026-2032)
- Monaco RPG Gaming Market (2026-2032)
- Micronesia RPG Gaming Market (2026-2032)
Industry Events and Analyst Meet

EV India Expo 2026

HIMTEX 2026

India Refining Summit 2026

India EV Show 2026

EV tech India Expo 2026
Whitepaper
- Middle East & Africa Commercial Security Market Click here to view more.
- Middle East & Africa Fire Safety Systems & Equipment Market Click here to view more.
- GCC Drone Market Click here to view more.
- Middle East Lighting Fixture Market Click here to view more.
- GCC Physical & Perimeter Security Market Click here to view more.