Australia Caviar Market (2026-2032) Outlook | Companies, Value, Industry, Size, Growth, Trends, Forecast, Analysis, Share & Revenue
Market Forecast By Product (Sevruga, Osetra, Salmon, Sushi, Others), By Form (Fresh, Dried, Preserved & Frozen), By Application (Restaurants, Household) And Competitive Landscape
| Product Code: ETC085374 | Publication Date: Jun 2021 | Updated Date: Mar 2026 | Product Type: Report | |
| Publisher: 6Wresearch | Author: Ravi Bhandari | No. of Pages: 70 | No. of Figures: 35 | No. of Tables: 5 |
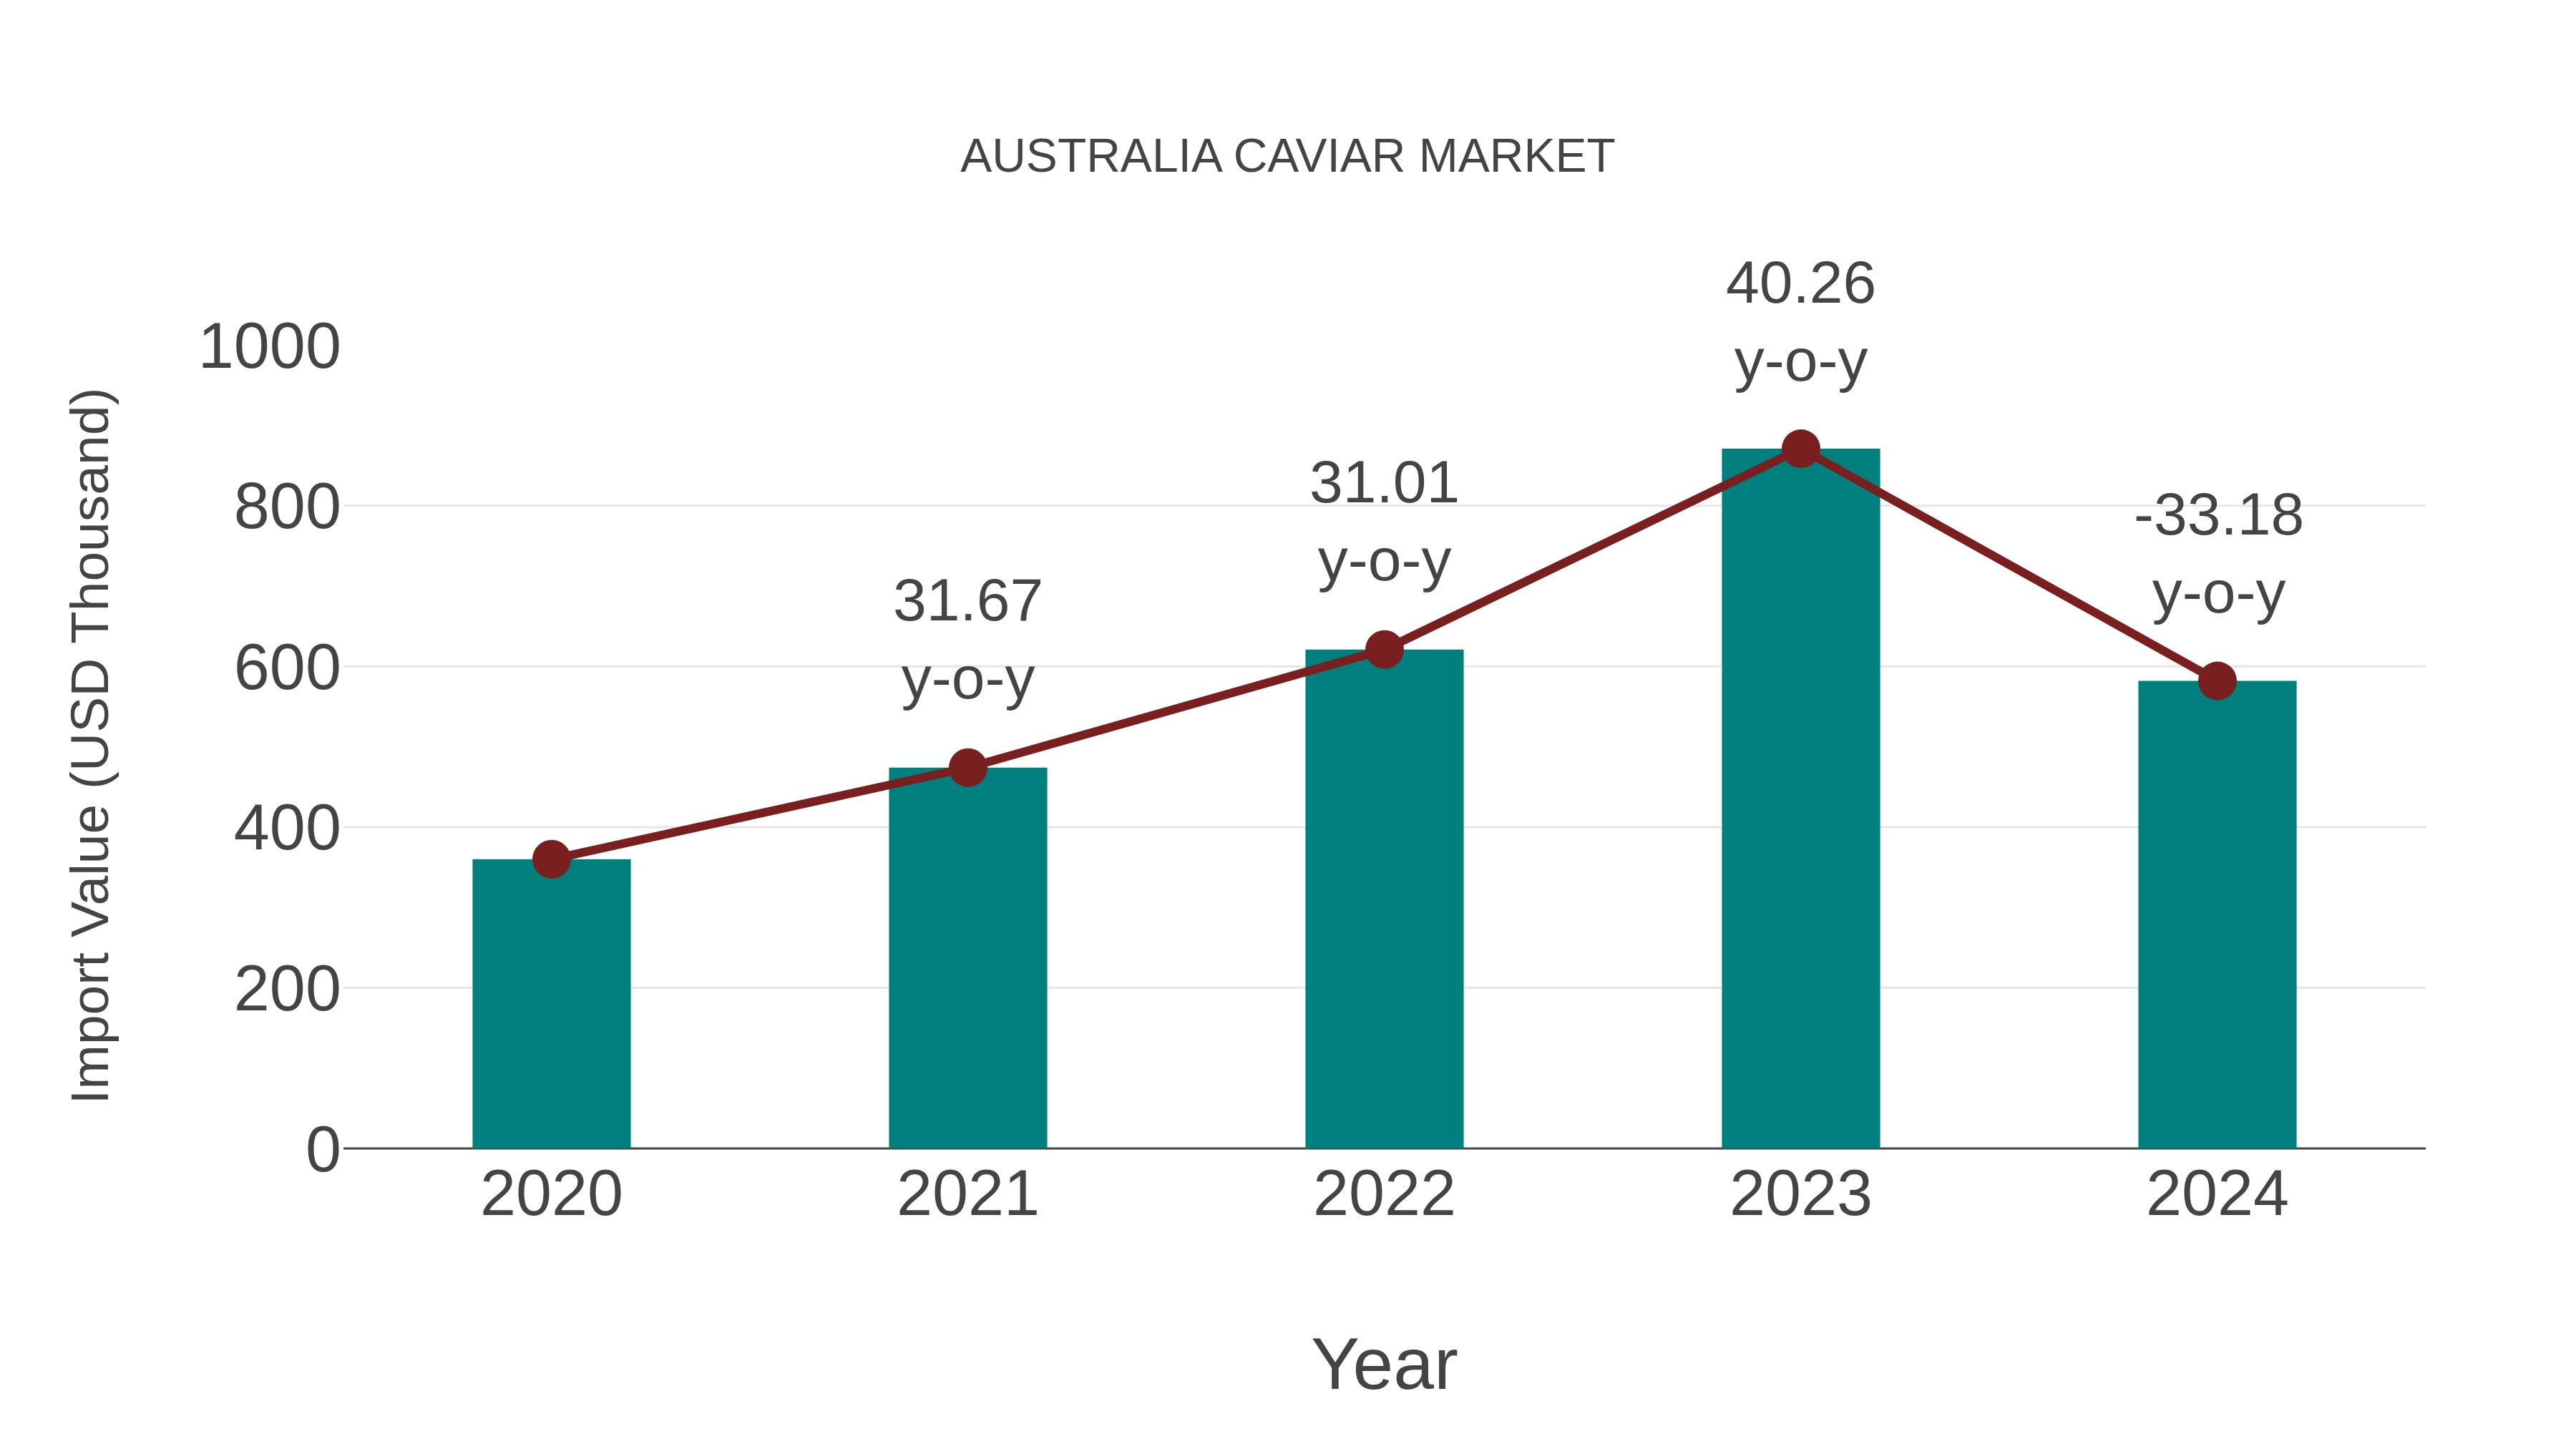
Australia Caviar Market: Import Trend Analysis
Australia`s caviar market witnessed a notable import trend from 2023 to 2024, with a growth rate of -33.18%. However, the compound annual growth rate (CAGR) for the period 2020-2024 stood at a positive 12.76%. This decline in import momentum in 2024 could be attributed to shifting consumer preferences or changes in trade policies affecting market stability.
Australia Caviar Market Overview
Australia caviar market is niche but growing, driven by increasing consumer appreciation for gourmet food experiences, sustainable aquaculture practices, and the country`s reputation for high-quality seafood production.
Drivers of the market
The Australia Caviar Market is experiencing growth driven by factors such as the rising demand for luxury food products, increasing consumer disposable income, and the expansion of aquaculture facilities producing sturgeon fish. Caviar, prized for its delicate taste and exclusivity, is gaining popularity among affluent consumers and food enthusiasts. With efforts to sustainably harvest caviar and develop aquaculture techniques, the market for this gourmet delicacy is expected to expand further.The Australia CBCT/Cone Beam Imaging Market is influenced by factors such as the increasing prevalence of dental and maxillofacial conditions, technological advancements in imaging systems, and the growing adoption of CBCT for diagnostic and treatment planning purposes. Cone beam computed tomography (CBCT) technology offers detailed 3D images with low radiation exposure, making it invaluable in various dental and medical specialties. As healthcare providers seek more accurate and efficient imaging solutions, the demand for CBCT systems is expected to rise.
Challenges of the market
Challenges in the caviar market involve sustainability concerns related to overfishing of sturgeon, regulatory restrictions on wild caviar harvests, and competition from alternative luxury food products.
Government Policy of the market
The caviar market in Australia faces challenges such as environmental sustainability, market demand fluctuations, and competition from imported caviar products. Government policies may aim to regulate wild caviar harvesting, promote sustainable aquaculture practices, and support domestic caviar producers. Additionally, initiatives to enhance product quality standards, promote caviar tourism, and raise consumer awareness about sustainable caviar sourcing can help address these challenges and sustain the growth of the caviar market.
Key Highlights of the Report:
- Australia Caviar Market Outlook
- Market Size of Australia Caviar Market, 2025
- Forecast of Australia Caviar Market, 2032
- Historical Data and Forecast of Australia Caviar Revenues & Volume for the Period 2022-2032F
- Australia Caviar Market Trend Evolution
- Australia Caviar Market Drivers and Challenges
- Australia Caviar Price Trends
- Australia Caviar Porter's Five Forces
- Australia Caviar Industry Life Cycle
- Historical Data and Forecast of Australia Caviar Market Revenues & Volume By Product for the Period 2022-2032F
- Historical Data and Forecast of Australia Caviar Market Revenues & Volume By Sevruga for the Period 2022-2032F
- Historical Data and Forecast of Australia Caviar Market Revenues & Volume By Osetra for the Period 2022-2032F
- Historical Data and Forecast of Australia Caviar Market Revenues & Volume By Salmon for the Period 2022-2032F
- Historical Data and Forecast of Australia Caviar Market Revenues & Volume By Sushi for the Period 2022-2032F
- Historical Data and Forecast of Australia Caviar Market Revenues & Volume By Others for the Period 2022-2032F
- Historical Data and Forecast of Australia Caviar Market Revenues & Volume By Form for the Period 2022-2032F
- Historical Data and Forecast of Australia Caviar Market Revenues & Volume By Fresh for the Period 2022-2032F
- Historical Data and Forecast of Australia Caviar Market Revenues & Volume By Dried for the Period 2022-2032F
- Historical Data and Forecast of Australia Caviar Market Revenues & Volume By Preserved & Frozen for the Period 2022-2032F
- Historical Data and Forecast of Australia Caviar Market Revenues & Volume By Application for the Period 2022-2032F
- Historical Data and Forecast of Australia Caviar Market Revenues & Volume By Restaurants for the Period 2022-2032F
- Historical Data and Forecast of Australia Caviar Market Revenues & Volume By Household for the Period 2022-2032F
- Australia Caviar Import Export Trade Statistics
- Market Opportunity Assessment By Product
- Market Opportunity Assessment By Form
- Market Opportunity Assessment By Application
- Australia Caviar Top Companies Market Share
- Australia Caviar Competitive Benchmarking By Technical and Operational Parameters
- Australia Caviar Company Profiles
- Australia Caviar Key Strategic Recommendations
Australia Caviar Market (2026-2032): FAQs
6Wresearch actively monitors the Australia Caviar Market and publishes its comprehensive annual report, highlighting emerging trends, growth drivers, revenue analysis, and forecast outlook. Our insights help businesses to make data-backed strategic decisions with ongoing market dynamics. Our analysts track relevent industries related to the Australia Caviar Market, allowing our clients with actionable intelligence and reliable forecasts tailored to emerging regional needs.
Yes, we provide customisation as per your requirements. To learn more, feel free to contact us on sales@6wresearch.com
1 Executive Summary |
2 Introduction |
2.1 Key Highlights of the Report |
2.2 Report Description |
2.3 Market Scope & Segmentation |
2.4 Research Methodology |
2.5 Assumptions |
3 Australia Caviar Market Overview |
3.1 Australia Country Macro Economic Indicators |
3.2 Australia Caviar Market Revenues & Volume, 2022 & 2032F |
3.3 Australia Caviar Market - Industry Life Cycle |
3.4 Australia Caviar Market - Porter's Five Forces |
3.5 Australia Caviar Market Revenues & Volume Share, By Form, 2022 & 2032F |
3.6 Australia Caviar Market Revenues & Volume Share, By Form, 2022 & 2032F |
3.7 Australia Caviar Market Revenues & Volume Share, By Form, 2022 & 2032F |
4 Australia Caviar Market Dynamics |
4.1 Impact Analysis |
4.2 Market Drivers |
4.2.1 Increasing demand for luxury food products in Australia |
4.2.2 Growing trend towards gourmet dining and culinary experiences |
4.2.3 Rising awareness about the health benefits of caviar consumption |
4.3 Market Restraints |
4.3.1 Limited domestic production of caviar in Australia |
4.3.2 High production costs and limited availability of caviar |
4.3.3 Competition from other luxury food products in the market |
5 Australia Caviar Market Trends |
6 Australia Caviar Market, By Types |
6.1 Australia Caviar Market, By Product |
6.1.1 Overview and Analysis |
6.1.2 Australia Caviar Market Revenues & Volume, By Product, 2022-2032F |
6.1.3 Australia Caviar Market Revenues & Volume, By Sevruga, 2022-2032F |
6.1.4 Australia Caviar Market Revenues & Volume, By Osetra, 2022-2032F |
6.1.5 Australia Caviar Market Revenues & Volume, By Salmon, 2022-2032F |
6.1.6 Australia Caviar Market Revenues & Volume, By Sushi, 2022-2032F |
6.1.7 Australia Caviar Market Revenues & Volume, By Others, 2022-2032F |
6.2 Australia Caviar Market, By Form |
6.2.1 Overview and Analysis |
6.2.2 Australia Caviar Market Revenues & Volume, By Fresh, 2022-2032F |
6.2.3 Australia Caviar Market Revenues & Volume, By Dried, 2022-2032F |
6.2.4 Australia Caviar Market Revenues & Volume, By Preserved & Frozen, 2022-2032F |
6.3 Australia Caviar Market, By Application |
6.3.1 Overview and Analysis |
6.3.2 Australia Caviar Market Revenues & Volume, By Restaurants, 2022-2032F |
6.3.3 Australia Caviar Market Revenues & Volume, By Household, 2022-2032F |
7 Australia Caviar Market Import-Export Trade Statistics |
7.1 Australia Caviar Market Export to Major Countries |
7.2 Australia Caviar Market Imports from Major Countries |
8 Australia Caviar Market Key Performance Indicators |
8.1 Average selling price of caviar products |
8.2 Number of high-end restaurants and hotels serving caviar dishes |
8.3 Consumer awareness and perception of caviar as a premium food product |
8.4 Number of new entrants or expansions in the caviar market |
8.5 Sustainability practices adopted by caviar producers |
9 Australia Caviar Market - Opportunity Assessment |
9.1 Australia Caviar Market Opportunity Assessment, By Product, 2022 & 2032F |
9.2 Australia Caviar Market Opportunity Assessment, By Form, 2022 & 2032F |
9.3 Australia Caviar Market Opportunity Assessment, By Application, 2022 & 2032F |
10 Australia Caviar Market - Competitive Landscape |
10.1 Australia Caviar Market Revenue Share, By Companies, 2025 |
10.2 Australia Caviar Market Competitive Benchmarking, By Operating and Technical Parameters |
11 Company Profiles |
12 Recommendations |
13 Disclaimer |
Global Go To Market Strategy - 2030
Export potential enables firms to identify high-growth global markets with greater confidence by combining advanced trade intelligence with a structured quantitative methodology. The framework analyzes emerging demand trends and country-level import patterns while integrating macroeconomic and trade datasets such as GDP and population forecasts, bilateral import–export flows, tariff structures, elasticity differentials between developed and developing economies, geographic distance, and import demand projections. Using weighted trade values from 2020–2024 as the base period to project country-to-country export potential for 2030, these inputs are operationalized through calculated drivers such as gravity model parameters, tariff impact factors, and projected GDP per-capita growth. Through an analysis of hidden potentials, demand hotspots, and market conditions that are most favorable to success, this method enables firms to focus on target countries, maximize returns, and global expansion with data, backed by accuracy.
By factoring in the projected importer demand gap that is currently unmet and could be potential opportunity, it identifies the potential for the Exporter (Country) among 190 countries, against the general trade analysis, which identifies the biggest importer or exporter.
To discover high-growth global markets and optimize your business strategy:
Click Here
Pricing
- Single User License$ 1,995
- Department License$ 2,400
- Site License$ 3,120
- Global License$ 3,795

Leadership Perspectives from Industry Events
Search
Thought Leadership and Analyst Meet


Our Clients
6WResearch In News
- India Air Conditioner Market Set for Strong Rebound in 2026 After Weather-Led Correction and GST-Driven Recovery: 6Wresearch
- ADAS in India: How Automatic Emergency Braking, Blind Spot Detection & Driver Monitoring are Transforming Road Safety
- Doha a strategic location for EV manufacturing hub: IPA Qatar
- Demand for luxury TVs surging in the GCC, says Samsung
- Empowering Growth: The Thriving Journey of Bangladesh’s Cable Industry
- Demand for luxury TVs surging in the GCC, says Samsung
Latest Reports
- Nicaragua RPG Gaming Market (2026-2032)
- New Zealand RPG Gaming Market (2026-2032)
- Netherlands RPG Gaming Market (2026-2032)
- Nauru RPG Gaming Market (2026-2032)
- Namibia RPG Gaming Market (2026-2032)
- Mozambique RPG Gaming Market (2026-2032)
- Montenegro RPG Gaming Market (2026-2032)
- Mongolia RPG Gaming Market (2026-2032)
- Monaco RPG Gaming Market (2026-2032)
- Micronesia RPG Gaming Market (2026-2032)
Industry Events and Analyst Meet

EV India Expo 2026

HIMTEX 2026

India Refining Summit 2026

India EV Show 2026

EV tech India Expo 2026
Whitepaper
- Middle East & Africa Commercial Security Market Click here to view more.
- Middle East & Africa Fire Safety Systems & Equipment Market Click here to view more.
- GCC Drone Market Click here to view more.
- Middle East Lighting Fixture Market Click here to view more.
- GCC Physical & Perimeter Security Market Click here to view more.