Australia Ceramic Inks Market (2026-2032) Outlook | Analysis, Revenue, Forecast, Companies, Industry, Size, Value, Share, Trends & Growth
Market Forecast By Type (Decorative , Functional), By Technology (Digital , Analog), By Application (Ceramic Tiles, Glass Printing, Food Container Printing) And Competitive Landscape
| Product Code: ETC4497636 | Publication Date: Jul 2023 | Updated Date: Mar 2026 | Product Type: Report | |
| Publisher: 6Wresearch | Author: Dhaval Chaurasia | No. of Pages: 85 | No. of Figures: 45 | No. of Tables: 25 |
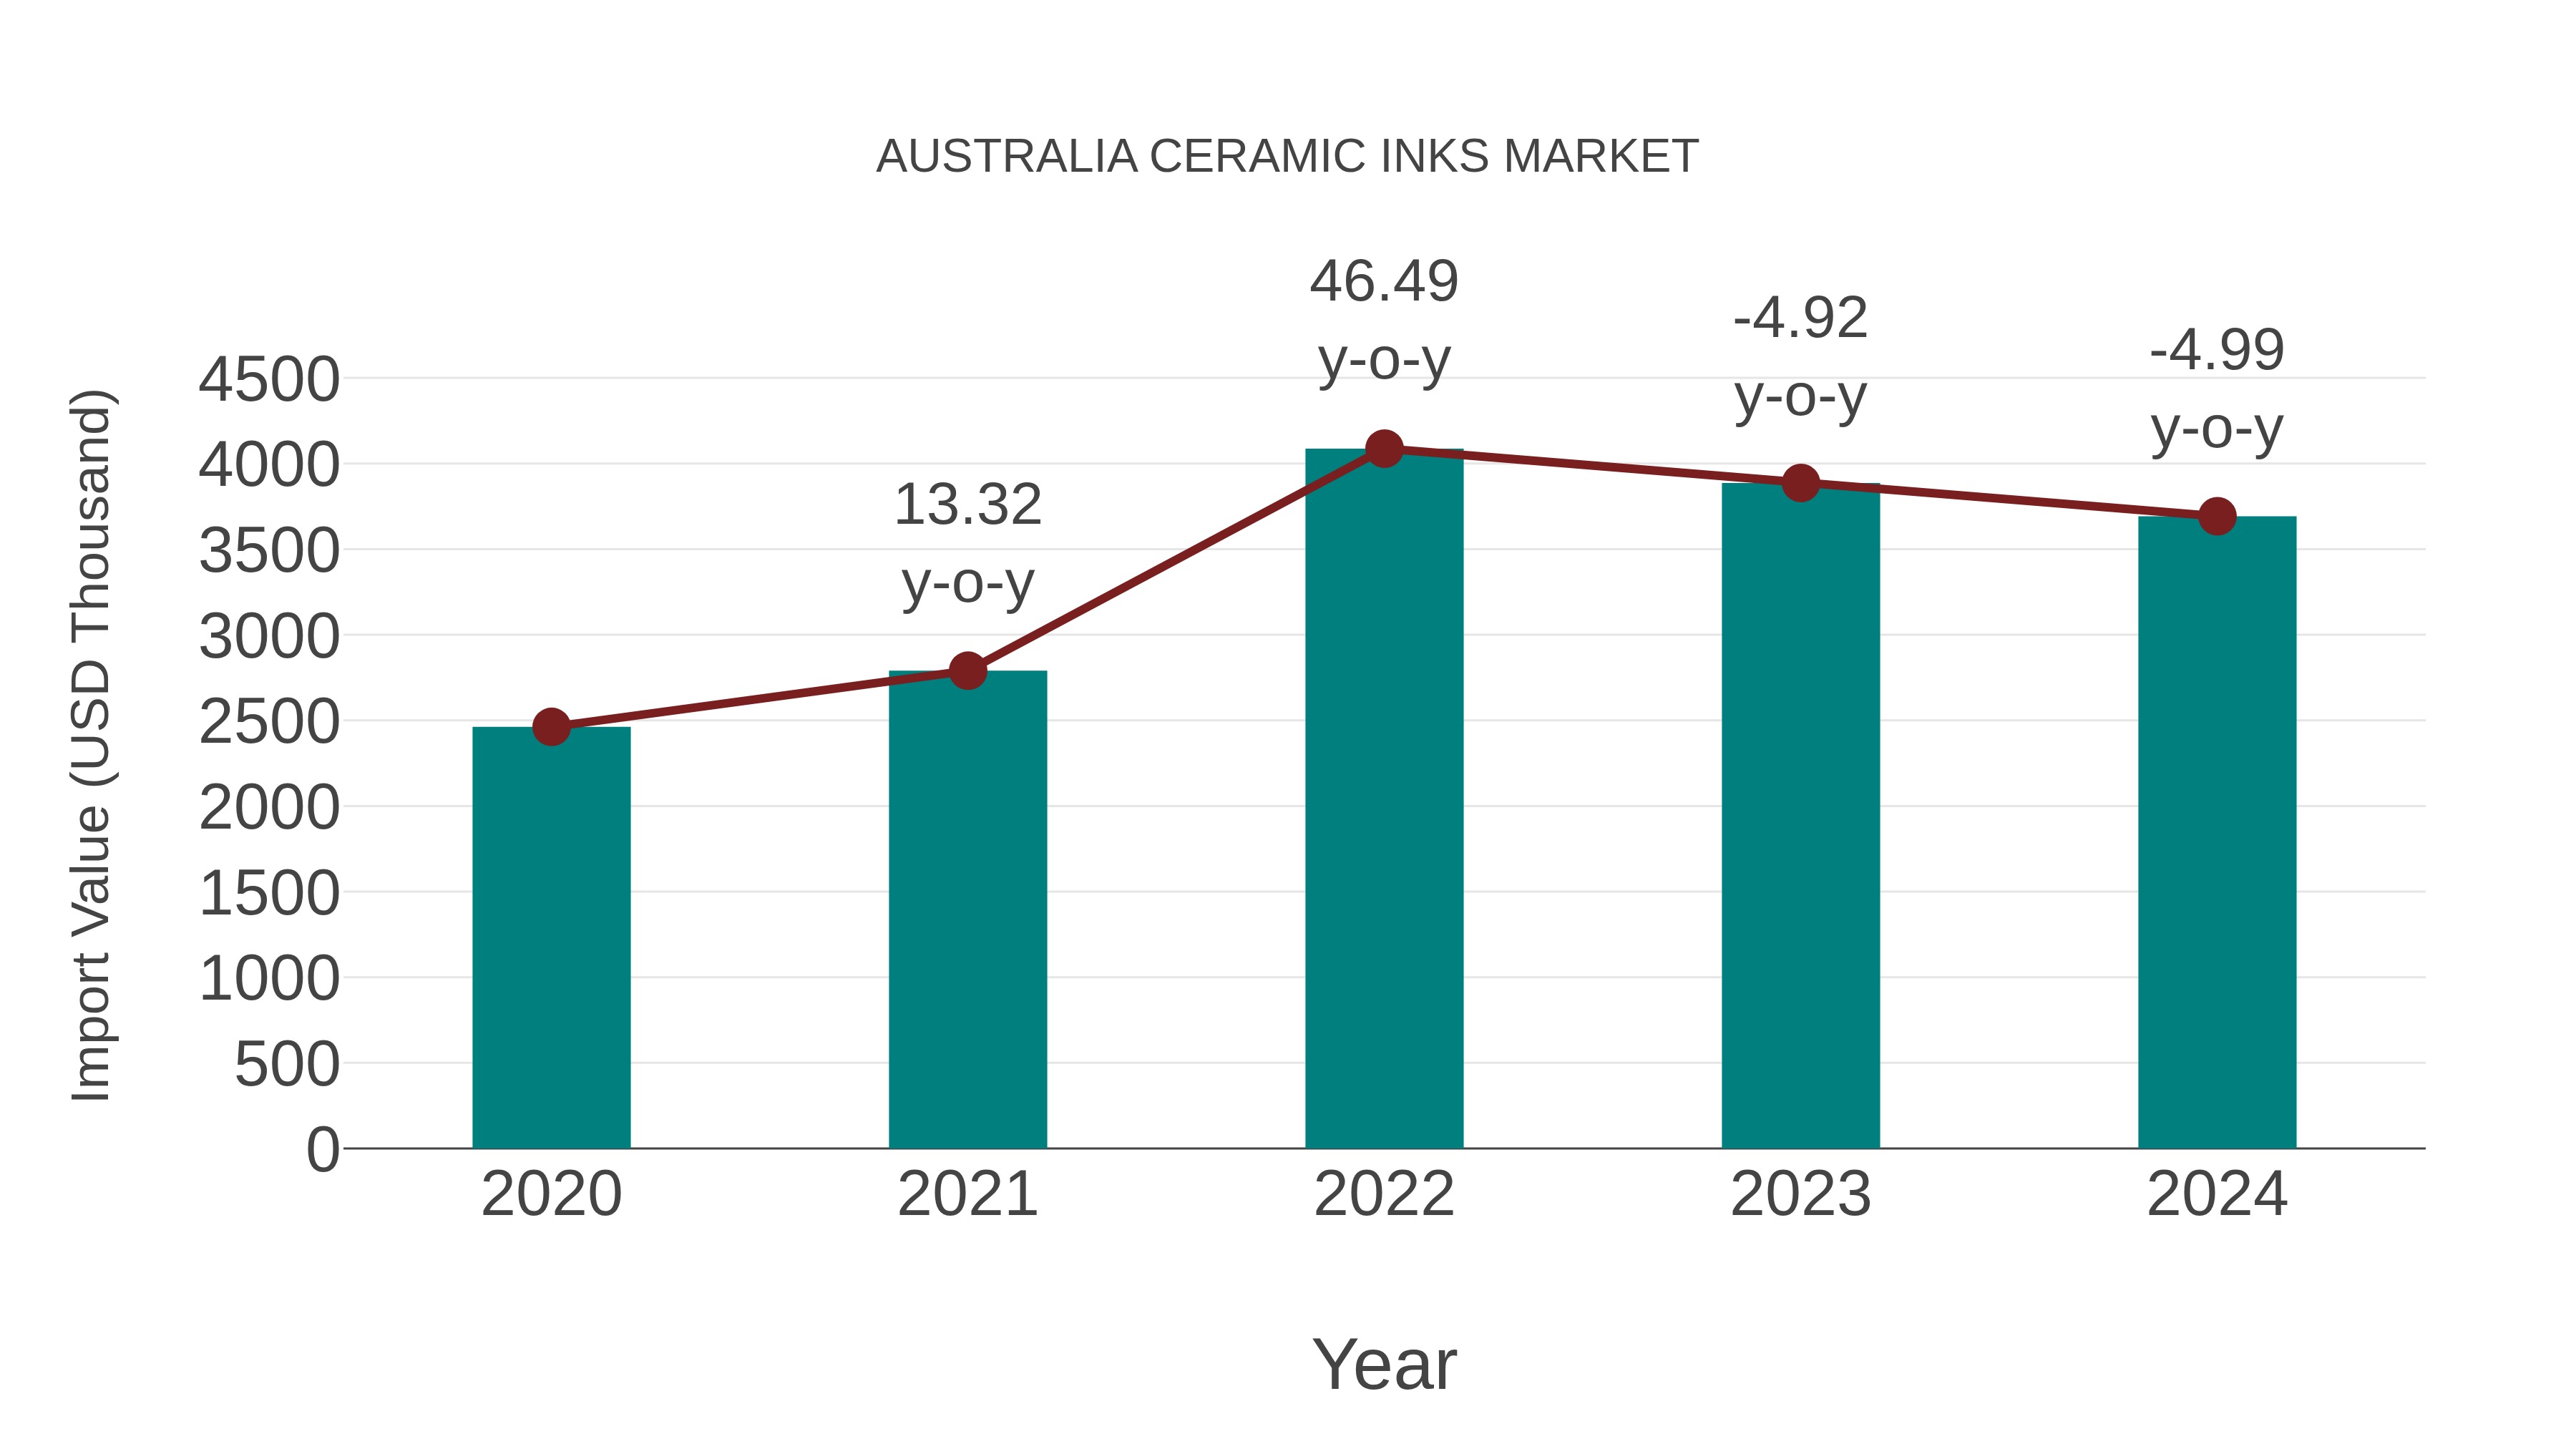
Australia Ceramic Inks Market: Import Trend Analysis
Australia`s import trend for ceramic inks experienced a decline with a growth rate of -4.99% from 2023 to 2024, although the compound annual growth rate (CAGR) for 2020-2024 stood at a healthy 10.66%. This decline in import momentum may be attributed to shifts in demand or market conditions affecting the ceramic inks sector.
Australia Ceramic Inks Market Overview
The ceramic inks market in Australia is experiencing growth, propelled by the expanding ceramics and glass printing industry. These inks are used for decorating ceramic tiles, tableware, and sanitary ware, with advancements in digital printing technology driving market innovation and product diversification.
Drivers of the market
The Australia Ceramic Inks Market is driven by factors such as the demand for digital printing solutions in ceramic tile manufacturing, and the properties of ceramic inks such as color vibrancy, adhesion, and durability. Ceramic inks, formulated with ceramic pigments and binders, are used for printing decorative patterns, designs, and textures on ceramic tiles and glass substrates. With the increasing adoption of digital printing technology and the growing trend towards personalized and customizable products, the market for ceramic inks is expected to expand in Australia.
Challenges of the market
Challenges in the Australia ceramic inks market include achieving vibrant color reproduction and adhesion on ceramic substrates, developing inks compatible with various printing technologies, and ensuring chemical stability and durability in end-use applications such as tiles, tableware, and decorative ceramics.
Government Policy of the market
Competition from alternative printing technologies, technological advancements, and regulatory compliance are challenges faced by Australia ceramic inks market. Government support may involve funding for R&D in digital ceramic printing technologies, promoting sustainable ink formulations, and providing technical assistance to manufacturers. These efforts can address challenges and drive innovation in ceramic inkjet printing for applications such as ceramic tiles, glass, and decorative surfaces.
Key Highlights of the Report:
- Australia Ceramic Inks Market Outlook
- Market Size of Australia Ceramic Inks Market, 2025
- Forecast of Australia Ceramic Inks Market, 2032
- Historical Data and Forecast of Australia Ceramic Inks Revenues & Volume for the Period 2022-2032F
- Australia Ceramic Inks Market Trend Evolution
- Australia Ceramic Inks Market Drivers and Challenges
- Australia Ceramic Inks Price Trends
- Australia Ceramic Inks Porter's Five Forces
- Australia Ceramic Inks Industry Life Cycle
- Historical Data and Forecast of Australia Ceramic Inks Market Revenues & Volume By Type for the Period 2022-2032F
- Historical Data and Forecast of Australia Ceramic Inks Market Revenues & Volume By Decorative for the Period 2022-2032F
- Historical Data and Forecast of Australia Ceramic Inks Market Revenues & Volume By Functional for the Period 2022-2032F
- Historical Data and Forecast of Australia Ceramic Inks Market Revenues & Volume By Technology for the Period 2022-2032F
- Historical Data and Forecast of Australia Ceramic Inks Market Revenues & Volume By Digital for the Period 2022-2032F
- Historical Data and Forecast of Australia Ceramic Inks Market Revenues & Volume By Analog for the Period 2022-2032F
- Historical Data and Forecast of Australia Ceramic Inks Market Revenues & Volume By Application for the Period 2022-2032F
- Historical Data and Forecast of Australia Ceramic Inks Market Revenues & Volume By Ceramic Tiles for the Period 2022-2032F
- Historical Data and Forecast of Australia Ceramic Inks Market Revenues & Volume By Glass Printing for the Period 2022-2032F
- Historical Data and Forecast of Australia Ceramic Inks Market Revenues & Volume By Food Container Printing for the Period 2022-2032F
- Australia Ceramic Inks Import Export Trade Statistics
- Market Opportunity Assessment By Type
- Market Opportunity Assessment By Technology
- Market Opportunity Assessment By Application
- Australia Ceramic Inks Top Companies Market Share
- Australia Ceramic Inks Competitive Benchmarking By Technical and Operational Parameters
- Australia Ceramic Inks Company Profiles
- Australia Ceramic Inks Key Strategic Recommendations
Australia Ceramic Inks Market (2026-2032): FAQs
6Wresearch actively monitors the Australia Ceramic Inks Market and publishes its comprehensive annual report, highlighting emerging trends, growth drivers, revenue analysis, and forecast outlook. Our insights help businesses to make data-backed strategic decisions with ongoing market dynamics. Our analysts track relevent industries related to the Australia Ceramic Inks Market, allowing our clients with actionable intelligence and reliable forecasts tailored to emerging regional needs.
Yes, we provide customisation as per your requirements. To learn more, feel free to contact us on sales@6wresearch.com
1 Executive Summary |
2 Introduction |
2.1 Key Highlights of the Report |
2.2 Report Description |
2.3 Market Scope & Segmentation |
2.4 Research Methodology |
2.5 Assumptions |
3 Australia Ceramic Inks Market Overview |
3.1 Australia Country Macro Economic Indicators |
3.2 Australia Ceramic Inks Market Revenues & Volume, 2022 & 2032F |
3.3 Australia Ceramic Inks Market - Industry Life Cycle |
3.4 Australia Ceramic Inks Market - Porter's Five Forces |
3.5 Australia Ceramic Inks Market Revenues & Volume Share, By Type, 2022 & 2032F |
3.6 Australia Ceramic Inks Market Revenues & Volume Share, By Technology, 2022 & 2032F |
3.7 Australia Ceramic Inks Market Revenues & Volume Share, By Application, 2022 & 2032F |
4 Australia Ceramic Inks Market Dynamics |
4.1 Impact Analysis |
4.2 Market Drivers |
4.2.1 Growing demand for ceramic products in construction and interior design industries |
4.2.2 Increasing adoption of digital printing technology in ceramic tile manufacturing |
4.2.3 Rising popularity of customized and aesthetically appealing ceramic products |
4.3 Market Restraints |
4.3.1 Fluctuating raw material prices impacting production costs |
4.3.2 Intense competition among ceramic ink manufacturers |
4.3.3 Stringent regulations related to environmental impact and safety of ceramic inks |
5 Australia Ceramic Inks Market Trends |
6 Australia Ceramic Inks Market, By Types |
6.1 Australia Ceramic Inks Market, By Type |
6.1.1 Overview and Analysis |
6.1.2 Australia Ceramic Inks Market Revenues & Volume, By Type, 2022-2032F |
6.1.3 Australia Ceramic Inks Market Revenues & Volume, By Decorative , 2022-2032F |
6.1.4 Australia Ceramic Inks Market Revenues & Volume, By Functional, 2022-2032F |
6.2 Australia Ceramic Inks Market, By Technology |
6.2.1 Overview and Analysis |
6.2.2 Australia Ceramic Inks Market Revenues & Volume, By Digital , 2022-2032F |
6.2.3 Australia Ceramic Inks Market Revenues & Volume, By Analog, 2022-2032F |
6.3 Australia Ceramic Inks Market, By Application |
6.3.1 Overview and Analysis |
6.3.2 Australia Ceramic Inks Market Revenues & Volume, By Ceramic Tiles, 2022-2032F |
6.3.3 Australia Ceramic Inks Market Revenues & Volume, By Glass Printing, 2022-2032F |
6.3.4 Australia Ceramic Inks Market Revenues & Volume, By Food Container Printing, 2022-2032F |
7 Australia Ceramic Inks Market Import-Export Trade Statistics |
7.1 Australia Ceramic Inks Market Export to Major Countries |
7.2 Australia Ceramic Inks Market Imports from Major Countries |
8 Australia Ceramic Inks Market Key Performance Indicators |
8.1 Adoption rate of digital printing technology in ceramic tile manufacturing |
8.2 Number of new product launches and innovations in ceramic ink formulations |
8.3 Growth in the market share of ceramic ink manufacturers offering eco-friendly and sustainable products |
9 Australia Ceramic Inks Market - Opportunity Assessment |
9.1 Australia Ceramic Inks Market Opportunity Assessment, By Type, 2022 & 2032F |
9.2 Australia Ceramic Inks Market Opportunity Assessment, By Technology, 2022 & 2032F |
9.3 Australia Ceramic Inks Market Opportunity Assessment, By Application, 2022 & 2032F |
10 Australia Ceramic Inks Market - Competitive Landscape |
10.1 Australia Ceramic Inks Market Revenue Share, By Companies, 2025 |
10.2 Australia Ceramic Inks Market Competitive Benchmarking, By Operating and Technical Parameters |
11 Company Profiles |
12 Recommendations |
13 Disclaimer |
Export potential assessment - trade Analytics for 2030
Export potential enables firms to identify high-growth global markets with greater confidence by combining advanced trade intelligence with a structured quantitative methodology. The framework analyzes emerging demand trends and country-level import patterns while integrating macroeconomic and trade datasets such as GDP and population forecasts, bilateral import–export flows, tariff structures, elasticity differentials between developed and developing economies, geographic distance, and import demand projections. Using weighted trade values from 2020–2024 as the base period to project country-to-country export potential for 2030, these inputs are operationalized through calculated drivers such as gravity model parameters, tariff impact factors, and projected GDP per-capita growth. Through an analysis of hidden potentials, demand hotspots, and market conditions that are most favorable to success, this method enables firms to focus on target countries, maximize returns, and global expansion with data, backed by accuracy.
By factoring in the projected importer demand gap that is currently unmet and could be potential opportunity, it identifies the potential for the Exporter (Country) among 190 countries, against the general trade analysis, which identifies the biggest importer or exporter.
To discover high-growth global markets and optimize your business strategy:
Click Here
Pricing
- Single User License$ 1,995
- Department License$ 2,400
- Site License$ 3,120
- Global License$ 3,795

Search
Thought Leadership and Analyst Meet


Our Clients
Latest Reports
- Philippines Polyhydroxybutyrate-co-Hydroxyvalerate Market (2026-2032) | Trends, Insights, Challenges, Restraints, Competition, Size, Value, Forecast, Pricing, Share, Outlook, Revenue, Investment Opportunities, Strategy, Drivers, Demand, Growth, segmentation, Analysis, Companies
- Peru Polyhydroxybutyrate-co-Hydroxyvalerate Market (2026-2032) | Growth, Demand, Challenges, Share, Trends, Analysis, Pricing, Investment Opportunities, Drivers, Value, Forecast, Competition, Size, Companies, Insights, Outlook, Restraints, segmentation, Revenue, Strategy
- Pakistan Polyhydroxybutyrate-co-Hydroxyvalerate Market (2026-2032) | Restraints, segmentation, Pricing, Forecast, Share, Strategy, Competition, Trends, Insights, Drivers, Challenges, Growth, Revenue, Outlook, Value, Investment Opportunities, Companies, Size, Analysis, Demand
- Oman Polyhydroxybutyrate-co-Hydroxyvalerate Market (2026-2032) | Drivers, segmentation, Insights, Competition, Pricing, Outlook, Size, Revenue, Challenges, Forecast, Analysis, Growth, Value, Share, Trends, Investment Opportunities, Strategy, Restraints, Companies, Demand
- Nigeria Polyhydroxybutyrate-co-Hydroxyvalerate Market (2026-2032) | Value, Investment Opportunities, Analysis, Revenue, Restraints, Pricing, Outlook, Competition, Demand, Growth, Forecast, Companies, Trends, Challenges, segmentation, Drivers, Insights, Share, Size, Strategy
- Nepal Polyhydroxybutyrate-co-Hydroxyvalerate Market (2026-2032) | Insights, Analysis, Drivers, Share, Revenue, Demand, segmentation, Investment Opportunities, Competition, Forecast, Growth, Pricing, Companies, Strategy, Trends, Restraints, Challenges, Outlook, Size, Value
- Myanmar Polyhydroxybutyrate-co-Hydroxyvalerate Market (2026-2032) | Outlook, Revenue, Strategy, Restraints, Drivers, segmentation, Share, Forecast, Competition, Insights, Growth, Pricing, Size, Demand, Value, Companies, Trends, Challenges, Investment Opportunities, Analysis
- Morocco Polyhydroxybutyrate-co-Hydroxyvalerate Market (2026-2032) | Outlook, Investment Opportunities, Restraints, Strategy, Forecast, Challenges, Drivers, Growth, Companies, segmentation, Trends, Size, Competition, Revenue, Demand, Insights, Share, Analysis, Value, Pricing
- Mexico Polyhydroxybutyrate-co-Hydroxyvalerate Market (2026-2032) | Size, Drivers, Outlook, Share, Strategy, Growth, Pricing, Challenges, Companies, Demand, Value, Investment Opportunities, Restraints, Trends, Forecast, segmentation, Analysis, Insights, Competition, Revenue
- Malaysia Polyhydroxybutyrate-co-Hydroxyvalerate Market (2026-2032) | Share, segmentation, Size, Companies, Analysis, Insights, Forecast, Value, Revenue, Drivers, Restraints, Challenges, Investment Opportunities, Trends, Competition, Strategy, Demand, Growth, Outlook, Pricing
Industry Events and Analyst Meet

HIMTEX 2026

India Refining Summit 2026

India EV Show 2026

EV tech India Expo 2026

Auto Tech Asia 2026
Whitepaper
- Middle East & Africa Commercial Security Market Click here to view more.
- Middle East & Africa Fire Safety Systems & Equipment Market Click here to view more.
- GCC Drone Market Click here to view more.
- Middle East Lighting Fixture Market Click here to view more.
- GCC Physical & Perimeter Security Market Click here to view more.
6WResearch In News
- Doha a strategic location for EV manufacturing hub: IPA Qatar
- Demand for luxury TVs surging in the GCC, says Samsung
- Empowering Growth: The Thriving Journey of Bangladesh’s Cable Industry
- Demand for luxury TVs surging in the GCC, says Samsung
- Video call with a traditional healer? Once unthinkable, it’s now common in South Africa
- Intelligent Buildings To Smooth GCC’s Path To Net Zero