Australia Chelating Agents Market (2026-2032) Outlook | Revenue, Forecast, Analysis, Share, Industry, Growth, Companies, Value, Size & Trends
Market Forecast By Type (Non-biodegradable Chelating Agents, Biodegradable Chelating Agents), By Application (Pulp & Paper, Cleaning, Water Treatment, Agrochemicals, Personal Care, Others) And Competitive Landscape
| Product Code: ETC4476036 | Publication Date: Jul 2023 | Updated Date: Mar 2026 | Product Type: Report | |
| Publisher: 6Wresearch | Author: Dhaval Chaurasia | No. of Pages: 85 | No. of Figures: 45 | No. of Tables: 25 |
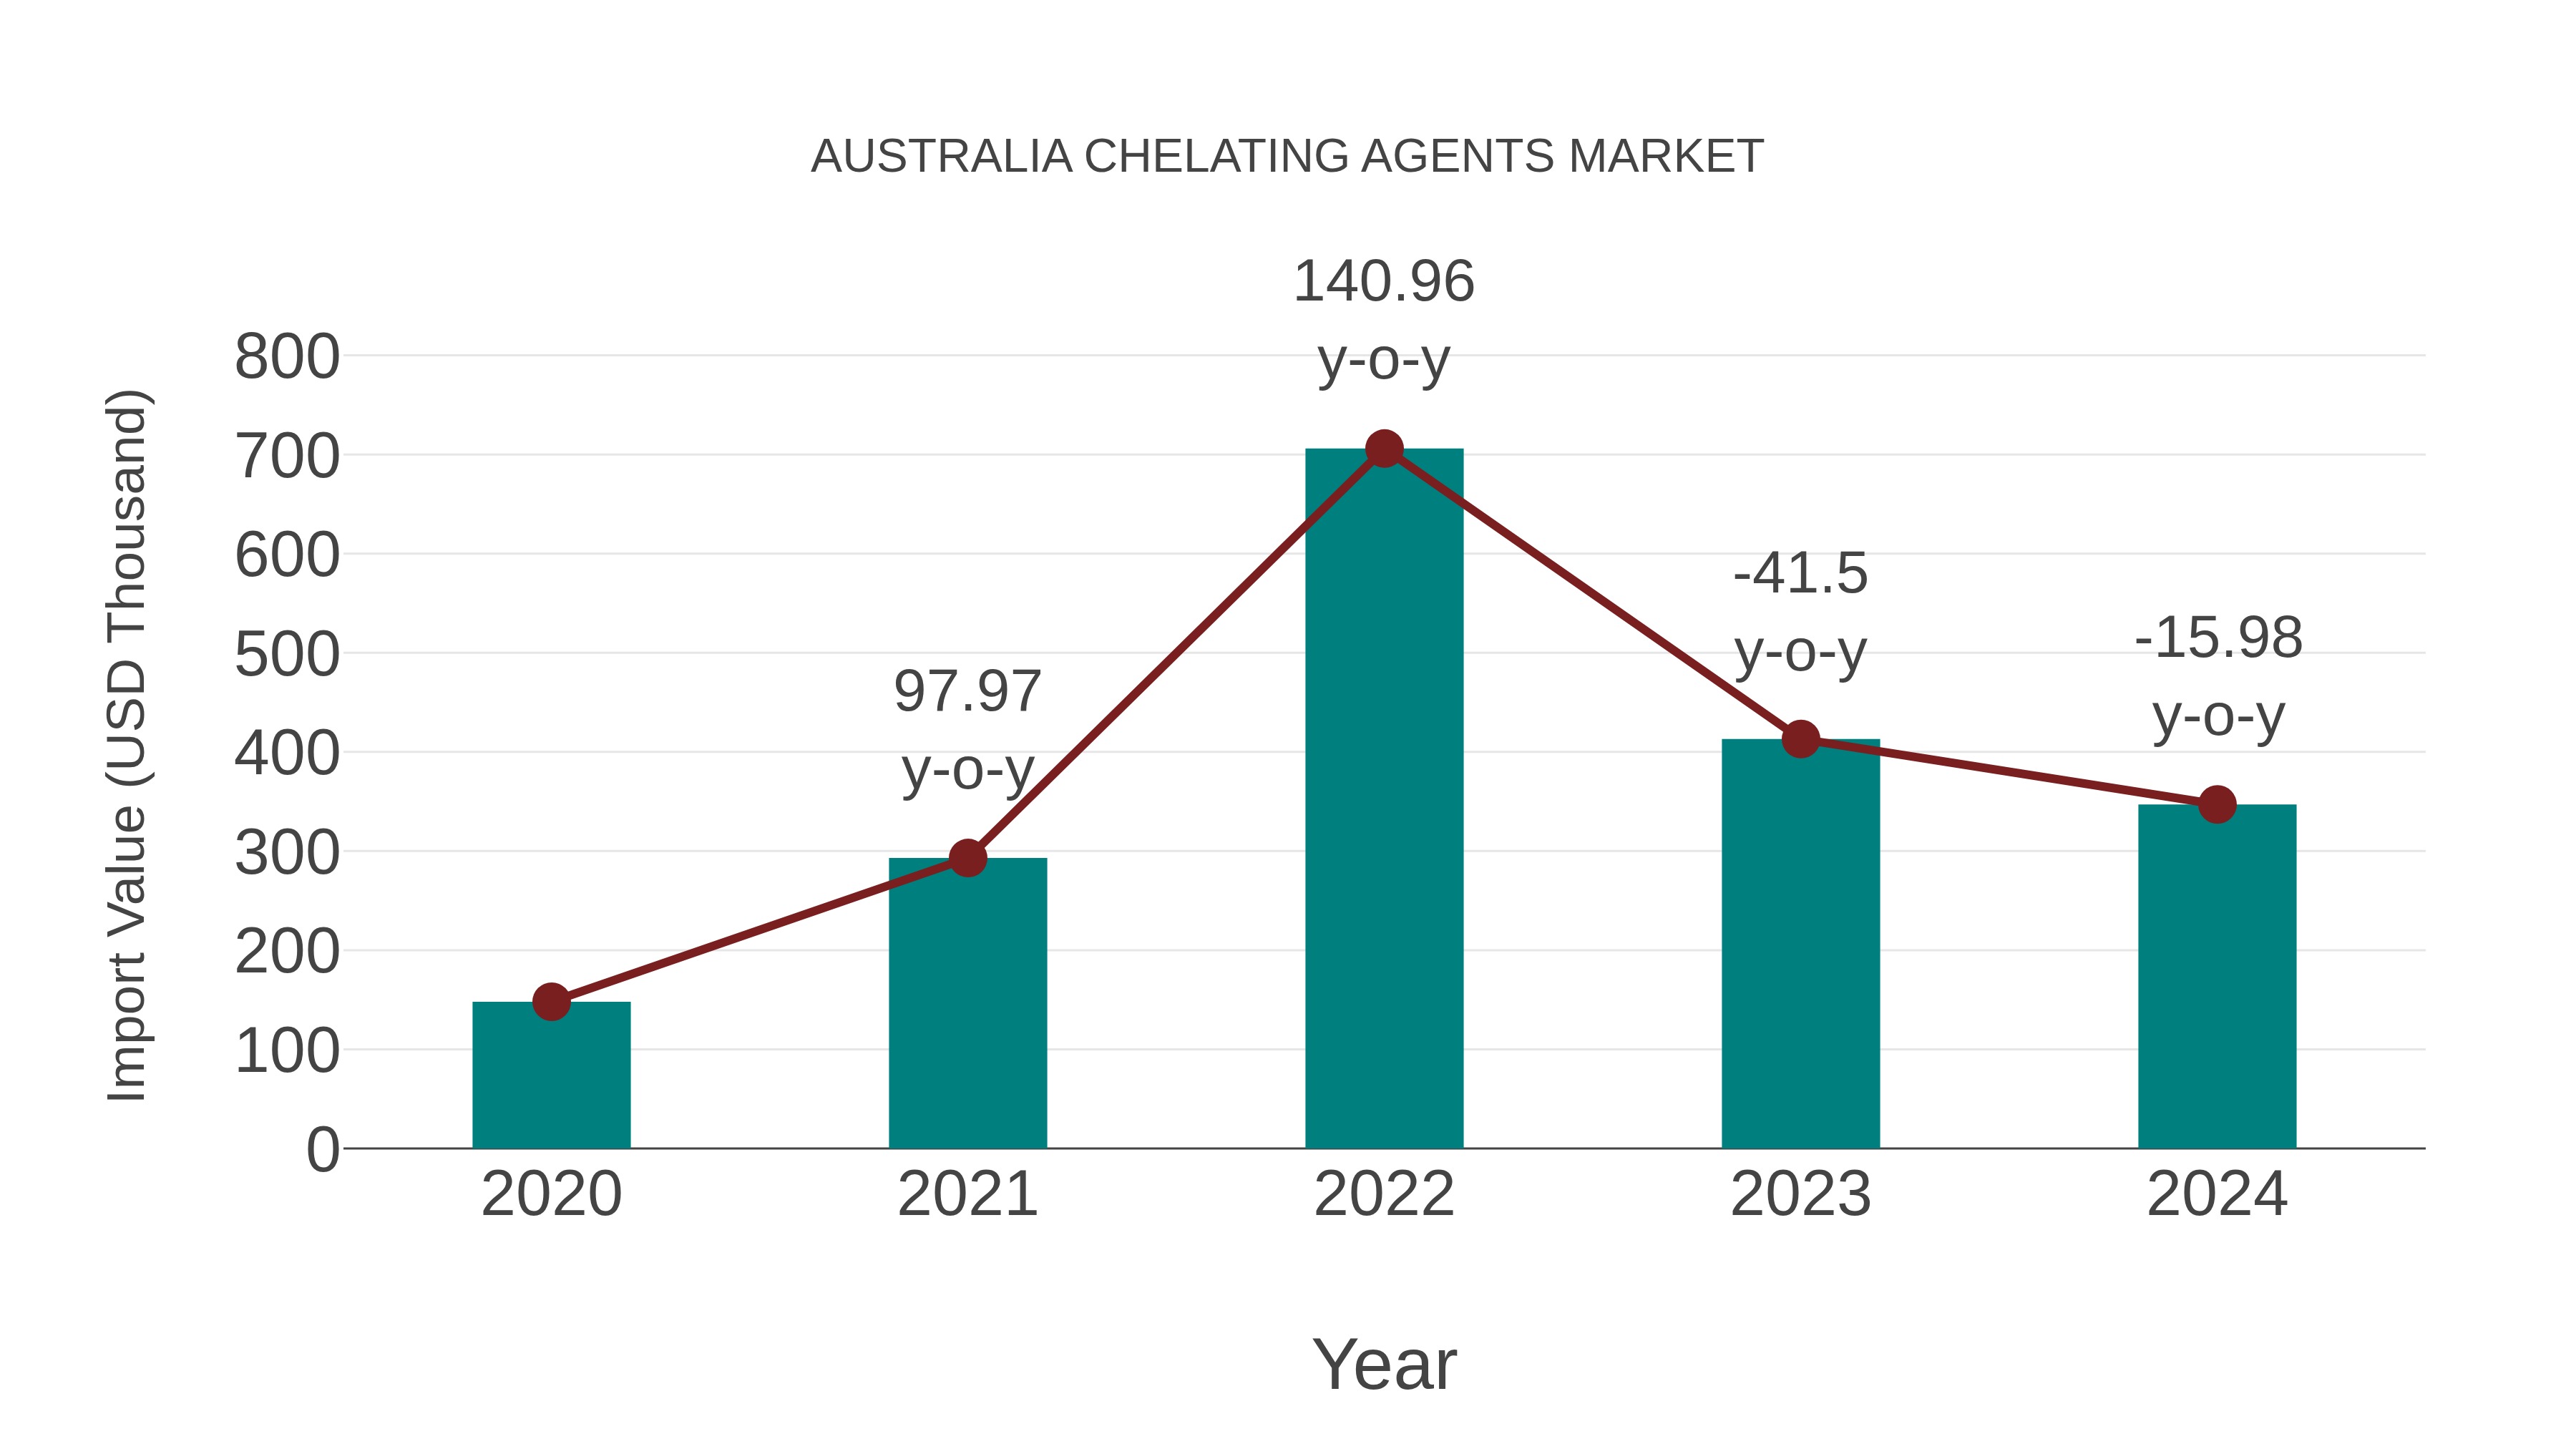
Australia Chelating Agents Market: Import Trend Analysis
Australia`s import trend for chelating agents in 2024 experienced a decline of -15.98% compared to the previous year, with a compound annual growth rate (CAGR) of 23.74% from 2020 to 2024. This negative growth in 2024 may be attributed to shifts in demand dynamics or changes in trade policies impacting import momentum within the market.
Australia Chelating Agents Market Overview
The chelating agents market in Australia serves various industries such as food and beverage, pharmaceuticals, agriculture, and water treatment. Chelating agents are chemical compounds that bind to metal ions, preventing their undesirable interactions and facilitating their removal from solutions. With a focus on metal sequestration, nutrient enhancement, and environmental remediation, chelating agents play essential roles in diverse applications in the Australia market.
Drivers of the market
The Australia Chelating Agents Market is witnessing growth due to factors such as the demand for chelating agents in industrial and household cleaning products, water treatment, and food processing, and the properties of chelating agents such as metal ion sequestration, pH control, and oxidation inhibition. Chelating agents, also known as complexing agents, form stable complexes with metal ions, preventing undesired interactions and improving product performance. With the increasing focus on environmental sustainability, product quality, and process efficiency, the market for chelating agents is expanding in Australia.
Challenges of the market
Challenges in the Australia chelating agents market involve ensuring regulatory compliance for use in food, pharmaceutical, and water treatment applications, addressing environmental concerns related to metal pollution and soil remediation, and optimizing chelator performance for specific metal ions and complex matrices.
Government Policy of the market
Challenges in Australia chelating agents market may include competition from alternative chemical treatments, regulatory constraints, and environmental concerns related to waste disposal. Government initiatives may involve promoting the use of environmentally friendly chelating agents, investing in research and development of novel chelating formulations, and providing incentives for companies to adopt sustainable practices. Additionally, public education campaigns on the benefits of chelating agents in various industrial applications can help drive demand and address challenges in the market.
Key Highlights of the Report:
- Australia Chelating Agents Market Outlook
- Market Size of Australia Chelating Agents Market, 2025
- Forecast of Australia Chelating Agents Market, 2032
- Historical Data and Forecast of Australia Chelating Agents Revenues & Volume for the Period 2022-2032F
- Australia Chelating Agents Market Trend Evolution
- Australia Chelating Agents Market Drivers and Challenges
- Australia Chelating Agents Price Trends
- Australia Chelating Agents Porter's Five Forces
- Australia Chelating Agents Industry Life Cycle
- Historical Data and Forecast of Australia Chelating Agents Market Revenues & Volume By Type for the Period 2022-2032F
- Historical Data and Forecast of Australia Chelating Agents Market Revenues & Volume By Non-biodegradable Chelating Agents for the Period 2022-2032F
- Historical Data and Forecast of Australia Chelating Agents Market Revenues & Volume By Biodegradable Chelating Agents for the Period 2022-2032F
- Historical Data and Forecast of Australia Chelating Agents Market Revenues & Volume By Application for the Period 2022-2032F
- Historical Data and Forecast of Australia Chelating Agents Market Revenues & Volume By Pulp & Paper for the Period 2022-2032F
- Historical Data and Forecast of Australia Chelating Agents Market Revenues & Volume By Cleaning for the Period 2022-2032F
- Historical Data and Forecast of Australia Chelating Agents Market Revenues & Volume By Water Treatment for the Period 2022-2032F
- Historical Data and Forecast of Australia Chelating Agents Market Revenues & Volume By Agrochemicals for the Period 2022-2032F
- Historical Data and Forecast of Australia Chelating Agents Market Revenues & Volume By Personal Care for the Period 2022-2032F
- Historical Data and Forecast of Australia Chelating Agents Market Revenues & Volume By Others for the Period 2022-2032F
- Australia Chelating Agents Import Export Trade Statistics
- Market Opportunity Assessment By Type
- Market Opportunity Assessment By Application
- Australia Chelating Agents Top Companies Market Share
- Australia Chelating Agents Competitive Benchmarking By Technical and Operational Parameters
- Australia Chelating Agents Company Profiles
- Australia Chelating Agents Key Strategic Recommendations
Australia Chelating Agents Market (2026-2032): FAQs
6Wresearch actively monitors the Australia Chelating Agents Market and publishes its comprehensive annual report, highlighting emerging trends, growth drivers, revenue analysis, and forecast outlook. Our insights help businesses to make data-backed strategic decisions with ongoing market dynamics. Our analysts track relevent industries related to the Australia Chelating Agents Market, allowing our clients with actionable intelligence and reliable forecasts tailored to emerging regional needs.
Yes, we provide customisation as per your requirements. To learn more, feel free to contact us on sales@6wresearch.com
1 Executive Summary |
2 Introduction |
2.1 Key Highlights of the Report |
2.2 Report Description |
2.3 Market Scope & Segmentation |
2.4 Research Methodology |
2.5 Assumptions |
3 Australia Chelating Agents Market Overview |
3.1 Australia Country Macro Economic Indicators |
3.2 Australia Chelating Agents Market Revenues & Volume, 2022 & 2032F |
3.3 Australia Chelating Agents Market - Industry Life Cycle |
3.4 Australia Chelating Agents Market - Porter's Five Forces |
3.5 Australia Chelating Agents Market Revenues & Volume Share, By Type, 2022 & 2032F |
3.6 Australia Chelating Agents Market Revenues & Volume Share, By Application, 2022 & 2032F |
4 Australia Chelating Agents Market Dynamics |
4.1 Impact Analysis |
4.2 Market Drivers |
4.2.1 Increasing awareness about environmental protection and sustainability leading to the adoption of eco-friendly chelating agents |
4.2.2 Growing demand for chelating agents in various industries such as agriculture, water treatment, and pharmaceuticals |
4.2.3 Stringent regulations and policies promoting the use of chelating agents to reduce environmental pollution |
4.3 Market Restraints |
4.3.1 Fluctuating prices of raw materials used in chelating agents production impacting profit margins |
4.3.2 Competition from substitute products with similar functionalities affecting market penetration |
5 Australia Chelating Agents Market Trends |
6 Australia Chelating Agents Market, By Types |
6.1 Australia Chelating Agents Market, By Type |
6.1.1 Overview and Analysis |
6.1.2 Australia Chelating Agents Market Revenues & Volume, By Type, 2022-2032F |
6.1.3 Australia Chelating Agents Market Revenues & Volume, By Non-biodegradable Chelating Agents, 2022-2032F |
6.1.4 Australia Chelating Agents Market Revenues & Volume, By Biodegradable Chelating Agents, 2022-2032F |
6.2 Australia Chelating Agents Market, By Application |
6.2.1 Overview and Analysis |
6.2.2 Australia Chelating Agents Market Revenues & Volume, By Pulp & Paper, 2022-2032F |
6.2.3 Australia Chelating Agents Market Revenues & Volume, By Cleaning, 2022-2032F |
6.2.4 Australia Chelating Agents Market Revenues & Volume, By Water Treatment, 2022-2032F |
6.2.5 Australia Chelating Agents Market Revenues & Volume, By Agrochemicals, 2022-2032F |
6.2.6 Australia Chelating Agents Market Revenues & Volume, By Personal Care, 2022-2032F |
6.2.7 Australia Chelating Agents Market Revenues & Volume, By Others, 2022-2032F |
7 Australia Chelating Agents Market Import-Export Trade Statistics |
7.1 Australia Chelating Agents Market Export to Major Countries |
7.2 Australia Chelating Agents Market Imports from Major Countries |
8 Australia Chelating Agents Market Key Performance Indicators |
8.1 Adoption rate of eco-friendly chelating agents in different industries |
8.2 Number of new applications and industries utilizing chelating agents |
8.3 Compliance rate with environmental regulations and policies regarding chelating agents usage |
9 Australia Chelating Agents Market - Opportunity Assessment |
9.1 Australia Chelating Agents Market Opportunity Assessment, By Type, 2022 & 2032F |
9.2 Australia Chelating Agents Market Opportunity Assessment, By Application, 2022 & 2032F |
10 Australia Chelating Agents Market - Competitive Landscape |
10.1 Australia Chelating Agents Market Revenue Share, By Companies, 2025 |
10.2 Australia Chelating Agents Market Competitive Benchmarking, By Operating and Technical Parameters |
11 Company Profiles |
12 Recommendations |
13 Disclaimer |
Global Go To Market Strategy - 2030
Export potential enables firms to identify high-growth global markets with greater confidence by combining advanced trade intelligence with a structured quantitative methodology. The framework analyzes emerging demand trends and country-level import patterns while integrating macroeconomic and trade datasets such as GDP and population forecasts, bilateral import–export flows, tariff structures, elasticity differentials between developed and developing economies, geographic distance, and import demand projections. Using weighted trade values from 2020–2024 as the base period to project country-to-country export potential for 2030, these inputs are operationalized through calculated drivers such as gravity model parameters, tariff impact factors, and projected GDP per-capita growth. Through an analysis of hidden potentials, demand hotspots, and market conditions that are most favorable to success, this method enables firms to focus on target countries, maximize returns, and global expansion with data, backed by accuracy.
By factoring in the projected importer demand gap that is currently unmet and could be potential opportunity, it identifies the potential for the Exporter (Country) among 190 countries, against the general trade analysis, which identifies the biggest importer or exporter.
To discover high-growth global markets and optimize your business strategy:
Click Here
Pricing
- Single User License$ 1,995
- Department License$ 2,400
- Site License$ 3,120
- Global License$ 3,795

Leadership Perspectives from Industry Events
Search
Thought Leadership and Analyst Meet


Our Clients
6WResearch In News
- Doha a strategic location for EV manufacturing hub: IPA Qatar
- Demand for luxury TVs surging in the GCC, says Samsung
- Empowering Growth: The Thriving Journey of Bangladesh’s Cable Industry
- Demand for luxury TVs surging in the GCC, says Samsung
- Video call with a traditional healer? Once unthinkable, it’s now common in South Africa
- Intelligent Buildings To Smooth GCC’s Path To Net Zero
Latest Reports
- Cape Verde Portable Hand-Thrown Extinguisher Market (2026-2032)
- Canada Portable Hand-Thrown Extinguisher Market (2026-2032)
- Cameroon Portable Hand-Thrown Extinguisher Market (2026-2032)
- Burundi Portable Hand-Thrown Extinguisher Market (2026-2032)
- Burkina Faso Portable Hand-Thrown Extinguisher Market (2026-2032)
- Bulgaria Portable Hand-Thrown Extinguisher Market (2026-2032)
- Brunei Portable Hand-Thrown Extinguisher Market (2026-2032)
- Botswana Portable Hand-Thrown Extinguisher Market (2026-2032)
- Bosnia and Herzegovina Portable Hand-Thrown Extinguisher Market (2026-2032)
- Bolivia Portable Hand-Thrown Extinguisher Market (2026-2032)
Industry Events and Analyst Meet

HIMTEX 2026

India Refining Summit 2026

India EV Show 2026

EV tech India Expo 2026

Auto Tech Asia 2026
Whitepaper
- Middle East & Africa Commercial Security Market Click here to view more.
- Middle East & Africa Fire Safety Systems & Equipment Market Click here to view more.
- GCC Drone Market Click here to view more.
- Middle East Lighting Fixture Market Click here to view more.
- GCC Physical & Perimeter Security Market Click here to view more.