Australia Chemical Protective Clothing Market (2026-2032) Outlook | Share, Growth, Forecast, Value, Companies, Revenue, Industry, Analysis, Trends & Size
Market Forecast By Type (Aramid & Blends, PBI, Polyamide, Cotton Fibers, Laminated Polyester, Polyolefin & Blends, UHMW Polyethylene, Others), By End Use Industry (Construction & Manufacturing, Oil & Gas, Healthcare/Medical, Firefighting & Law Enforcement, Mining, Military, Others), By User Type (Industrial, Personal) And Competitive Landscape
| Product Code: ETC4513356 | Publication Date: Jul 2023 | Updated Date: Mar 2026 | Product Type: Report | |
| Publisher: 6Wresearch | Author: Dhaval Chaurasia | No. of Pages: 85 | No. of Figures: 45 | No. of Tables: 25 |
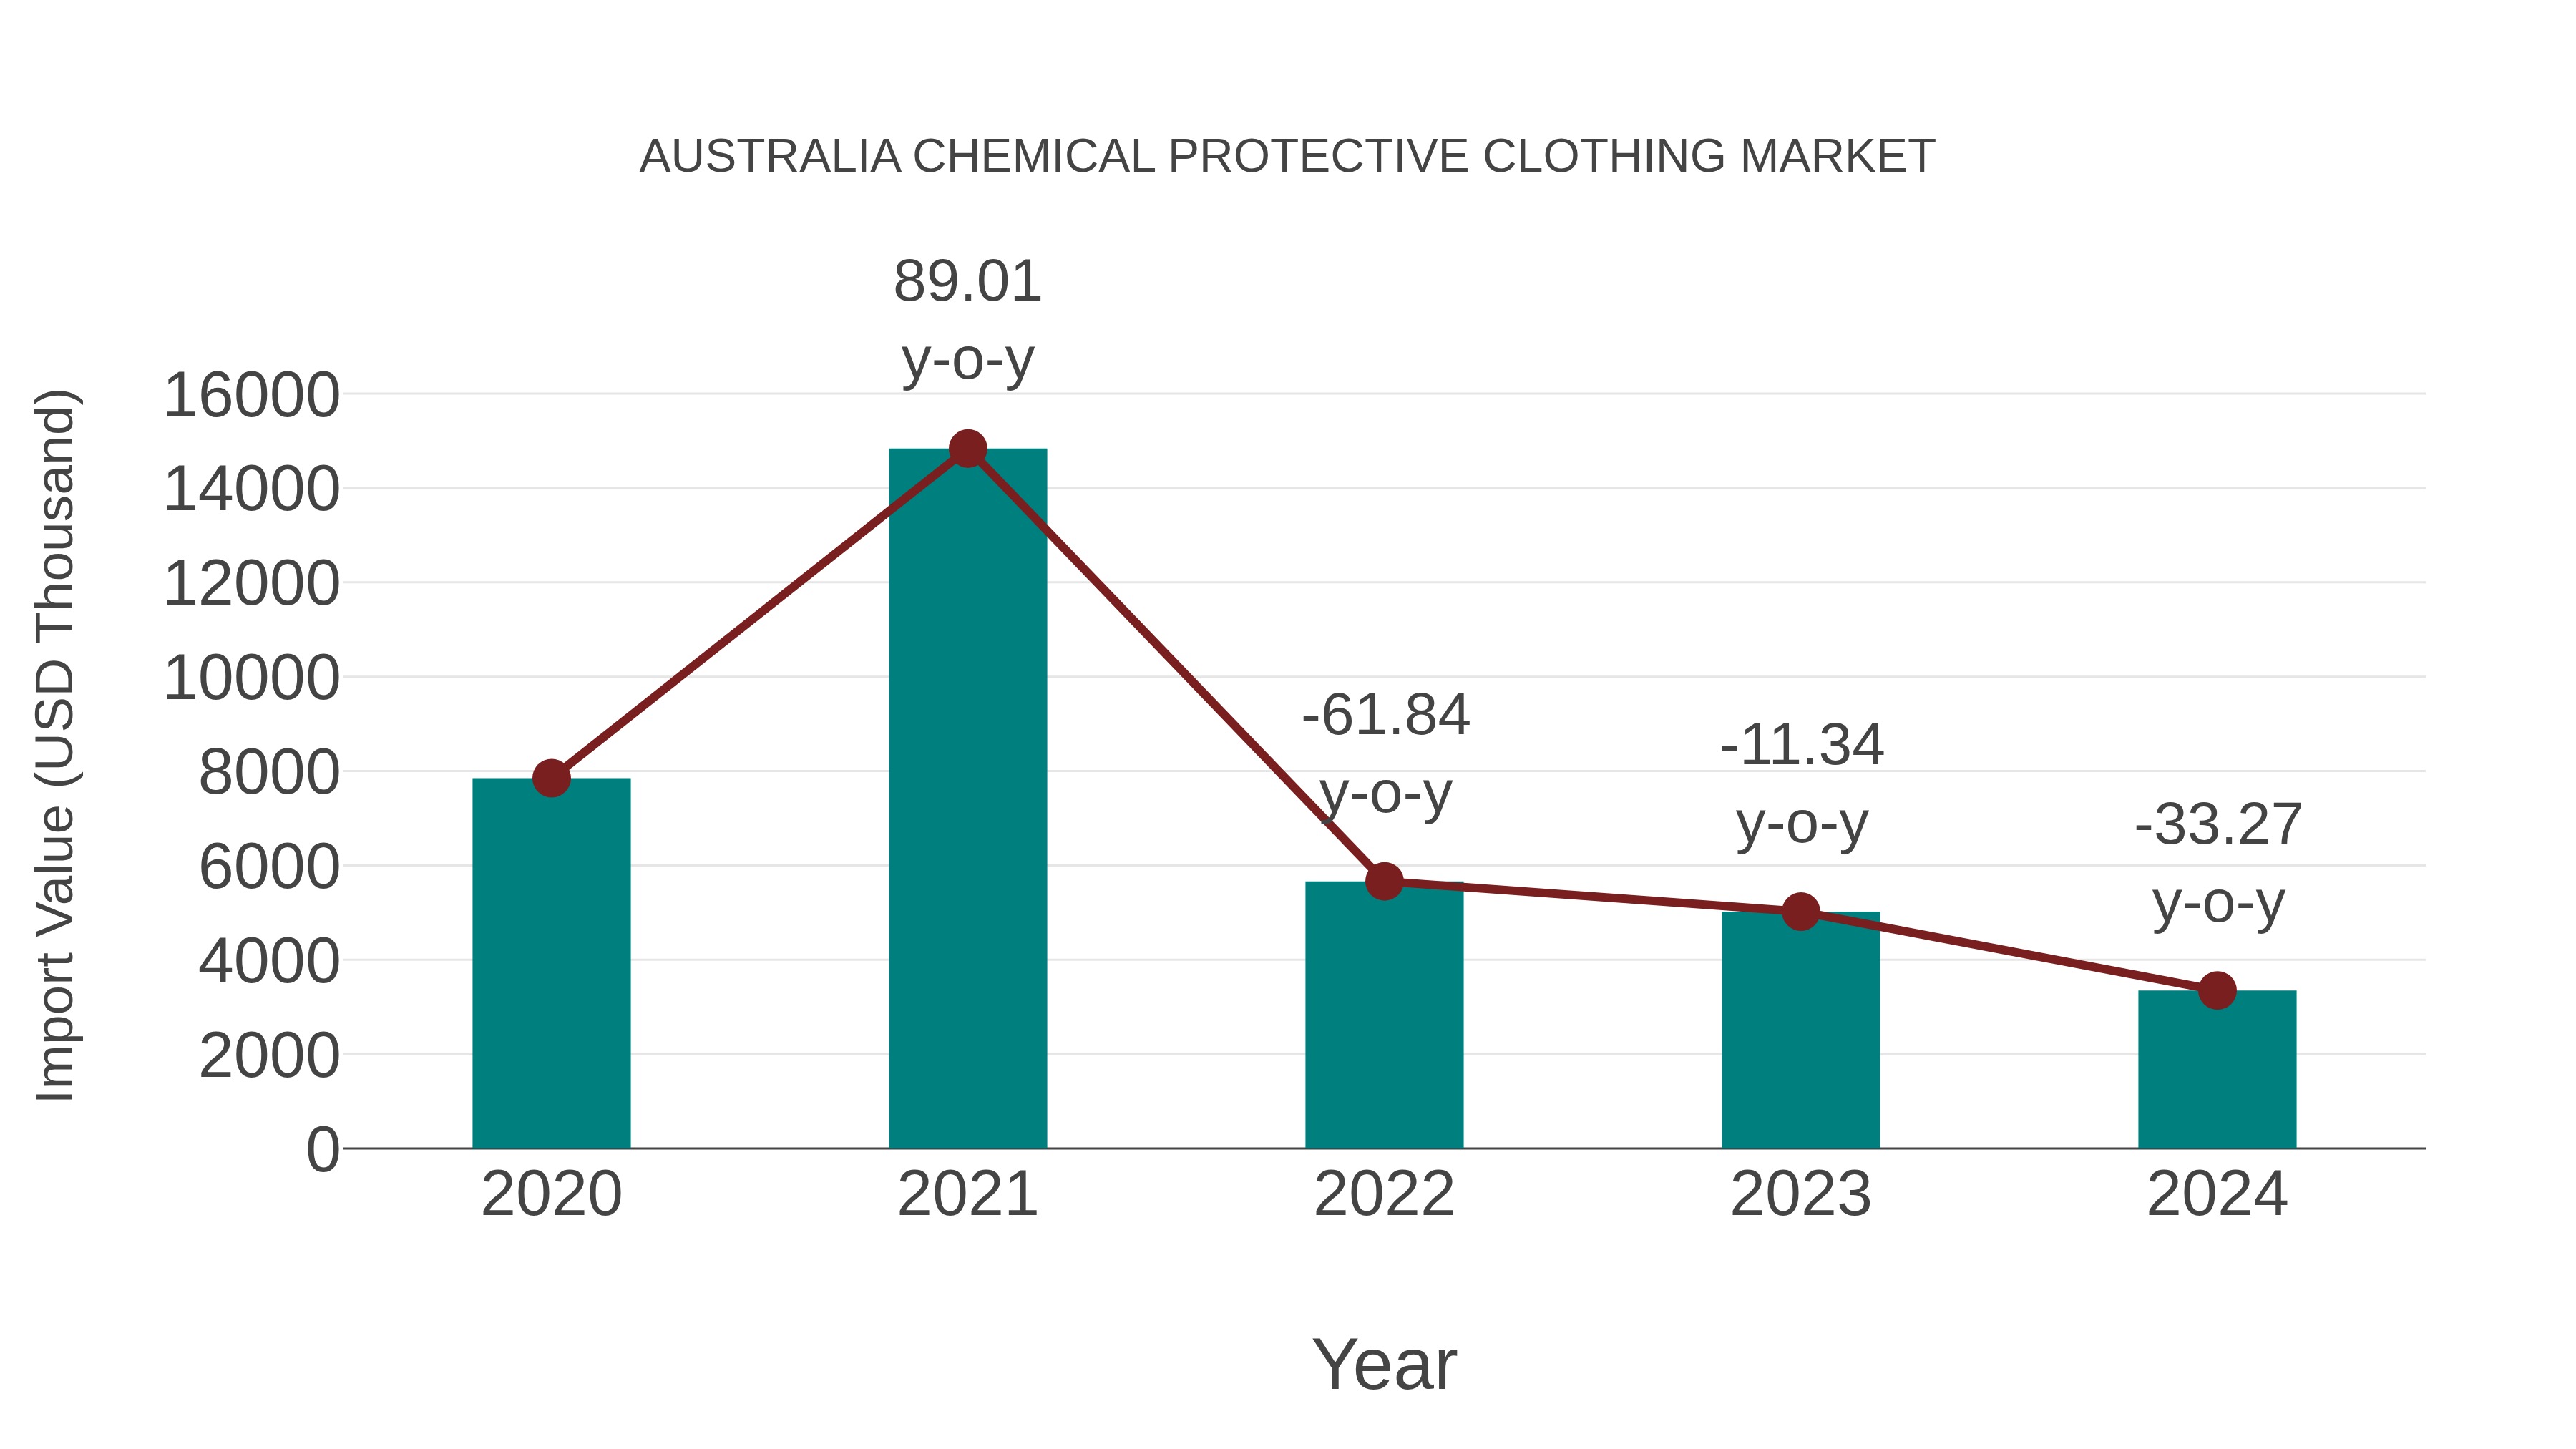
Australia Chemical Protective Clothing Market: Import Trend Analysis
In the Australia chemical protective clothing market, the import trend experienced a notable decline from 2023 to 2024, with a growth rate of -33.27%. The compound annual growth rate (CAGR) for the period 2020-2024 stood at -19.18%. This significant downturn could be attributed to shifts in demand dynamics or changes in trade policies impacting import momentum.
Australia Chemical Protective Clothing Market Overview
Australia chemical protective clothing market serves industries such as chemicals, petrochemicals, manufacturing, and emergency response, offering personal protective equipment (PPE) for workers exposed to hazardous substances. Chemical protective clothing provides barrier protection against chemical splashes, spills, and airborne contaminants, ensuring worker safety and health. With a focus on comfort, durability, and compliance with safety standards, chemical protective clothing manufacturers address the evolving needs of industrial workplaces in Australia.
Drivers of the market
The Australia Chemical Protective Clothing Market is driven by factors such as the stringent occupational safety regulations, the need for personal protective equipment (PPE) in hazardous work environments, and the growth of industries such as chemical processing, oil and gas, and healthcare. Chemical protective clothing provides protection against chemical hazards, toxic substances, and biological contaminants, ensuring the safety and health of workers. With the emphasis on workplace safety, risk mitigation, and employee welfare, the market for chemical protective clothing is expanding in Australia.
Challenges of the market
In Australia, the chemical protective clothing market faces challenges such as ensuring compliance with safety regulations and standards, developing innovative materials for enhanced protection and comfort, and addressing the need for customization to suit various industrial applications and hazardous environments.
Government Policy of the market
In Australia, the chemical protective clothing market faces challenges such as technological limitations, cost constraints, and compliance with safety standards. Government initiatives may involve providing subsidies or grants for the adoption of chemical-resistant clothing by workers in hazardous environments, funding research and development in advanced protective materials, and promoting training programs on proper garment use and maintenance. Additionally, regulations mandating the use of protective clothing in certain industries can drive market demand and ensure worker safety.
Key Highlights of the Report:
- Australia Chemical Protective Clothing Market Outlook
- Market Size of Australia Chemical Protective Clothing Market, 2025
- Forecast of Australia Chemical Protective Clothing Market, 2032
- Historical Data and Forecast of Australia Chemical Protective Clothing Revenues & Volume for the Period 2022-2032F
- Australia Chemical Protective Clothing Market Trend Evolution
- Australia Chemical Protective Clothing Market Drivers and Challenges
- Australia Chemical Protective Clothing Price Trends
- Australia Chemical Protective Clothing Porter's Five Forces
- Australia Chemical Protective Clothing Industry Life Cycle
- Historical Data and Forecast of Australia Chemical Protective Clothing Market Revenues & Volume By Type for the Period 2022-2032F
- Historical Data and Forecast of Australia Chemical Protective Clothing Market Revenues & Volume By Aramid & Blends for the Period 2022-2032F
- Historical Data and Forecast of Australia Chemical Protective Clothing Market Revenues & Volume By PBI for the Period 2022-2032F
- Historical Data and Forecast of Australia Chemical Protective Clothing Market Revenues & Volume By Polyamide for the Period 2022-2032F
- Historical Data and Forecast of Australia Chemical Protective Clothing Market Revenues & Volume By Cotton Fibers for the Period 2022-2032F
- Historical Data and Forecast of Australia Chemical Protective Clothing Market Revenues & Volume By Laminated Polyester for the Period 2022-2032F
- Historical Data and Forecast of Australia Chemical Protective Clothing Market Revenues & Volume By Polyolefin & Blends for the Period 2022-2032F
- Historical Data and Forecast of Australia Chemical Protective Clothing Market Revenues & Volume By UHMW Polyethylene for the Period 2022-2032F
- Historical Data and Forecast of Australia Aramid & Blends Chemical Protective Clothing Market Revenues & Volume By Others for the Period 2022-2032F
- Historical Data and Forecast of Australia Chemical Protective Clothing Market Revenues & Volume By End Use Industry for the Period 2022-2032F
- Historical Data and Forecast of Australia Chemical Protective Clothing Market Revenues & Volume By Construction & Manufacturing for the Period 2022-2032F
- Historical Data and Forecast of Australia Chemical Protective Clothing Market Revenues & Volume By Oil & Gas for the Period 2022-2032F
- Historical Data and Forecast of Australia Chemical Protective Clothing Market Revenues & Volume By Healthcare/Medical for the Period 2022-2032F
- Historical Data and Forecast of Australia Chemical Protective Clothing Market Revenues & Volume By Firefighting & Law Enforcement for the Period 2022-2032F
- Historical Data and Forecast of Australia Chemical Protective Clothing Market Revenues & Volume By Mining for the Period 2022-2032F
- Historical Data and Forecast of Australia Chemical Protective Clothing Market Revenues & Volume By Military for the Period 2022-2032F
- Historical Data and Forecast of Australia Chemical Protective Clothing Market Revenues & Volume By Others for the Period 2022-2032F
- Historical Data and Forecast of Australia Chemical Protective Clothing Market Revenues & Volume By User Type for the Period 2022-2032F
- Historical Data and Forecast of Australia Chemical Protective Clothing Market Revenues & Volume By Industrial for the Period 2022-2032F
- Historical Data and Forecast of Australia Chemical Protective Clothing Market Revenues & Volume By Personal for the Period 2022-2032F
- Australia Chemical Protective Clothing Import Export Trade Statistics
- Market Opportunity Assessment By Type
- Market Opportunity Assessment By End Use Industry
- Market Opportunity Assessment By User Type
- Australia Chemical Protective Clothing Top Companies Market Share
- Australia Chemical Protective Clothing Competitive Benchmarking By Technical and Operational Parameters
- Australia Chemical Protective Clothing Company Profiles
- Australia Chemical Protective Clothing Key Strategic Recommendations
Australia Chemical Protective Clothing Market (2026-2032): FAQs
6Wresearch actively monitors the Australia Chemical Protective Clothing Market and publishes its comprehensive annual report, highlighting emerging trends, growth drivers, revenue analysis, and forecast outlook. Our insights help businesses to make data-backed strategic decisions with ongoing market dynamics. Our analysts track relevent industries related to the Australia Chemical Protective Clothing Market, allowing our clients with actionable intelligence and reliable forecasts tailored to emerging regional needs.
Yes, we provide customisation as per your requirements. To learn more, feel free to contact us on sales@6wresearch.com
1 Executive Summary |
2 Introduction |
2.1 Key Highlights of the Report |
2.2 Report Description |
2.3 Market Scope & Segmentation |
2.4 Research Methodology |
2.5 Assumptions |
3 Australia Chemical Protective Clothing Market Overview |
3.1 Australia Country Macro Economic Indicators |
3.2 Australia Chemical Protective Clothing Market Revenues & Volume, 2022 & 2032F |
3.3 Australia Chemical Protective Clothing Market - Industry Life Cycle |
3.4 Australia Chemical Protective Clothing Market - Porter's Five Forces |
3.5 Australia Chemical Protective Clothing Market Revenues & Volume Share, By Type, 2022 & 2032F |
3.6 Australia Chemical Protective Clothing Market Revenues & Volume Share, By End Use Industry, 2022 & 2032F |
3.7 Australia Chemical Protective Clothing Market Revenues & Volume Share, By User Type, 2022 & 2032F |
4 Australia Chemical Protective Clothing Market Dynamics |
4.1 Impact Analysis |
4.2 Market Drivers |
4.2.1 Increasing awareness about workplace safety regulations |
4.2.2 Growing demand for chemical protective clothing in industries like healthcare, manufacturing, and mining |
4.3 Market Restraints |
4.3.1 High initial cost of specialized chemical protective clothing |
4.3.2 Limited availability of advanced protective clothing technologies |
5 Australia Chemical Protective Clothing Market Trends |
6 Australia Chemical Protective Clothing Market, By Types |
6.1 Australia Chemical Protective Clothing Market, By Type |
6.1.1 Overview and Analysis |
6.1.2 Australia Chemical Protective Clothing Market Revenues & Volume, By Type, 2022-2032F |
6.1.3 Australia Chemical Protective Clothing Market Revenues & Volume, By Aramid & Blends, 2022-2032F |
6.1.4 Australia Chemical Protective Clothing Market Revenues & Volume, By PBI, 2022-2032F |
6.1.5 Australia Chemical Protective Clothing Market Revenues & Volume, By Polyamide, 2022-2032F |
6.1.6 Australia Chemical Protective Clothing Market Revenues & Volume, By Cotton Fibers, 2022-2032F |
6.1.7 Australia Chemical Protective Clothing Market Revenues & Volume, By Laminated Polyester, 2022-2032F |
6.1.8 Australia Chemical Protective Clothing Market Revenues & Volume, By Polyolefin & Blends, 2022-2032F |
6.1.9 Australia Chemical Protective Clothing Market Revenues & Volume, By Others, 2022-2032F |
6.1.10 Australia Chemical Protective Clothing Market Revenues & Volume, By Others, 2022-2032F |
6.2 Australia Chemical Protective Clothing Market, By End Use Industry |
6.2.1 Overview and Analysis |
6.2.2 Australia Chemical Protective Clothing Market Revenues & Volume, By Construction & Manufacturing, 2022-2032F |
6.2.3 Australia Chemical Protective Clothing Market Revenues & Volume, By Oil & Gas, 2022-2032F |
6.2.4 Australia Chemical Protective Clothing Market Revenues & Volume, By Healthcare/Medical, 2022-2032F |
6.2.5 Australia Chemical Protective Clothing Market Revenues & Volume, By Firefighting & Law Enforcement, 2022-2032F |
6.2.6 Australia Chemical Protective Clothing Market Revenues & Volume, By Mining, 2022-2032F |
6.2.7 Australia Chemical Protective Clothing Market Revenues & Volume, By Military, 2022-2032F |
6.3 Australia Chemical Protective Clothing Market, By User Type |
6.3.1 Overview and Analysis |
6.3.2 Australia Chemical Protective Clothing Market Revenues & Volume, By Industrial, 2022-2032F |
6.3.3 Australia Chemical Protective Clothing Market Revenues & Volume, By Personal, 2022-2032F |
7 Australia Chemical Protective Clothing Market Import-Export Trade Statistics |
7.1 Australia Chemical Protective Clothing Market Export to Major Countries |
7.2 Australia Chemical Protective Clothing Market Imports from Major Countries |
8 Australia Chemical Protective Clothing Market Key Performance Indicators |
8.1 Number of workplace accidents related to chemical exposure |
8.2 Adoption rate of advanced chemical protective clothing technologies |
8.3 Number of regulatory compliance checks passed by companies using chemical protective clothing |
9 Australia Chemical Protective Clothing Market - Opportunity Assessment |
9.1 Australia Chemical Protective Clothing Market Opportunity Assessment, By Type, 2022 & 2032F |
9.2 Australia Chemical Protective Clothing Market Opportunity Assessment, By End Use Industry, 2022 & 2032F |
9.3 Australia Chemical Protective Clothing Market Opportunity Assessment, By User Type, 2022 & 2032F |
10 Australia Chemical Protective Clothing Market - Competitive Landscape |
10.1 Australia Chemical Protective Clothing Market Revenue Share, By Companies, 2025 |
10.2 Australia Chemical Protective Clothing Market Competitive Benchmarking, By Operating and Technical Parameters |
11 Company Profiles |
12 Recommendations |
13 Disclaimer |
Global Go To Market Strategy - 2030
Export potential enables firms to identify high-growth global markets with greater confidence by combining advanced trade intelligence with a structured quantitative methodology. The framework analyzes emerging demand trends and country-level import patterns while integrating macroeconomic and trade datasets such as GDP and population forecasts, bilateral import–export flows, tariff structures, elasticity differentials between developed and developing economies, geographic distance, and import demand projections. Using weighted trade values from 2020–2024 as the base period to project country-to-country export potential for 2030, these inputs are operationalized through calculated drivers such as gravity model parameters, tariff impact factors, and projected GDP per-capita growth. Through an analysis of hidden potentials, demand hotspots, and market conditions that are most favorable to success, this method enables firms to focus on target countries, maximize returns, and global expansion with data, backed by accuracy.
By factoring in the projected importer demand gap that is currently unmet and could be potential opportunity, it identifies the potential for the Exporter (Country) among 190 countries, against the general trade analysis, which identifies the biggest importer or exporter.
To discover high-growth global markets and optimize your business strategy:
Click Here
Pricing
- Single User License$ 1,995
- Department License$ 2,400
- Site License$ 3,120
- Global License$ 3,795

Leadership Perspectives from Industry Events
Search
Thought Leadership and Analyst Meet


Our Clients
6WResearch In News
- India Export Attractiveness Tracker 2026
- India Air Conditioner Market Set for Strong Rebound in 2026 After Weather-Led Correction and GST-Driven Recovery: 6Wresearch
- ADAS in India: How Automatic Emergency Braking, Blind Spot Detection & Driver Monitoring are Transforming Road Safety
- Doha a strategic location for EV manufacturing hub: IPA Qatar
- Demand for luxury TVs surging in the GCC, says Samsung
- Empowering Growth: The Thriving Journey of Bangladesh’s Cable Industry
Latest Reports
- Qatar Access and Home Network Market (2026-2032)
- Nicaragua RPG Gaming Market (2026-2032)
- New Zealand RPG Gaming Market (2026-2032)
- Netherlands RPG Gaming Market (2026-2032)
- Nauru RPG Gaming Market (2026-2032)
- Namibia RPG Gaming Market (2026-2032)
- Mozambique RPG Gaming Market (2026-2032)
- Montenegro RPG Gaming Market (2026-2032)
- Mongolia RPG Gaming Market (2026-2032)
- Monaco RPG Gaming Market (2026-2032)
Industry Events and Analyst Meet

EV India Expo 2026

HIMTEX 2026

India Refining Summit 2026

India EV Show 2026

EV tech India Expo 2026
Whitepaper
- Middle East & Africa Commercial Security Market Click here to view more.
- Middle East & Africa Fire Safety Systems & Equipment Market Click here to view more.
- GCC Drone Market Click here to view more.
- Middle East Lighting Fixture Market Click here to view more.
- GCC Physical & Perimeter Security Market Click here to view more.