Australia Copper Slag Market (2026-2032) Outlook | Value, Share, Trends, Analysis, Revenue, Growth, Forecast, Companies, Industry, Size
Market Forecast By Grain Size (0-1.0mm, 1.1-2.0mm, > 2.0 mm), By Application (Blasting Agent, Concrete Filler, Colorant, Others) And Competitive Landscape
| Product Code: ETC226115 | Publication Date: Aug 2022 | Updated Date: Mar 2026 | Product Type: Market Research Report | |
| Publisher: 6Wresearch | Author: Ravi Bhandari | No. of Pages: 75 | No. of Figures: 35 | No. of Tables: 20 |
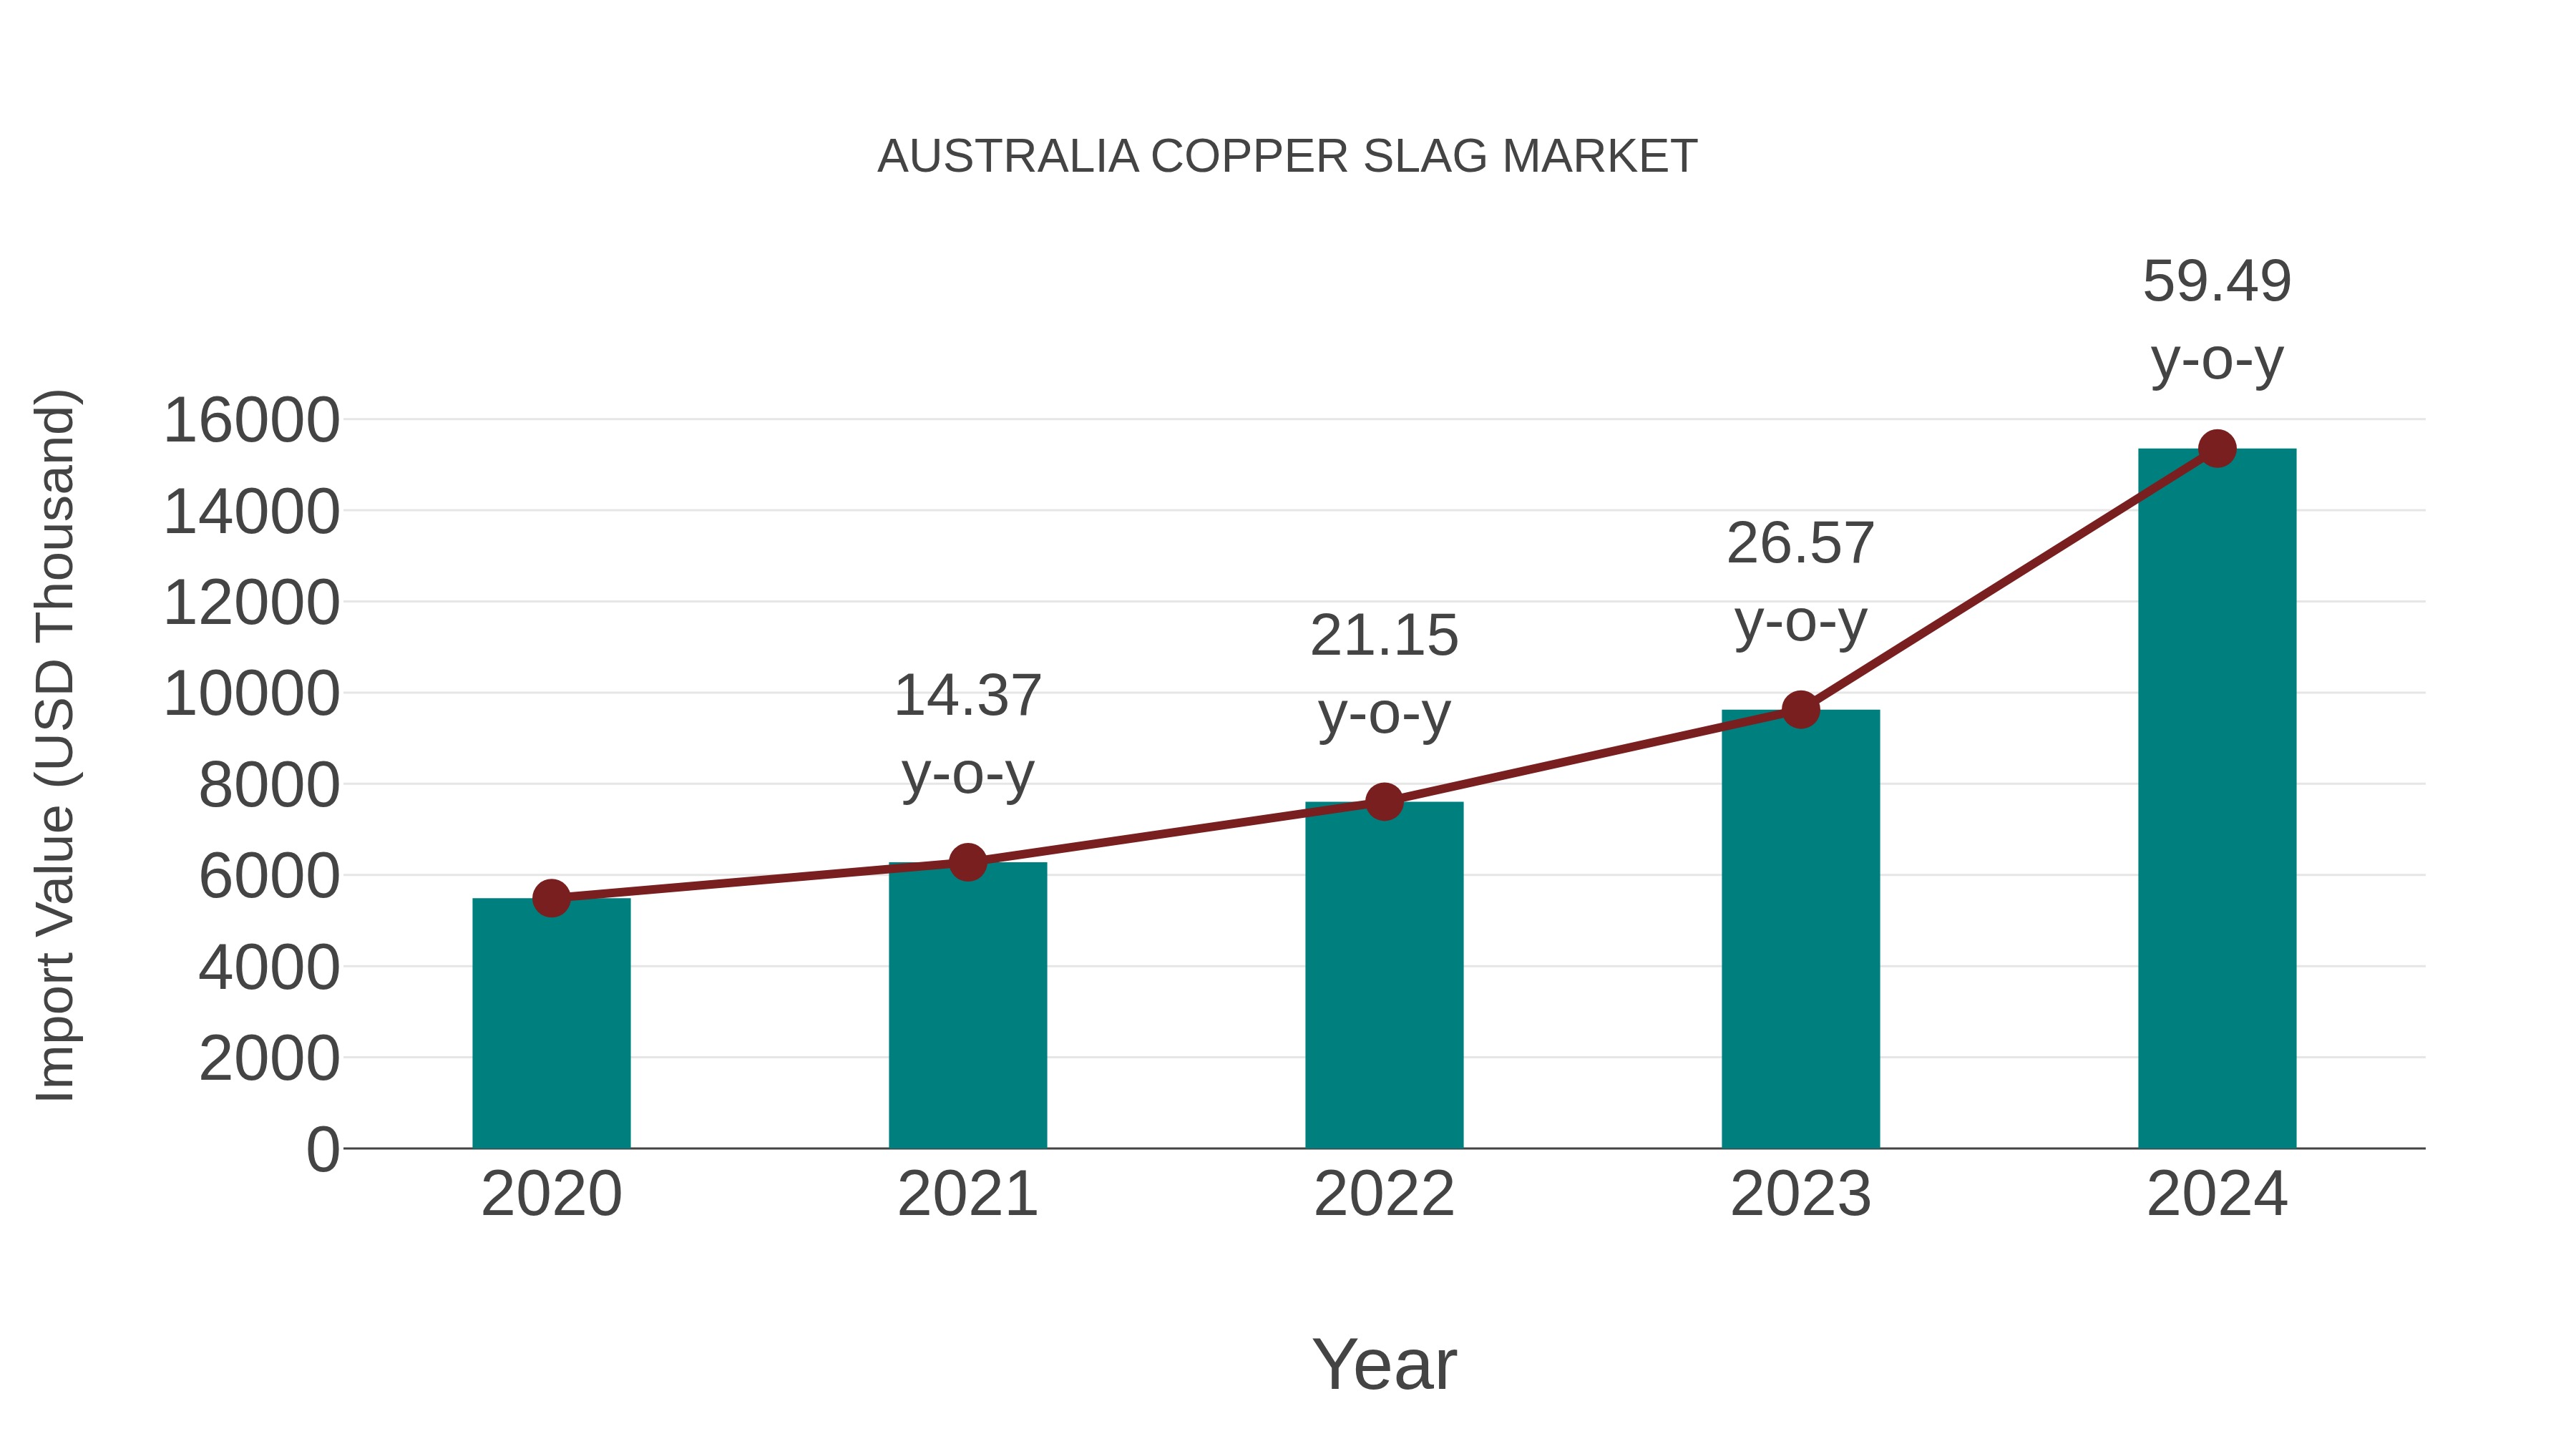
Australia Copper Slag Market: Import Trend Analysis
Australia`s import trend for copper slag in 2024 showed a significant growth rate of 59.49% compared to the previous year, with a compound annual growth rate (CAGR) of 29.32% from 2020 to 2024. This surge in imports can be attributed to a notable demand shift in the market, indicating a strong import momentum and potentially signaling evolving trade dynamics or increased industrial activity during that period.
Australia Copper Slag Market Overview
In Australia, the Copper Slag market is witnessing significant growth, propelled by the increasing utilization of copper slag in construction, abrasive blasting, and road construction applications. Copper slag, a byproduct of copper smelting and refining processes, is valued for its high abrasion resistance and environmental benefits as a sustainable alternative to traditional abrasives. Factors such as infrastructure development projects, the construction industry`s focus on sustainability, and the growing demand for cost-effective abrasive materials are driving market expansion. Moreover, advancements in processing technologies and the recycling of copper slag are creating new growth opportunities in the market.
Drivers of the market
In Australia, the Copper Slag market is growing, fueled by its widespread use in construction and abrasive applications. Copper slag, a byproduct of copper production, possesses properties that make it suitable for use as a blasting abrasive and aggregate in concrete. The construction industry`s steady growth and infrastructure development projects drive demand for copper slag in Australia. Furthermore, its eco-friendly nature, as it is a recycled material, enhances its appeal in sustainability-focused construction practices, further boosting market growth.
Challenges of the market
In the copper slag market, challenges include finding sustainable solutions for managing and disposing of slag waste generated during copper smelting processes. Environmental regulations and community concerns regarding the impact of slag disposal on soil and water quality necessitate innovative approaches to waste management in this industry.
Government Policy of the market
The Australia Copper Slag market operates under government policies concerning mining, waste management, and environmental protection. Mining regulations govern the extraction of copper ore, which produces copper slag as a byproduct. The Australia government enforces guidelines for responsible mining practices to minimize environmental impact and ensure worker safety. Additionally, regulations regarding waste management dictate proper disposal or recycling of copper slag to mitigate environmental risks. Environmental protection policies also mandate measures for controlling emissions and preventing contamination during copper slag processing.
Key Highlights of the Report:
- Australia Copper Slag Market Outlook
- Market Size of Australia Copper Slag Market, 2025
- Forecast of Australia Copper Slag Market, 2032
- Historical Data and Forecast of Australia Copper Slag Revenues & Volume for the Period 2022-2032F
- Australia Copper Slag Market Trend Evolution
- Australia Copper Slag Market Drivers and Challenges
- Australia Copper Slag Price Trends
- Australia Copper Slag Porter's Five Forces
- Australia Copper Slag Industry Life Cycle
- Historical Data and Forecast of Australia Copper Slag Market Revenues & Volume By Grain Size for the Period 2022-2032F
- Historical Data and Forecast of Australia Copper Slag Market Revenues & Volume By 0-1.0mm for the Period 2022-2032F
- Historical Data and Forecast of Australia Copper Slag Market Revenues & Volume By 1.1-2.0mm for the Period 2022-2032F
- Historical Data and Forecast of Australia Copper Slag Market Revenues & Volume By > 2.0 mm for the Period 2022-2032F
- Historical Data and Forecast of Australia Copper Slag Market Revenues & Volume By Application for the Period 2022-2032F
- Historical Data and Forecast of Australia Copper Slag Market Revenues & Volume By Blasting Agent for the Period 2022-2032F
- Historical Data and Forecast of Australia Copper Slag Market Revenues & Volume By Concrete Filler for the Period 2022-2032F
- Historical Data and Forecast of Australia Copper Slag Market Revenues & Volume By Colorant for the Period 2022-2032F
- Historical Data and Forecast of Australia Copper Slag Market Revenues & Volume By Others for the Period 2022-2032F
- Australia Copper Slag Import Export Trade Statistics
- Market Opportunity Assessment By Grain Size
- Market Opportunity Assessment By Application
- Australia Copper Slag Top Companies Market Share
- Australia Copper Slag Competitive Benchmarking By Technical and Operational Parameters
- Australia Copper Slag Company Profiles
- Australia Copper Slag Key Strategic Recommendations
Australia Copper Slag Market (2026-2032): FAQs
6Wresearch actively monitors the Australia Copper Slag Market and publishes its comprehensive annual report, highlighting emerging trends, growth drivers, revenue analysis, and forecast outlook. Our insights help businesses to make data-backed strategic decisions with ongoing market dynamics. Our analysts track relevent industries related to the Australia Copper Slag Market, allowing our clients with actionable intelligence and reliable forecasts tailored to emerging regional needs.
Yes, we provide customisation as per your requirements. To learn more, feel free to contact us on sales@6wresearch.com
1 Executive Summary |
2 Introduction |
2.1 Key Highlights of the Report |
2.2 Report Description |
2.3 Market Scope & Segmentation |
2.4 Research Methodology |
2.5 Assumptions |
3 Australia Copper Slag Market Overview |
3.1 Australia Country Macro Economic Indicators |
3.2 Australia Copper Slag Market Revenues & Volume, 2022 & 2032F |
3.3 Australia Copper Slag Market - Industry Life Cycle |
3.4 Australia Copper Slag Market - Porter's Five Forces |
3.5 Australia Copper Slag Market Revenues & Volume Share, By Grain Size, 2022 & 2032F |
3.6 Australia Copper Slag Market Revenues & Volume Share, By Application, 2022 & 2032F |
4 Australia Copper Slag Market Dynamics |
4.1 Impact Analysis |
4.2 Market Drivers |
4.2.1 Increasing demand for copper slag in construction and infrastructure projects |
4.2.2 Growing awareness about the benefits of using copper slag in various industries |
4.2.3 Government initiatives promoting the use of sustainable materials like copper slag |
4.3 Market Restraints |
4.3.1 Fluctuating prices of raw materials impacting the production cost of copper slag |
4.3.2 Environmental concerns related to the disposal of copper slag waste |
4.3.3 Competition from alternative materials in the market |
5 Australia Copper Slag Market Trends |
6 Australia Copper Slag Market, By Types |
6.1 Australia Copper Slag Market, By Grain Size |
6.1.1 Overview and Analysis |
6.1.2 Australia Copper Slag Market Revenues & Volume, By Grain Size, 2022-2032F |
6.1.3 Australia Copper Slag Market Revenues & Volume, By 0-1.0mm, 2022-2032F |
6.1.4 Australia Copper Slag Market Revenues & Volume, By 1.1-2.0mm, 2022-2032F |
6.1.5 Australia Copper Slag Market Revenues & Volume, By > 2.0 mm, 2022-2032F |
6.2 Australia Copper Slag Market, By Application |
6.2.1 Overview and Analysis |
6.2.2 Australia Copper Slag Market Revenues & Volume, By Blasting Agent, 2022-2032F |
6.2.3 Australia Copper Slag Market Revenues & Volume, By Concrete Filler, 2022-2032F |
6.2.4 Australia Copper Slag Market Revenues & Volume, By Colorant, 2022-2032F |
6.2.5 Australia Copper Slag Market Revenues & Volume, By Others, 2022-2032F |
7 Australia Copper Slag Market Import-Export Trade Statistics |
7.1 Australia Copper Slag Market Export to Major Countries |
7.2 Australia Copper Slag Market Imports from Major Countries |
8 Australia Copper Slag Market Key Performance Indicators |
8.1 Percentage of construction projects using copper slag as a substitute material |
8.2 Environmental impact assessment reports on the use of copper slag |
8.3 Research and development investment in improving the quality and applications of copper slag |
9 Australia Copper Slag Market - Opportunity Assessment |
9.1 Australia Copper Slag Market Opportunity Assessment, By Grain Size, 2022 & 2032F |
9.2 Australia Copper Slag Market Opportunity Assessment, By Application, 2022 & 2032F |
10 Australia Copper Slag Market - Competitive Landscape |
10.1 Australia Copper Slag Market Revenue Share, By Companies, 2025 |
10.2 Australia Copper Slag Market Competitive Benchmarking, By Operating and Technical Parameters |
11 Company Profiles |
12 Recommendations |
13 Disclaimer |
Global Go To Market Strategy - 2030
Export potential enables firms to identify high-growth global markets with greater confidence by combining advanced trade intelligence with a structured quantitative methodology. The framework analyzes emerging demand trends and country-level import patterns while integrating macroeconomic and trade datasets such as GDP and population forecasts, bilateral import–export flows, tariff structures, elasticity differentials between developed and developing economies, geographic distance, and import demand projections. Using weighted trade values from 2020–2024 as the base period to project country-to-country export potential for 2030, these inputs are operationalized through calculated drivers such as gravity model parameters, tariff impact factors, and projected GDP per-capita growth. Through an analysis of hidden potentials, demand hotspots, and market conditions that are most favorable to success, this method enables firms to focus on target countries, maximize returns, and global expansion with data, backed by accuracy.
By factoring in the projected importer demand gap that is currently unmet and could be potential opportunity, it identifies the potential for the Exporter (Country) among 190 countries, against the general trade analysis, which identifies the biggest importer or exporter.
To discover high-growth global markets and optimize your business strategy:
Click Here
Pricing
- Single User License$ 1,995
- Department License$ 2,400
- Site License$ 3,120
- Global License$ 3,795

Leadership Perspectives from Industry Events
Search
Thought Leadership and Analyst Meet


Our Clients
6WResearch In News
- India Air Conditioner Market Set for Strong Rebound in 2026 After Weather-Led Correction and GST-Driven Recovery: 6Wresearch
- ADAS in India: How Automatic Emergency Braking, Blind Spot Detection & Driver Monitoring are Transforming Road Safety
- Doha a strategic location for EV manufacturing hub: IPA Qatar
- Demand for luxury TVs surging in the GCC, says Samsung
- Empowering Growth: The Thriving Journey of Bangladesh’s Cable Industry
- Demand for luxury TVs surging in the GCC, says Samsung
Latest Reports
- Nicaragua RPG Gaming Market (2026-2032)
- New Zealand RPG Gaming Market (2026-2032)
- Netherlands RPG Gaming Market (2026-2032)
- Nauru RPG Gaming Market (2026-2032)
- Namibia RPG Gaming Market (2026-2032)
- Mozambique RPG Gaming Market (2026-2032)
- Montenegro RPG Gaming Market (2026-2032)
- Mongolia RPG Gaming Market (2026-2032)
- Monaco RPG Gaming Market (2026-2032)
- Micronesia RPG Gaming Market (2026-2032)
Industry Events and Analyst Meet

EV India Expo 2026

HIMTEX 2026

India Refining Summit 2026

India EV Show 2026

EV tech India Expo 2026
Whitepaper
- Middle East & Africa Commercial Security Market Click here to view more.
- Middle East & Africa Fire Safety Systems & Equipment Market Click here to view more.
- GCC Drone Market Click here to view more.
- Middle East Lighting Fixture Market Click here to view more.
- GCC Physical & Perimeter Security Market Click here to view more.