Australia Electric Bus Market (2026-2032) | Outlook, Trends, Companies, Revenue, Size, Growth, Share, Industry, Forecast, Analysis & Value
Market Forecast By Charger Types (AC and DC), By DC Charger Connector Types (CHAdeMO, CCS, and Others (including Tesla superchargers and GB/T)), By DC Charger Power Ratings (40-80 kW, 80-120 kW, and 120-200 kW), By End Consumers (Public and Private) And Competitive Landscape.
| Product Code: ETC072150 | Publication Date: Jul 2024 | Updated Date: May 2026 | Product Type: Report | |
| Publisher: 6Wresearch | Author: Ravi Bhandari | No. of Pages: 70 | No. of Figures: 35 | No. of Tables: 5 |
Australia Electric Bus Market Growth Rate
According to 6Wresearch internal database and industry insights, the Australia Electric Bus Market is projected to grow at a compound annual growth rate (CAGR) of 12.8% during the forecast period (2026-2032).
Five-Year Growth Trajectory of the Australia Electric Bus Market with Core Drivers
Below mentioned is the evaluation of year-wise growth rate along with key growth drivers:
| Year | Est. Annual Growth (%) | Growth Drivers |
| 2021 | 6.5% | Initial adoption of electric buses in pilot public transport programs |
| 2022 | 7.8% | Government funding support for zero-emission transport initiatives |
| 2023 | 9.2% | Expansion of charging infrastructure in metropolitan cities |
| 2024 | 10.5% | Procurement of electric buses by state transport authorities |
| 2025 | 11.7% | Rising investments in fleet electrification and sustainability goals |
Topics Covered in the Australia E2lectric Bus Market Report
The Australia Electric Bus Market report thoroughly covers the market by charger types, DC charger connector types, DC charger power ratings, and end consumers. The market report provides an unbiased and detailed analysis of ongoing market trends, opportunities/high growth areas, and market drivers, which help stakeholders devise and align their market strategies according to the current and future market dynamics.
Australia Electric Bus Market Highlights
| Report Name | Australia Electric Bus Market |
| Forecast period | 2026-2032 |
| CAGR | 12.8% |
| Growing Sector | Public Transport Authorities & Fleet Operators |
Australia Electric Bus Market Synopsis
Australia Electric Bus Market is anticipated to record notable growth owing to the mounting pressure on minimizing carbon dioxide emissions, increasing government encouragement to adopt clean modes of transport, and increased investments made in sustainable urban transportation. Electric buses are becoming popular in many cities due to the movement of transit systems from conventional buses to zero emission buses. Also, improvements in battery technologies and fast charging capabilities have contributed to increasing efficiency. Private players and foreign companies' participation in the industry has played a vital role in promoting the use of electric buses in Australia.
Evaluation of Growth Drivers in the Australia Electric Bus Market
Below mentioned are some prominent drivers and their influence on the market dynamics:
| Drivers | Primary Segments Affected | Why it Matters (Evidence) |
| Government Zero-Emission Policies | All Types; Public | Strong regulatory push encourages adoption of electric buses across cities |
| Expansion of Charging Infrastructure | DC Chargers; Public & Private | Improved charging availability supports fleet scalability and efficiency |
| Rising Fuel Cost Concerns | All Types; Private Operators | Electric buses reduce long-term operational expenses compared to diesel |
| Technological Advancements in Batteries | DC Power Ratings; All Segments | Longer battery life enhances route coverage and reduces downtime |
| Public Transport Electrification Programs | All Types; Public | State-level initiatives accelerate procurement of electric bus fleets |
Australia Electric Bus Market is expected to grow at the CAGR of 12.8% during the forecast period of 2026-2032. This growth is attributed through growing environmental consciousness, governmental incentives, and significant investment in infrastructure for sustainable mobility options. Programs for public transportation vehicle electrification in various cities, like Sydney and Melbourne, contribute towards an increased demand for electric buses. Moreover, collaboration between public transportation companies and fleet operators facilitates better fleet adoption. Progress in the development of fast charging and battery technology also contributes towards the growth of the industry.
Evaluation of Restraints in the Australia Electric Bus Market
Below mentioned are some major restraints and their influence on the market dynamics:
| Restraints | Primary Segments Affected | What This Means (Evidence) |
| High Initial Investment Costs | All Types; Private | High procurement cost limits adoption among smaller fleet operators |
| Limited Charging Infrastructure in Rural Areas | DC Chargers; Public | Lack of infrastructure restricts expansion beyond urban centers |
| Battery Replacement Costs | DC Power Ratings; All Segments | High battery replacement expenses impact long-term cost efficiency |
| Grid Capacity Constraints | DC Chargers; Public | Increased electricity demand may strain existing power networks |
| Supply Chain Dependencies | All Types; Manufacturers | Dependence on imported components affects production timelines |
Australia Electric Bus Industry Challenges
Irrespective of massive growth and development, the Australia Electric Bus Industry faces several challenges such as high upfront investment costs and limited charging infrastructure in remote regions. Many operators remain reluctant due to the considerable cost involved in transitioning their fleets and replacing batteries. Moreover, the inability to meet the grid capacity requirements in some regions is another issue that must be addressed before a full-scale implementation. Another challenge is that the supply chain requires imported parts. The training process for maintenance and operation of electric buses has been slow as well.
Australia Electric Bus Market Trends
Key emerging trends shaping the Australia Electric Bus Market Growth include:
- Use of Fast-Charging Infrastructure: The rapid deployment of fast-charging infrastructure, such as high-power DC chargers, has facilitated shorter downtime for electric buses. This has helped enhance efficiency and made it feasible for electric buses to operate on longer distances.
- Employment of Smart Fleet Management Systems: Smart systems are being employed to monitor vehicle operations and energy usage. This has helped optimize the routes and minimize costs in the process.
- Use of Renewable Energy Charging Stations: Charging stations are gradually becoming charged from renewable sources like solar energy. This has helped in achieving the sustainable development goals of Australia.
- Formation of Public-Private Partnerships: Collaboration between the government and private players has improved the development of infrastructure. This has facilitated the deployment of electric buses in various areas.
Investment Opportunities in the Australia Electric Bus Market
Key investment areas gaining traction in the Australia Electric Bus Market include:
- Development of Charging Infrastructure – Building charging infrastructure through networks of DC fast chargers is a critical focus area. This ensures smooth operations and helps scale fleet electrification efforts.
- Production & Assembly of Electric Buses – Creation of manufacturing plants in the domestic market might minimize imports. Moreover, this sub-sector can provide potential savings on costs and job creation opportunities.
- Battery Technology Upgrades – Investing in new technology for batteries could enhance efficiencies and performance of such systems. Significant potential exists owing to technological innovations in this space.
- Leasing & Fleet Management Services – Offering services related to leasing and fleet management of electric buses offers scope for growth. Leasing would reduce the initial investment burden on private operators.
Top 5 Leading Players in the Australia Electric Bus Market
Some leading players operating in the Australia Electric Bus Market include:
1. BYD Company Limited
| Company Name | BYD Company Limited |
|---|---|
| Established Year | 1995 |
| Headquarters | Shenzhen, China |
| Official Website | Click Here |
BYD is a global leader in electric mobility solutions, offering advanced electric buses equipped with proprietary battery technologies. The company has a strong presence in Australia, supplying zero-emission buses for public transport and supporting sustainable urban mobility initiatives.
2. Volvo Group
| Company Name | Volvo Group |
|---|---|
| Established Year | 1927 |
| Headquarters | Gothenburg, Sweden |
| Official Website | Click Here |
Volvo provides electric and hybrid buses with advanced safety and energy-efficient features. The company is actively involved in Australia’s transition to sustainable transport by delivering reliable electric bus solutions for urban and intercity routes.
3. Yutong Bus Co., Ltd.
| Company Name | Yutong Bus Co., Ltd. |
|---|---|
| Established Year | 1963 |
| Headquarters | Zhengzhou, China |
| Official Website | Click Here |
Yutong is a leading manufacturer of electric buses globally, known for its cost-effective and energy-efficient models. The company supplies electric buses in Australia, contributing to the expansion of eco-friendly public transportation systems.
4. Daimler Truck AG
| Company Name | Daimler Truck AG |
|---|---|
| Established Year | 2021 |
| Headquarters | Leinfelden-Echterdingen, Germany |
| Official Website | Click Here |
Daimler Truck offers electric buses under its mobility solutions portfolio, focusing on innovation and sustainability. The company supports fleet electrification in Australia through advanced engineering and reliable electric vehicle technologies.
5. Nexport Pty Ltd
| Company Name | Nexport Pty Ltd |
|---|---|
| Established Year | 2015 |
| Headquarters | Sydney, Australia |
| Official Website | Click Here |
Nexport is an Australian electric vehicle distributor specializing in zero-emission buses. The company partners with global manufacturers to supply electric buses and plays a key role in accelerating Australia’s transition to clean transportation.
Government Regulations Introduced in the Australia Electric Bus Market
According to Australia’s Government Data, Several programs have been launched to increase the use of electric buses in the country. Some examples of such programs include the “National Electric Vehicle Strategy” program and the introduction of zero-emission buses at the state level. For instance, the state of New South Wales plans to transition all its buses to zero emission by 2035, whereas Victoria will be launching pilot projects using electric buses and charging stations. Further, financial incentives for transport providers to adopt electric vehicles have also been introduced.
Future Insights of the Australia Electric Bus Market
The Australia Electric Bus Market Share is expected to witness strong growth driven by continuous advancements in battery technology, expansion of charging infrastructure, and increasing government support for sustainable transport. The industry is expected to grow due to more investments in smart mobility technologies and renewables in energy systems. Electric public transport programs are expected to grow in large cities, and there will be more instances of private operators using electric fleets. Moreover, developments in vehicle design and performance are bound to improve their efficiency and decrease costs, resulting in electric buses being favored over conventional alternatives in the country.
Market Segmentation Analysis
The report offers a comprehensive study of the subsequent market segments and their leading categories.
DC Chargers to Lead the Market – By Charger Types
According to Mohit, Senior Research Analyst, 6Wresearch, DC chargers are emerging as the dominant segment in the Australia Electric Bus Market. Moreover, their capacity to enable fast charging ensures there will be minimal down time, making these buses ideal for use in commercial bus fleet operations. The demand for such buses has risen due to the rise in the adoption of fast charging technology among urban transit operators. Furthermore, DC chargers are good for long hauls.
CCS Connectors to Dominate – By DC Charger Connector Types
Connectors for the Combined Charging System (CCS) are receiving widespread acceptance owing to their ability to be compatible with different types of electric buses. This is due to their efficiency and fast charging capabilities.
80-120 kW Segment Leading – By DC Charger Power Ratings
The 80-120 kW power ratings have become dominant due to the right combination of charging time and infrastructure costs. They are extensively used for bus transportation systems within cities, providing the best efficiency level without needing much power.
Key Attractiveness of the Report
- 10 Years of Market Numbers.
- Historical Data Starting from 2022 to 2025.
- Base Year: 2025.
- Forecast Data until 2032.
- Key Performance Indicators Impacting the Market.
- Major Upcoming Developments and Projects.
Key Highlights of the Report:
- Australia Electric Bus Market Overview
- Australia Electric Bus Market Outlook
- Australia Electric Bus Market Trends
- Australia Electric Bus Market Forecast
- Historical Data of Australia Electric Bus Market Revenues and Volume for the Period 2022-2032
- Australia Electric Bus Market Size and Market Forecast Revenues until 2032
- Historical Data of Australia Electric Bus Market Revenues and Volume, by Vehicle Types, for the Period 2022-2032
- Market Size & Forecast of Australia Electric Bus Market Revenues and Volume, by Vehicle Types, until 2032
- Historical Data of Australia Electric Bus Market Revenues, by End Users, for the Period 2022-2032
- Market Size & Forecast of Australia Electric Bus Market Revenues, by End Users, until 2032
- Historical Data of Australia Electric Bus Market Revenues and Volume, by Charging Infrastructure, for the Period 2022-2032
- Market Size & Forecast of Australia Electric Bus Market Revenues and Volume, by Charging Infrastructure, until 2032
- Historical Data of Australia Electric Bus Market Revenues and Volume, by Regions, for the Period 2022-2032
- Market Size & Forecast of Australia Electric Bus Market Revenues and Volume, by Regions, until 2032
- Market Drivers and Restraints
- Market Trends and Industry Life Cycle
- Porter’s Five Force Analysis
- Market Opportunity Assessment
- Australia Electric Bus Market Overview on Competitive Benchmarking
- Australia Electric Bus Market Share, by Companies
- Australia Electric Bus Market Share, by Regions
- Key Strategic Recommendations
Market Covered
The report offers a comprehensive study of the subsequent market segments:
By Charger Types
- AC
- DC
By DC Charger Connector Types
- CHAdeMO
- CCS
- Others (including Tesla superchargers and GB/T)
By DC Charger Power Ratings
- 40-80 kW
- 80-120 kW
- 120-200 kW
By End Consumers
- Public
- Private
Australia Electric Bus Market (2026-2032): FAQs
The Australia Electric Bus Market is projected to grow at a CAGR of 12.8% during the forecast period 2026-2032.
Market growth is fueled by government policies on emission-free travel, escalating prices of conventional fuels, and greater investments in charging stations.
Some of the key challenges include high capital investment needs, absence of infrastructure in rural areas, and dependence on foreign components.
Some of the key challenges include high capital investment needs, absence of infrastructure in rural areas, and dependence on foreign components.
Significant growth is anticipated owing to the growing use of electric buses and advances in technology.
| 1. Introduction |
| 1.1 Market Scope & Segmentation |
| 1.2 Research Methodology – Sources of Information |
| 1.3 Robust Forecasting Model |
| 1.4 Assumptions |
| 2. Australia Electric Bus Market Overview |
| 2.1. Australia Electric Bus Market Overview |
| 2.2. Australia Electric Bus Market Revenues and Volume, 2022-2032F |
| 2.3. Australia Electric Bus Market Revenue Share, By Types |
| 2.3.3. Australia Electric Bus Market Revenue and Volume Share, 2022 & 2032F |
| 2.4. Australia Electric Bus Market Revenues and Volume, 2022-2032F |
| 2.5. Australia Electric Bus Market Overview, By Types |
| 3. Australia Electric Bus Charging Infrastructure Market Overview |
| 3.1. Australia Electric Bus Charger Market Revenues and Volume, 2022-2032F |
| 3.2. Australia Electric Bus Charger Market Revenue and Volume Share, By Types, 2022 & 2032F |
| 3.2.1. Australia AC Charger Electric Vehicle Market Revenue and Volume Share, 2021 & 2031F |
| 3.2.2. Australia DC Charger Electric Vehicle Market Revenue and Volume Share, 2021 & 2031F |
| 3.3. Australia Electric Bus Charger Market Revenues and Volume, By Type 2022-2032F |
| 3.3.1. Australia AC Charger Electric Vehicle Market Revenues and Volume, 2021 & 2031F |
| 3.3.2. Australia DC Charger Electric Vehicle Market Revenues and Volume, 2021 & 2031F |
| 3.4. Australia Electric Bus Charger Market Volume Share, By End Consumers, 2021 & 2031F |
| 3.4.1. Australia Public End Consumer Electric Bus Charger Market Volume, 2022-2032F |
| 3.4.1. Australia Private End Consumer Electric Bus Charger Market Volume, 2022-2032F |
| 3.5. Australia DC Charger Market Volume Share, By Connector Types, 2021 & 2031F |
| 3.5.1. Australia CHAdeMO DC Electric Bus Charger Market Volume, 2022-2032F |
| 3.5.2. Australia CCS DC Electric Bus Charger Market Volume, 2022-2032F |
| 3.5.3. Australia Other DC Electric Bus Charger Market Volume, 2022-2032F |
| 3.6. Australia DC Charger Market Volume Share, By Power Rating, 2022 & 2032F |
| 3.6.1. Australia 40-80 kW DC Electric Vehicle Charger Market Volume, 2022-2032F |
| 3.6.2. Australia 80-120 kW DC Electric Vehicle Charger Market Volume, 2022-2032F |
| 3.6.3. Australia 120-200 kW DC Electric Vehicle Charger Market Volume, 2022-2032F |
| 3.7. Australia Electric Bus High Power Charger Market Volume, 2022F-2031F |
| 3.8. Australia Electric Bus Charging Infrastructure - Ecosystem |
| 4. Australia Electric Bus Competitive Landscape |
| 4.1. Australia Electric Bus Charger Volume, By Company, 2025 |
| 4.2. Australia Electric Bus Charger Market Volume Share, By Company, 2025 |
| 5. Company Profiles |
| 6. Disclaimer |
Market Forecast By Charger Types (AC and DC), By DC Charger Connector Types (CHAdeMO, CCS, and Others (including Tesla superchargers and GB/T)), By DC Charger Power Ratings (40-80 kW, 80-120 kW, and 120-200 kW), By End Consumers (Public and Private) And Competitive Landscape.
| Product Code: ETC072150 | Publication Date: Mar 2024 | Product Type: Report | |
| Publisher: 6Wresearch | No. of Pages: 70 | No. of Figures: 35 | No. of Tables: 5 |
Australia Electric Bus Market Highlights
| Report Name | Australia Electric Bus Market |
| Forecast period | 2024-2030 |
| CAGR | 5.8% |
| Growing Sector | Transport |
Topics Covered in the Australia Electric Bus Market Report
Australia Electric Bus Market report thoroughly covers the market by Charger type, DC charger connector types, dc charger power ratings, and End -consumers. The market outlook report provides an unbiased and detailed analysis of the ongoing market trends, opportunities/high growth areas, and market drivers which would help the stakeholders to devise and align their market strategies according to the current and future market dynamics.
Australia Electric Bus Market Synopsis
Australia Electric Bus Market is currently on a trajectory of growth, driven by the convergence of government support, environmental advocacy, and technological innovation. The active involvement of both international and local manufacturers underscores the market's potential for expansion and sustainability. With continued government incentives and the trial successes of electric buses in urban centers, Australia is positioning itself as a leading proponent of electrified public transport. This shift not only underscores Australia's commitment to reducing carbon emissions but also showcases the country's readiness to adopt future-forward solutions for its transportation needs.
According to 6Wresearch, the Australia Electric Bus Market size is projected to grow at the CAGR of 5.8% during the forecast period of 2024-2030. One of the major drivers for the adoption of electric buses in Australia is the need to reduce air pollution. As traditional diesel buses are a major contributor to air pollution, governments at both federal and state levels have been promoting the use of electric buses to combat this issue. This has led to an increase in demand from public transportation authorities and operators for electric buses. Moreover, the cost-effectiveness of electric buses compared to diesel buses is another significant factor driving their adoption in Australia.
Electric buses have lower operational and maintenance costs, making them a more economical option in the long run. With advancements in battery technology, the initial cost of electric buses is also expected to decrease, further driving their adoption. Despite the numerous benefits and government support, there are still some challenges that hinder the growth of the electric bus market in Australia. The limited availability and high cost of charging infrastructure is a major challenge that needs to be addressed to promote Australia Electric Bus Market Growth. As electric buses require charging stations at depots or along their routes, the lack of proper infrastructure can be a major barrier to their adoption. Additionally, the high upfront cost of electric buses is also a hindrance. While they may have lower operational costs, the initial investment for purchasing an electric bus is significantly higher than a traditional diesel bus. This makes it difficult for smaller operators to switch to electric buses
Government policies and schemes introduced in the Australia Electric Bus Market
The Australian government, both at the federal and state levels, has introduced a series of policies and schemes aimed at bolstering the electric bus market. Notably, grants and incentives are being offered to transit operators to reduce the financial burden of transitioning to electric buses. For instance, the Electric Vehicle Council is actively advocating for policy changes that support electrification of public transport. Additionally, specific cities have launched trial programs that involve the deployment of electric buses in their fleets, serving as a litmus test for wider adoption across the country.
Leading players in the Australia Electric Bus Market
The Electric bus market in Australia is seeing increasing participation from both domestic and international manufacturers. Key players such as Yutong, a global leader in electric bus manufacturing, have made significant inroads into the Australian market. Meanwhile, local players, including Bustech and Volgren, are collaborating with technology firms to develop electric buses that cater specifically to Australian conditions. These companies are at the forefront of innovation, working on enhancing battery technology and charging solutions to meet the unique challenges faced in Australia, such as vast distances and varied climates.
Future Insight of the Australia Electric Bus Market
The future looks promising for electric buses in Australia. The government has launched several initiatives and funding programs to support the development of charging infrastructure and encourage the adoption of electric buses. In fact, some states have set targets for a percentage of their public bus fleet to be replaced with electric buses by a certain year. Furthermore, advancements in battery technology are expected to significantly reduce the upfront cost of electric buses in the near future. This, coupled with the increasing focus on sustainable transportation, is likely to drive the growth of the electric bus market in Australia.
Market analysis by dc charger connector types
The CCS segment is expected to show significant growth in the Australia Electric Bus Market. As a widely adopted connector type globally, CCS offers compatibility with both AC and DC charging, making it a versatile option for different types of electric buses
Market analysis By dc charger power Ratings
The 120-200 KW segment is expected to grow in the Australia electric bus Industry. This can be attributed to the increasing demand for longer range and faster charging capabilities, as well as advancements in battery technology allowing for higher power ratings. Additionally, government initiatives promoting the adoption of electric buses often require a minimum DC charger power rating, further driving growth in this segment.
Key attractiveness of the report
- 10 Years Market Numbers.
- Historical Data Starting from 2020 to 2023.
- Base Year: 2023.
- Forecast Data until 2030.
- Key Performance Indicators Impacting the Market.
- Major Upcoming Developments and Projects.
Key Highlights of the Report
- Australia Electric Bus Market Overview
- Australia Electric Bus Market Outlook
- Australia Electric Bus Market Forecast
- Historical Data and Forecast Australia Electric Bus Market Revenues and Volume for the Period 2020-2030F
- Historical Data and Forecast of Australia Electric Bus Market Revenues and Volume, By Vehicle Types, for the Period 2020-2030F
- Historical Data and Forecast of Australia Electric Bus Market Revenues and Volume, By Charger Types, for the Period 2020-2030F
- Historical Data and Forecast of Australia Electric Bus Market Revenues and Volume, By DC Charger Connector Types, for the Period 2020-2030F
- Historical Data and Forecast of Australia Electric Bus Market Revenues and Volume, By DC Charger Power Ratings, for the Period 2020-2030F
- Historical Data and Forecast of Australia Electric Bus Market Revenues and Volume, By Charger End Consumers, for the Period 2020-2030F
- Market Drivers and Restraints
- Industry Life Cycle
- Porter’s Five Force Analysis
- Market Trends
- Australia Vehicle Market Revenue Ranking, By Companies
- Competitive Benchmarking
- Company Profiles
- Key Strategic Recommendations
Market Covered
The report offers a comprehensive study of the subsequent market segments:
By Charger Types
- AC And DC
By DC Charger Connector Types
- CHAdeMO
- CCS And Others (Including Tesla Superchargers And GB/T)
By DC Charger Power Ratings
- 40-80 KW
- 80-120 KW
- And 120-200 KW
By End Consumers
- Public And Private
Market Forecast By Charger Types (AC and DC), By DC Charger Connector Types (CHAdeMO, CCS, and Others (including Tesla superchargers and GB/T)), By DC Charger Power Ratings (40-80 kW, 80-120 kW, and 120-200 kW), By End Consumers (Public and Private) And Competitive Landscape.
| Product Code: ETC072150 | Publication Date: May 2022 | Product Type: Market Research Report | |
| Publisher: 6Wresearch | No. of Pages: 80 | No. of Figures: 14 | No. of Tables: 8 |
Australia Electric Bus Market report comprehensively covers the market by-charger types, DC charger connector types, DC charger power ratings, and end consumers. Australia Electric Bus market report provides an unbiased and detailed analysis of the ongoing trends, opportunities/high growth areas, and market drivers which would help the stakeholders to devise and align their market strategies according to the current and future market dynamics.
Australia Electric Bus Market Synopsis
Electric buses present a significant opportunity for Australian transit operators to reduce vehicle emissions, noise pollution, and running costs. Further, the increase in the number of ultra-rapid public chargers in the country would ease the charging of electric buses in a less time period which would further boost the demand for electric buses by bus fleet operators However, the incursion of the COVID-19 pandemic has resulted in a slowdown in the Australia economy during the first half of 2020 further obstructing the growth of Australia electric vehicle market.
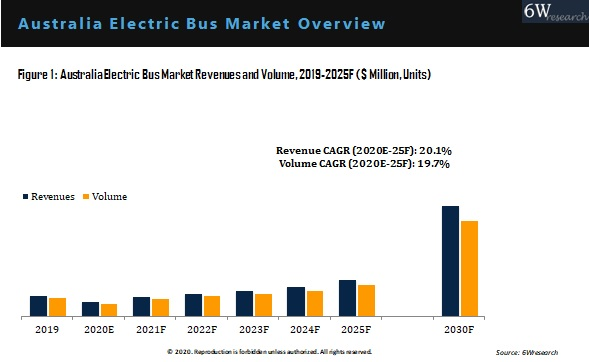
According to 6Wresearch, Australia electric bus market size grew at a CAGR of 20.1% during 2020-2025. The ACT government would also replace 90 diesel and gas buses with electric vehicles over a period of 4 years if they are re-elected in the country. Moreover, the NSW’s plan to increase the adoption of the electric bus in the public transport network through trial runs by bus operators also be a primary reason behind the increase in demand for electric buses in the country in the coming years.
Key Attractiveness of the Report
- COVID-19 Impact on the Market.
- 6 Years Market Numbers.
- Estimated Data Starting from 2020 to 2025F.
- Base Year: 2019
- Forecast Data until 2025F.
- Key Performance Indicators Impacting the Market.
- Major Upcoming Developments and Projects.
Key Highlights of the Report
- Australia Electric Bus Market Overview
- Australia Electric Bus Market Outlook
- Australia Electric Bus Market Forecast
- Historical Data and Forecast Australia Electric Bus Market Revenues and Volume for the Period 2019-2025F
- Historical Data and Forecast of Australia Electric Bus Market Revenues and Volume, By Vehicle Types, for the Period 2019-2025F
- Historical Data and Forecast of Australia Electric Bus Market Revenues and Volume, By Charger Types, for the Period 2019-2025F
- Historical Data and Forecast of Australia Electric Bus Market Revenues and Volume, By DC Charger Connector Types, for the Period 2019-2025F
- Historical Data and Forecast of Australia Electric Bus Market Revenues and Volume, By DC Charger Power Ratings, for the Period 2019-2025F
- Historical Data and Forecast of Australia Electric Bus Market Revenues and Volume, By Charger End Consumers, for the Period 2019-2025F
- Market Drivers and Restraints
- Industry Life Cycle
- Porter’s Five Force Analysis
- Impact Analysis of COVID-19
- Market Trends
- Australia Vehicle Market Revenue Ranking, By Companies
- Competitive Benchmarking
- Company Profiles
- Key Strategic Recommendations
Market Scope and Segmentation
The report provides a detailed analysis of the following market segments:
By Charger Types
- AC
- DC
By DC Charger Connector Types
- CHAdeMO
- CCS
- Others (including Tesla superchargers and GB/T)
By DC Charger Power Ratings
- 40-80 kW
- 80-120 kW
- 120-200 kW
By Charger End Consumers
- Public
- Private
Global Go To Market Strategy - 2030
Export potential enables firms to identify high-growth global markets with greater confidence by combining advanced trade intelligence with a structured quantitative methodology. The framework analyzes emerging demand trends and country-level import patterns while integrating macroeconomic and trade datasets such as GDP and population forecasts, bilateral import–export flows, tariff structures, elasticity differentials between developed and developing economies, geographic distance, and import demand projections. Using weighted trade values from 2020–2024 as the base period to project country-to-country export potential for 2030, these inputs are operationalized through calculated drivers such as gravity model parameters, tariff impact factors, and projected GDP per-capita growth. Through an analysis of hidden potentials, demand hotspots, and market conditions that are most favorable to success, this method enables firms to focus on target countries, maximize returns, and global expansion with data, backed by accuracy.
By factoring in the projected importer demand gap that is currently unmet and could be potential opportunity, it identifies the potential for the Exporter (Country) among 190 countries, against the general trade analysis, which identifies the biggest importer or exporter.
To discover high-growth global markets and optimize your business strategy:
Click Here
Pricing
- Single User License$ 1,995
- Department License$ 2,400
- Site License$ 3,120
- Global License$ 3,795

Leadership Perspectives from Industry Events
Search
Thought Leadership and Analyst Meet


Our Clients
6WResearch In News
- India Air Conditioner Market Set for Strong Rebound in 2026 After Weather-Led Correction and GST-Driven Recovery: 6Wresearch
- ADAS in India: How Automatic Emergency Braking, Blind Spot Detection & Driver Monitoring are Transforming Road Safety
- Doha a strategic location for EV manufacturing hub: IPA Qatar
- Demand for luxury TVs surging in the GCC, says Samsung
- Empowering Growth: The Thriving Journey of Bangladesh’s Cable Industry
- Demand for luxury TVs surging in the GCC, says Samsung
Latest Reports
- Poland Fire Protection Systems Market (2026-2032)
- Cape Verde Portable Hand-Thrown Extinguisher Market (2026-2032)
- Canada Portable Hand-Thrown Extinguisher Market (2026-2032)
- Cameroon Portable Hand-Thrown Extinguisher Market (2026-2032)
- Burundi Portable Hand-Thrown Extinguisher Market (2026-2032)
- Burkina Faso Portable Hand-Thrown Extinguisher Market (2026-2032)
- Bulgaria Portable Hand-Thrown Extinguisher Market (2026-2032)
- Brunei Portable Hand-Thrown Extinguisher Market (2026-2032)
- Botswana Portable Hand-Thrown Extinguisher Market (2026-2032)
- Bosnia and Herzegovina Portable Hand-Thrown Extinguisher Market (2026-2032)
Industry Events and Analyst Meet

HIMTEX 2026

India Refining Summit 2026

India EV Show 2026

EV tech India Expo 2026

Auto Tech Asia 2026
Whitepaper
- Middle East & Africa Commercial Security Market Click here to view more.
- Middle East & Africa Fire Safety Systems & Equipment Market Click here to view more.
- GCC Drone Market Click here to view more.
- Middle East Lighting Fixture Market Click here to view more.
- GCC Physical & Perimeter Security Market Click here to view more.