Australia Erythropoietin Stimulating Agents Market (2026-2032) | Segmentation, Share, Growth, Size & Revenue, Analysis, Outlook, Value, Companies, Competitive Landscape, Forecast, Industry, Trends
Market Forecast By Product Type (Epoetin-Alfa, Epoetin-Beta, Epoetin-Omega, Epoetin-Delta, Darbepoetin-Alfa), By Disease Cured (Oncology Diseases, Kidney Disorders, Anemia, Neural Disease, Wound Healing, Antiretroviral Treatment (ART), Cancer Chemotherapy) And Competitive Landscape
| Product Code: ETC6180164 | Publication Date: Sep 2024 | Updated Date: Mar 2026 | Product Type: Market Research Report | |
| Publisher: 6Wresearch | Author: Sumit Sagar | No. of Pages: 75 | No. of Figures: 35 | No. of Tables: 20 |
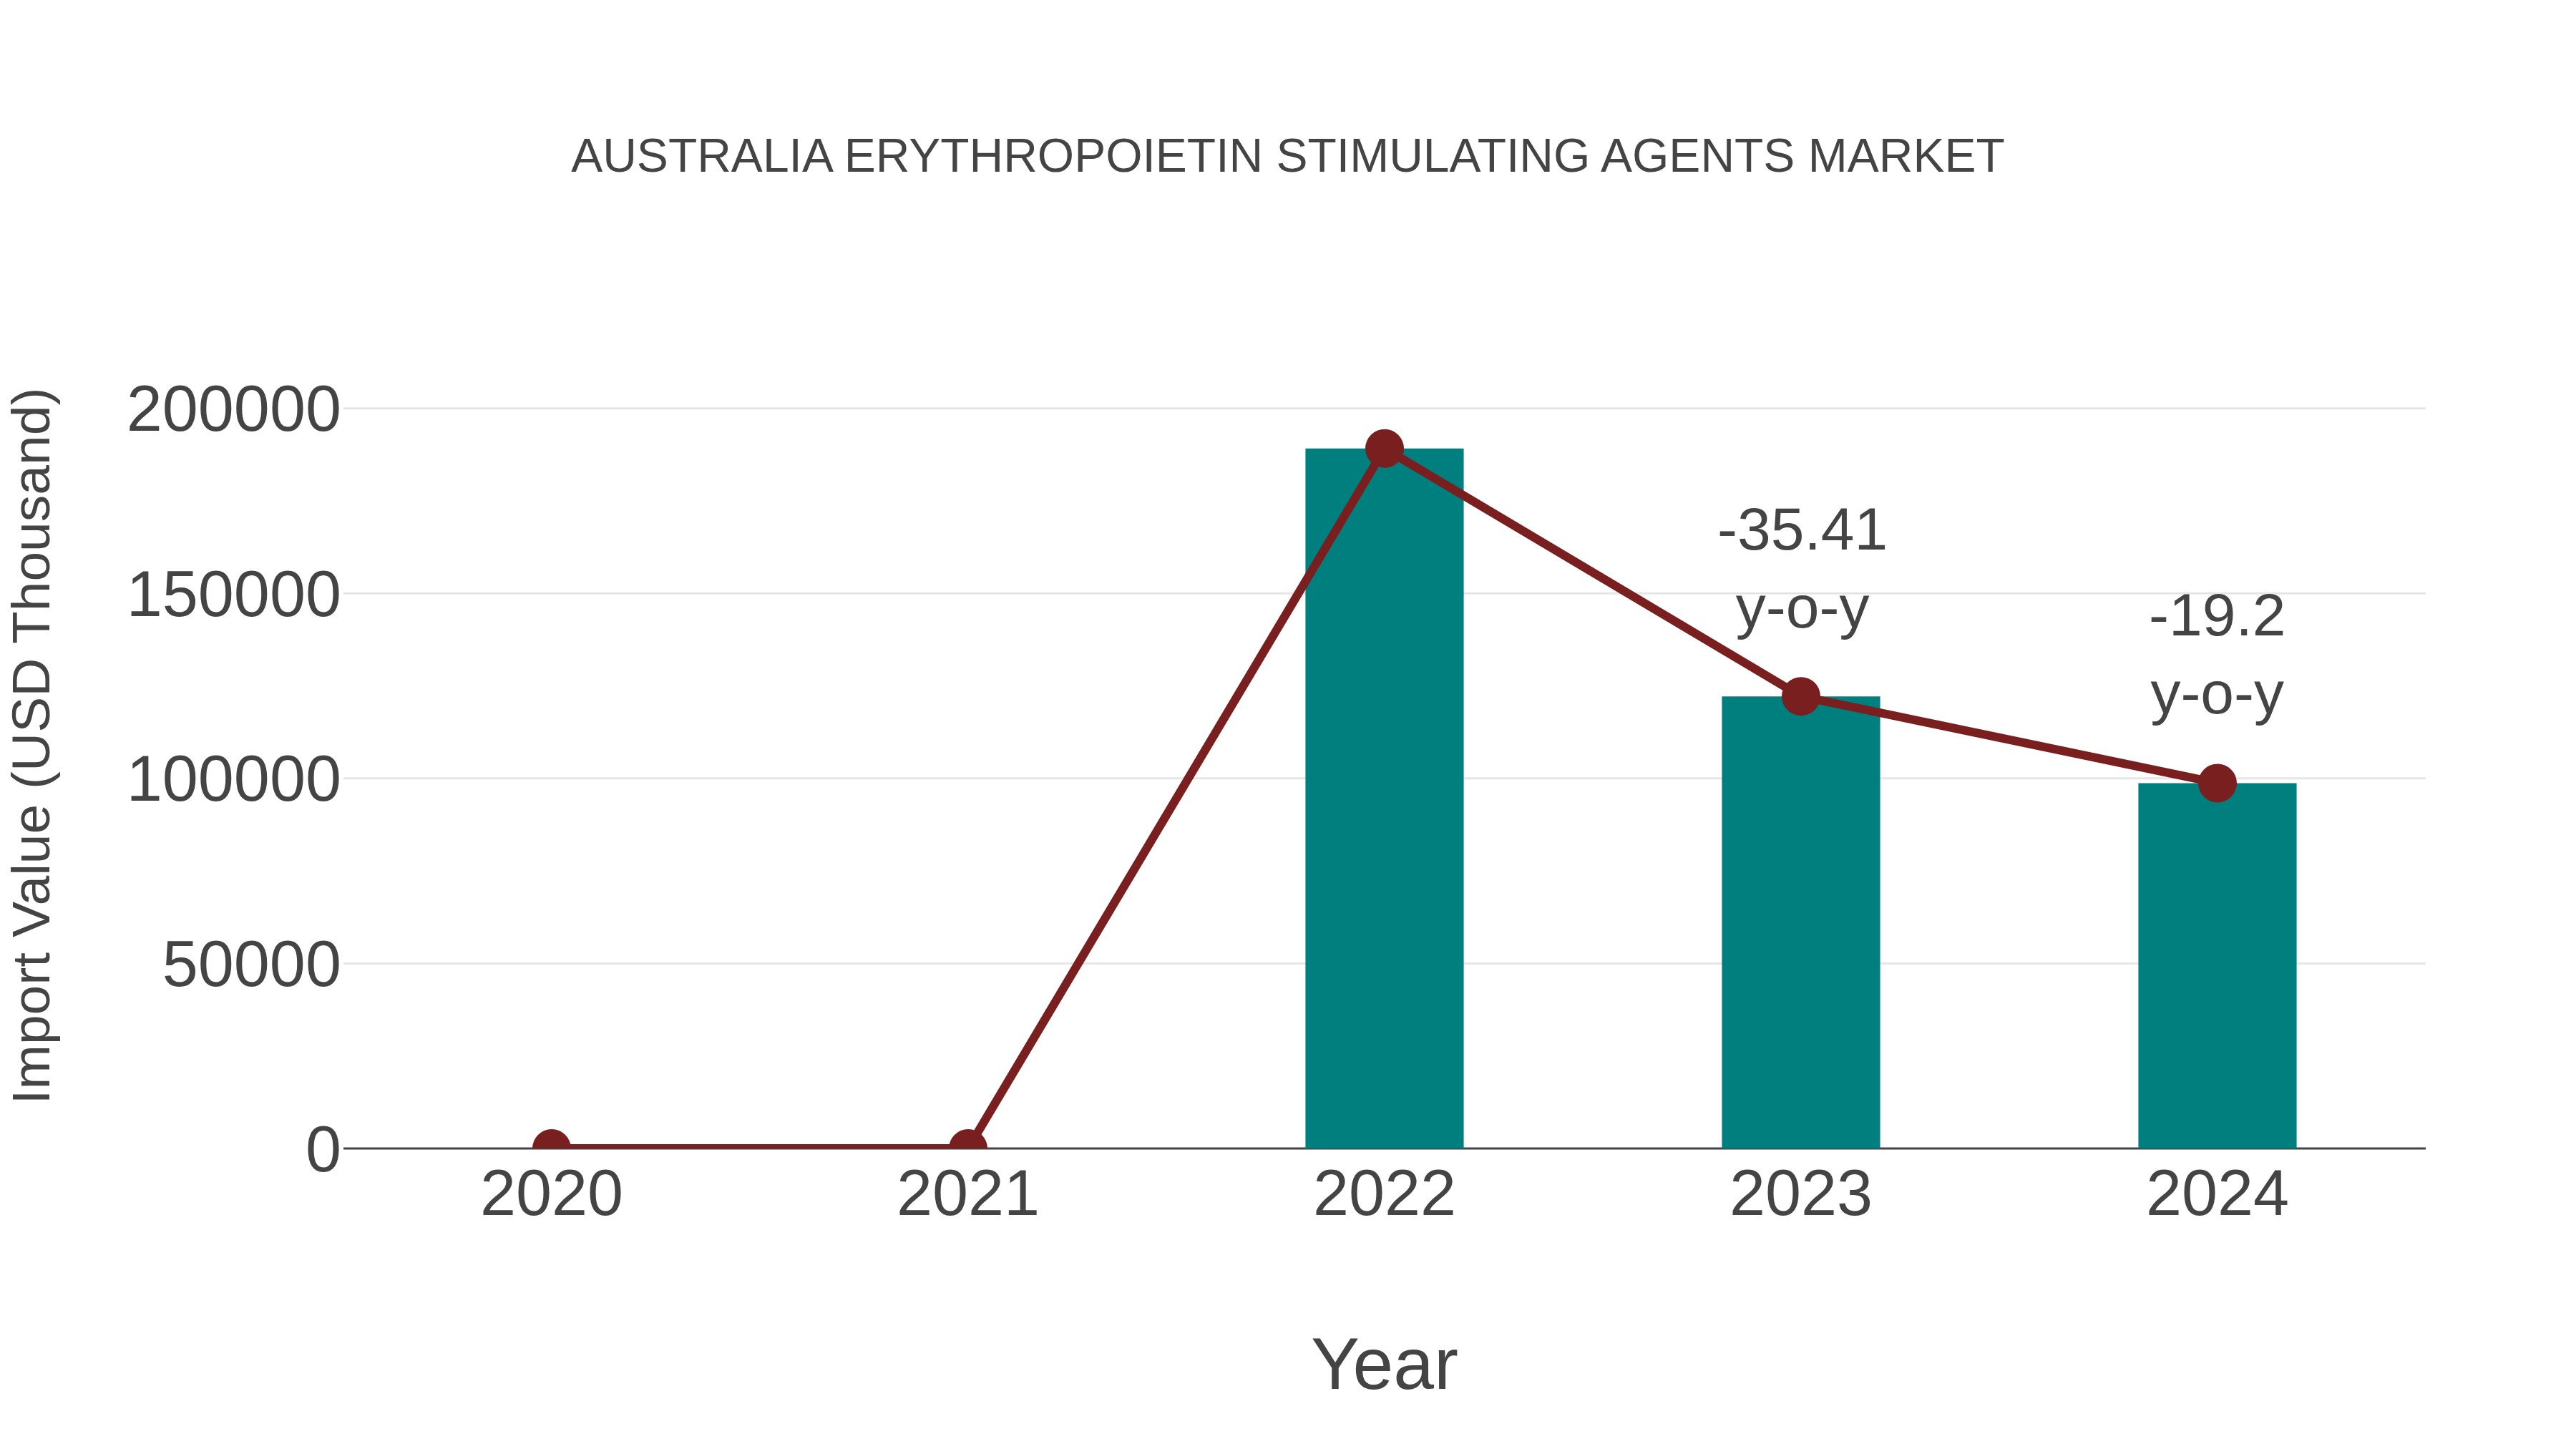
Australia Erythropoietin Stimulating Agents Market: Import Trend Analysis
In 2024, Australia`s import trend for erythropoietin stimulating agents experienced a decline of -19.2% from the previous year, with a compound annual growth rate (CAGR) of -27.76% from 2020 to 2024. This notable decrease in import momentum could be attributed to shifts in demand dynamics or evolving trade policies impacting market stability.
Australia Erythropoietin Stimulating Agents Market Overview
The Australia Erythropoietin Stimulating Agents (ESAs) market is characterized by steady growth driven by factors such as the increasing prevalence of renal diseases, cancer-related anemia, and other chronic conditions requiring ESAs for the management of anemia. The market is dominated by major pharmaceutical companies such as Amgen, Roche, and Johnson & Johnson, which offer a range of ESA products. The competitive landscape is also influenced by the presence of local manufacturers offering biosimilar versions of ESAs. Government initiatives to improve access to healthcare services, alongside rising healthcare expenditure, further contribute to market expansion. However, regulatory scrutiny surrounding the safety and appropriate use of ESAs, as well as the availability of alternative treatment options, pose challenges to market growth. Overall, the Australia ESA market is expected to continue growing moderately as demand for these agents remains strong in various therapeutic areas.
Australia Erythropoietin Stimulating Agents Market Trends and Opportunities
The Australia Erythropoietin Stimulating Agents (ESA) market is experiencing growth due to the increasing prevalence of chronic kidney disease and cancer-related anemia. The demand for ESA drugs is also driven by the rising geriatric population and the expanding use of these agents in the treatment of anemia associated with other chronic conditions. Additionally, advancements in biotechnology and the development of biosimilar ESAs present opportunities for market expansion and increased competition. Key players in the Australia ESA market are focusing on strategic collaborations and product innovations to gain a competitive edge. However, pricing pressures, regulatory challenges, and the emergence of alternative treatment options such as iron supplementation and blood transfusions pose threats to market growth in the near future.
Australia Erythropoietin Stimulating Agents Market Challenges
In the Australia Erythropoietin Stimulating Agents market, challenges include regulatory changes impacting pricing and reimbursement, increasing competition from biosimilar products, and evolving treatment guidelines leading to shifting prescribing patterns. The market is also influenced by the need for cost-effective healthcare solutions, which can impact the adoption of erythropoietin stimulating agents. Additionally, concerns around potential adverse effects and the need for monitoring patient response add complexity to the market landscape. Healthcare providers and pharmaceutical companies in Australia must navigate these challenges to ensure continued access to erythropoietin stimulating agents for patients while maintaining profitability in a competitive market environment.
Australia Erythropoietin Stimulating Agents Market Drivers
The Australia Erythropoietin Stimulating Agents (ESA) market is primarily driven by the increasing prevalence of chronic kidney disease, cancer, and other conditions leading to anemia. The rising geriatric population in Australia also contributes to the demand for ESAs as older individuals are more prone to anemia. Furthermore, advancements in healthcare infrastructure, increasing awareness about anemia management, and the growing number of dialysis centers in the country are driving the market growth. The availability of biosimilar ESAs at lower costs compared to branded products is also a significant factor boosting market expansion. Additionally, the government initiatives to improve access to essential medications and the high adoption rate of ESA therapy in clinical settings are further propelling the market forward.
Australia Erythropoietin Stimulating Agents Market Government Policies
In Australia, the Erythropoietin Stimulating Agents (ESA) market is regulated by the Therapeutic Goods Administration (TGA), which oversees the approval, sale, and monitoring of these products. The TGA enforces strict regulations to ensure the safety, quality, and efficacy of ESAs, particularly in the treatment of anemia in patients with chronic kidney disease or cancer. ESAs are classified as prescription medicines, requiring medical supervision for administration. Additionally, the Pharmaceutical Benefits Scheme (PBS) plays a significant role in determining the accessibility and affordability of ESAs by subsidizing their costs for eligible patients. The government policies surrounding ESAs in Australia aim to strike a balance between promoting patient health and well-being while ensuring the appropriate use and monitoring of these potent medications.
Australia Erythropoietin Stimulating Agents Market Future Outlook
The Australia Erythropoietin Stimulating Agents market is expected to experience steady growth in the coming years due to the increasing prevalence of chronic kidney disease and anemia among the aging population. The market is likely to be driven by the rising demand for erythropoietin stimulating agents to manage anemia associated with chronic kidney disease, cancer treatment, and other conditions. Additionally, advancements in biotechnology and the development of novel formulations with improved efficacy and safety profiles are anticipated to further propel market growth. However, stringent regulatory requirements and the potential availability of biosimilar products could pose challenges to market expansion. Overall, the Australia Erythropoietin Stimulating Agents market is projected to witness moderate growth opportunities in the foreseeable future.
Key Highlights of the Report:
- Australia Erythropoietin Stimulating Agents Market Outlook
- Market Size of Australia Erythropoietin Stimulating Agents Market, 2025
- Forecast of Australia Erythropoietin Stimulating Agents Market, 2032
- Historical Data and Forecast of Australia Erythropoietin Stimulating Agents Revenues & Volume for the Period 2022 - 2032F
- Australia Erythropoietin Stimulating Agents Market Trend Evolution
- Australia Erythropoietin Stimulating Agents Market Drivers and Challenges
- Australia Erythropoietin Stimulating Agents Price Trends
- Australia Erythropoietin Stimulating Agents Porter's Five Forces
- Australia Erythropoietin Stimulating Agents Industry Life Cycle
- Historical Data and Forecast of Australia Erythropoietin Stimulating Agents Market Revenues & Volume By Product Type for the Period 2022 - 2032F
- Historical Data and Forecast of Australia Erythropoietin Stimulating Agents Market Revenues & Volume By Epoetin-Alfa for the Period 2022 - 2032F
- Historical Data and Forecast of Australia Erythropoietin Stimulating Agents Market Revenues & Volume By Epoetin-Beta for the Period 2022 - 2032F
- Historical Data and Forecast of Australia Erythropoietin Stimulating Agents Market Revenues & Volume By Epoetin-Omega for the Period 2022 - 2032F
- Historical Data and Forecast of Australia Erythropoietin Stimulating Agents Market Revenues & Volume By Epoetin-Delta for the Period 2022 - 2032F
- Historical Data and Forecast of Australia Erythropoietin Stimulating Agents Market Revenues & Volume By Darbepoetin-Alfa for the Period 2022 - 2032F
- Historical Data and Forecast of Australia Erythropoietin Stimulating Agents Market Revenues & Volume By Disease Cured for the Period 2022 - 2032F
- Historical Data and Forecast of Australia Erythropoietin Stimulating Agents Market Revenues & Volume By Oncology Diseases for the Period 2022 - 2032F
- Historical Data and Forecast of Australia Erythropoietin Stimulating Agents Market Revenues & Volume By Kidney Disorders for the Period 2022 - 2032F
- Historical Data and Forecast of Australia Erythropoietin Stimulating Agents Market Revenues & Volume By Anemia for the Period 2022 - 2032F
- Historical Data and Forecast of Australia Erythropoietin Stimulating Agents Market Revenues & Volume By Neural Disease for the Period 2022 - 2032F
- Historical Data and Forecast of Australia Erythropoietin Stimulating Agents Market Revenues & Volume By Wound Healing for the Period 2022 - 2032F
- Historical Data and Forecast of Australia Erythropoietin Stimulating Agents Market Revenues & Volume By Antiretroviral Treatment (ART) for the Period 2022 - 2032F
- Historical Data and Forecast of Australia Erythropoietin Stimulating Agents Market Revenues & Volume By Cancer Chemotherapy for the Period 2022 - 2032F
- Australia Erythropoietin Stimulating Agents Import Export Trade Statistics
- Market Opportunity Assessment By Product Type
- Market Opportunity Assessment By Disease Cured
- Australia Erythropoietin Stimulating Agents Top Companies Market Share
- Australia Erythropoietin Stimulating Agents Competitive Benchmarking By Technical and Operational Parameters
- Australia Erythropoietin Stimulating Agents Company Profiles
- Australia Erythropoietin Stimulating Agents Key Strategic Recommendations
Australia Erythropoietin Stimulating Agents Market (2026-2032): FAQs
6Wresearch actively monitors the Australia Erythropoietin Stimulating Agents Market and publishes its comprehensive annual report, highlighting emerging trends, growth drivers, revenue analysis, and forecast outlook. Our insights help businesses to make data-backed strategic decisions with ongoing market dynamics. Our analysts track relevent industries related to the Australia Erythropoietin Stimulating Agents Market, allowing our clients with actionable intelligence and reliable forecasts tailored to emerging regional needs.
Yes, we provide customisation as per your requirements. To learn more, feel free to contact us on sales@6wresearch.com
1 Executive Summary |
2 Introduction |
2.1 Key Highlights of the Report |
2.2 Report Description |
2.3 Market Scope & Segmentation |
2.4 Research Methodology |
2.5 Assumptions |
3 Australia Erythropoietin Stimulating Agents Market Overview |
3.1 Australia Country Macro Economic Indicators |
3.2 Australia Erythropoietin Stimulating Agents Market Revenues & Volume, 2022 & 2032F |
3.3 Australia Erythropoietin Stimulating Agents Market - Industry Life Cycle |
3.4 Australia Erythropoietin Stimulating Agents Market - Porter's Five Forces |
3.5 Australia Erythropoietin Stimulating Agents Market Revenues & Volume Share, By Product Type, 2022 & 2032F |
3.6 Australia Erythropoietin Stimulating Agents Market Revenues & Volume Share, By Disease Cured, 2022 & 2032F |
4 Australia Erythropoietin Stimulating Agents Market Dynamics |
4.1 Impact Analysis |
4.2 Market Drivers |
4.2.1 Increasing prevalence of chronic kidney disease in Australia |
4.2.2 Rising geriatric population requiring treatment for anemia |
4.2.3 Technological advancements in erythropoietin stimulating agents leading to improved efficacy and safety |
4.3 Market Restraints |
4.3.1 Stringent regulatory requirements for approval and marketing of erythropoietin stimulating agents |
4.3.2 Potential adverse effects associated with the use of erythropoietin stimulating agents |
5 Australia Erythropoietin Stimulating Agents Market Trends |
6 Australia Erythropoietin Stimulating Agents Market, By Types |
6.1 Australia Erythropoietin Stimulating Agents Market, By Product Type |
6.1.1 Overview and Analysis |
6.1.2 Australia Erythropoietin Stimulating Agents Market Revenues & Volume, By Product Type, 2022 - 2032F |
6.1.3 Australia Erythropoietin Stimulating Agents Market Revenues & Volume, By Epoetin-Alfa, 2022 - 2032F |
6.1.4 Australia Erythropoietin Stimulating Agents Market Revenues & Volume, By Epoetin-Beta, 2022 - 2032F |
6.1.5 Australia Erythropoietin Stimulating Agents Market Revenues & Volume, By Epoetin-Omega, 2022 - 2032F |
6.1.6 Australia Erythropoietin Stimulating Agents Market Revenues & Volume, By Epoetin-Delta, 2022 - 2032F |
6.1.7 Australia Erythropoietin Stimulating Agents Market Revenues & Volume, By Darbepoetin-Alfa, 2022 - 2032F |
6.2 Australia Erythropoietin Stimulating Agents Market, By Disease Cured |
6.2.1 Overview and Analysis |
6.2.2 Australia Erythropoietin Stimulating Agents Market Revenues & Volume, By Oncology Diseases, 2022 - 2032F |
6.2.3 Australia Erythropoietin Stimulating Agents Market Revenues & Volume, By Kidney Disorders, 2022 - 2032F |
6.2.4 Australia Erythropoietin Stimulating Agents Market Revenues & Volume, By Anemia, 2022 - 2032F |
6.2.5 Australia Erythropoietin Stimulating Agents Market Revenues & Volume, By Neural Disease, 2022 - 2032F |
6.2.6 Australia Erythropoietin Stimulating Agents Market Revenues & Volume, By Wound Healing, 2022 - 2032F |
6.2.7 Australia Erythropoietin Stimulating Agents Market Revenues & Volume, By Antiretroviral Treatment (ART), 2022 - 2032F |
7 Australia Erythropoietin Stimulating Agents Market Import-Export Trade Statistics |
7.1 Australia Erythropoietin Stimulating Agents Market Export to Major Countries |
7.2 Australia Erythropoietin Stimulating Agents Market Imports from Major Countries |
8 Australia Erythropoietin Stimulating Agents Market Key Performance Indicators |
8.1 Number of patients diagnosed with anemia related to chronic kidney disease |
8.2 Adoption rate of newer erythropoietin stimulating agents in the market |
8.3 Average time taken for regulatory approval of erythropoietin stimulating agents in Australia |
9 Australia Erythropoietin Stimulating Agents Market - Opportunity Assessment |
9.1 Australia Erythropoietin Stimulating Agents Market Opportunity Assessment, By Product Type, 2022 & 2032F |
9.2 Australia Erythropoietin Stimulating Agents Market Opportunity Assessment, By Disease Cured, 2022 & 2032F |
10 Australia Erythropoietin Stimulating Agents Market - Competitive Landscape |
10.1 Australia Erythropoietin Stimulating Agents Market Revenue Share, By Companies, 2025 |
10.2 Australia Erythropoietin Stimulating Agents Market Competitive Benchmarking, By Operating and Technical Parameters |
11 Company Profiles |
12 Recommendations |
13 Disclaimer |
Export potential assessment - trade Analytics for 2030
Export potential enables firms to identify high-growth global markets with greater confidence by combining advanced trade intelligence with a structured quantitative methodology. The framework analyzes emerging demand trends and country-level import patterns while integrating macroeconomic and trade datasets such as GDP and population forecasts, bilateral import–export flows, tariff structures, elasticity differentials between developed and developing economies, geographic distance, and import demand projections. Using weighted trade values from 2020–2024 as the base period to project country-to-country export potential for 2030, these inputs are operationalized through calculated drivers such as gravity model parameters, tariff impact factors, and projected GDP per-capita growth. Through an analysis of hidden potentials, demand hotspots, and market conditions that are most favorable to success, this method enables firms to focus on target countries, maximize returns, and global expansion with data, backed by accuracy.
By factoring in the projected importer demand gap that is currently unmet and could be potential opportunity, it identifies the potential for the Exporter (Country) among 190 countries, against the general trade analysis, which identifies the biggest importer or exporter.
To discover high-growth global markets and optimize your business strategy:
Click Here
Pricing
- Single User License$ 1,995
- Department License$ 2,400
- Site License$ 3,120
- Global License$ 3,795

Search
Thought Leadership and Analyst Meet


Our Clients
Latest Reports
- China Electric Appliance Rental Market (2026-2032) | Trends, Revenue, Growth, Challenges, Size, Value, Outlook, Pricing, Strategy, Insights, Restraints, segmentation, Companies, Investment Opportunities, Analysis, Demand, Drivers, Competition, Forecast, Share
- Chile Electric Appliance Rental Market (2026-2032) | Outlook, Competition, Drivers, Strategy, Revenue, Analysis, Value, Pricing, Restraints, Size, Demand, Share, Growth, Forecast, Challenges, Insights, Investment Opportunities, Companies, Trends, segmentation
- Cambodia Electric Appliance Rental Market (2026-2032) | Companies, Analysis, Restraints, Pricing, Insights, Challenges, Outlook, Strategy, Forecast, Trends, Competition, Value, Revenue, Investment Opportunities, segmentation, Drivers, Size, Demand, Growth, Share
- Brazil Electric Appliance Rental Market (2026-2032) | Revenue, Strategy, Forecast, Companies, segmentation, Competition, Size, Investment Opportunities, Pricing, Restraints, Outlook, Challenges, Analysis, Drivers, Value, Demand, Insights, Trends, Growth, Share
- Bangladesh Electric Appliance Rental Market (2026-2032) | Drivers, Forecast, Investment Opportunities, Strategy, Insights, Demand, Challenges, Outlook, Trends, Competition, Value, Revenue, Size, Pricing, Analysis, Companies, Restraints, segmentation, Share, Growth
- Bahrain Electric Appliance Rental Market (2026-2032) | Outlook, Size, Competition, Restraints, Drivers, Value, Trends, Investment Opportunities, Insights, Forecast, Revenue, Strategy, Growth, Share, Demand, Analysis, Challenges, Companies, segmentation, Pricing
- Azerbaijan Electric Appliance Rental Market (2026-2032) | Trends, Investment Opportunities, Restraints, Insights, Strategy, Competition, Value, Growth, Demand, Drivers, Analysis, Forecast, Size, Share, Outlook, segmentation, Pricing, Challenges, Revenue, Companies
- Australia Electric Appliance Rental Market (2026-2032) | Challenges, Restraints, Forecast, Demand, Size, Competition, Pricing, Investment Opportunities, Revenue, Trends, Drivers, Growth, Outlook, Analysis, Strategy, Value, segmentation, Insights, Companies, Share
- Argentina Electric Appliance Rental Market (2026-2032) | Growth, Trends, Insights, Outlook, Forecast, Size, Drivers, Analysis, Restraints, Challenges, Share, Revenue, Investment Opportunities, Strategy, Demand, Value, Companies, segmentation, Competition, Pricing
- Algeria Electric Appliance Rental Market (2026-2032) | Share, Size, Value, Strategy, Competition, Outlook, Challenges, Companies, Trends, Pricing, Insights, Forecast, Investment Opportunities, Revenue, Growth, Restraints, segmentation, Analysis, Demand, Drivers
Industry Events and Analyst Meet

HIMTEX 2026

India Refining Summit 2026

India EV Show 2026

EV tech India Expo 2026

Auto Tech Asia 2026
Whitepaper
- Middle East & Africa Commercial Security Market Click here to view more.
- Middle East & Africa Fire Safety Systems & Equipment Market Click here to view more.
- GCC Drone Market Click here to view more.
- Middle East Lighting Fixture Market Click here to view more.
- GCC Physical & Perimeter Security Market Click here to view more.
6WResearch In News
- Doha a strategic location for EV manufacturing hub: IPA Qatar
- Demand for luxury TVs surging in the GCC, says Samsung
- Empowering Growth: The Thriving Journey of Bangladesh’s Cable Industry
- Demand for luxury TVs surging in the GCC, says Samsung
- Video call with a traditional healer? Once unthinkable, it’s now common in South Africa
- Intelligent Buildings To Smooth GCC’s Path To Net Zero