Australia Flavored Butter Market (2026-2032) | Trends, Segmentation, Share, Analysis, Outlook, Industry, Value, Companies, Forecast, Competitive Landscape, Growth, Size & Revenue
Market Forecast By Nature (Organic, Conventional), By Product Type (Salted, Unsalted), By Format (Spreadable, Non-Spreadable), By Form (Powder, Liquid, Paste), By Applications (Milk and Dairy Products, Bakery Products, Value Added Food and Beverages, Dips and Sauces and Blends and Seasonings), By Distribution Channel (Store-Based Retailing, Online Retailing) And Competitive Landscape
| Product Code: ETC6180822 | Publication Date: Sep 2024 | Updated Date: Mar 2026 | Product Type: Market Research Report | |
| Publisher: 6Wresearch | Author: Sachin Kumar Rai | No. of Pages: 75 | No. of Figures: 35 | No. of Tables: 20 |
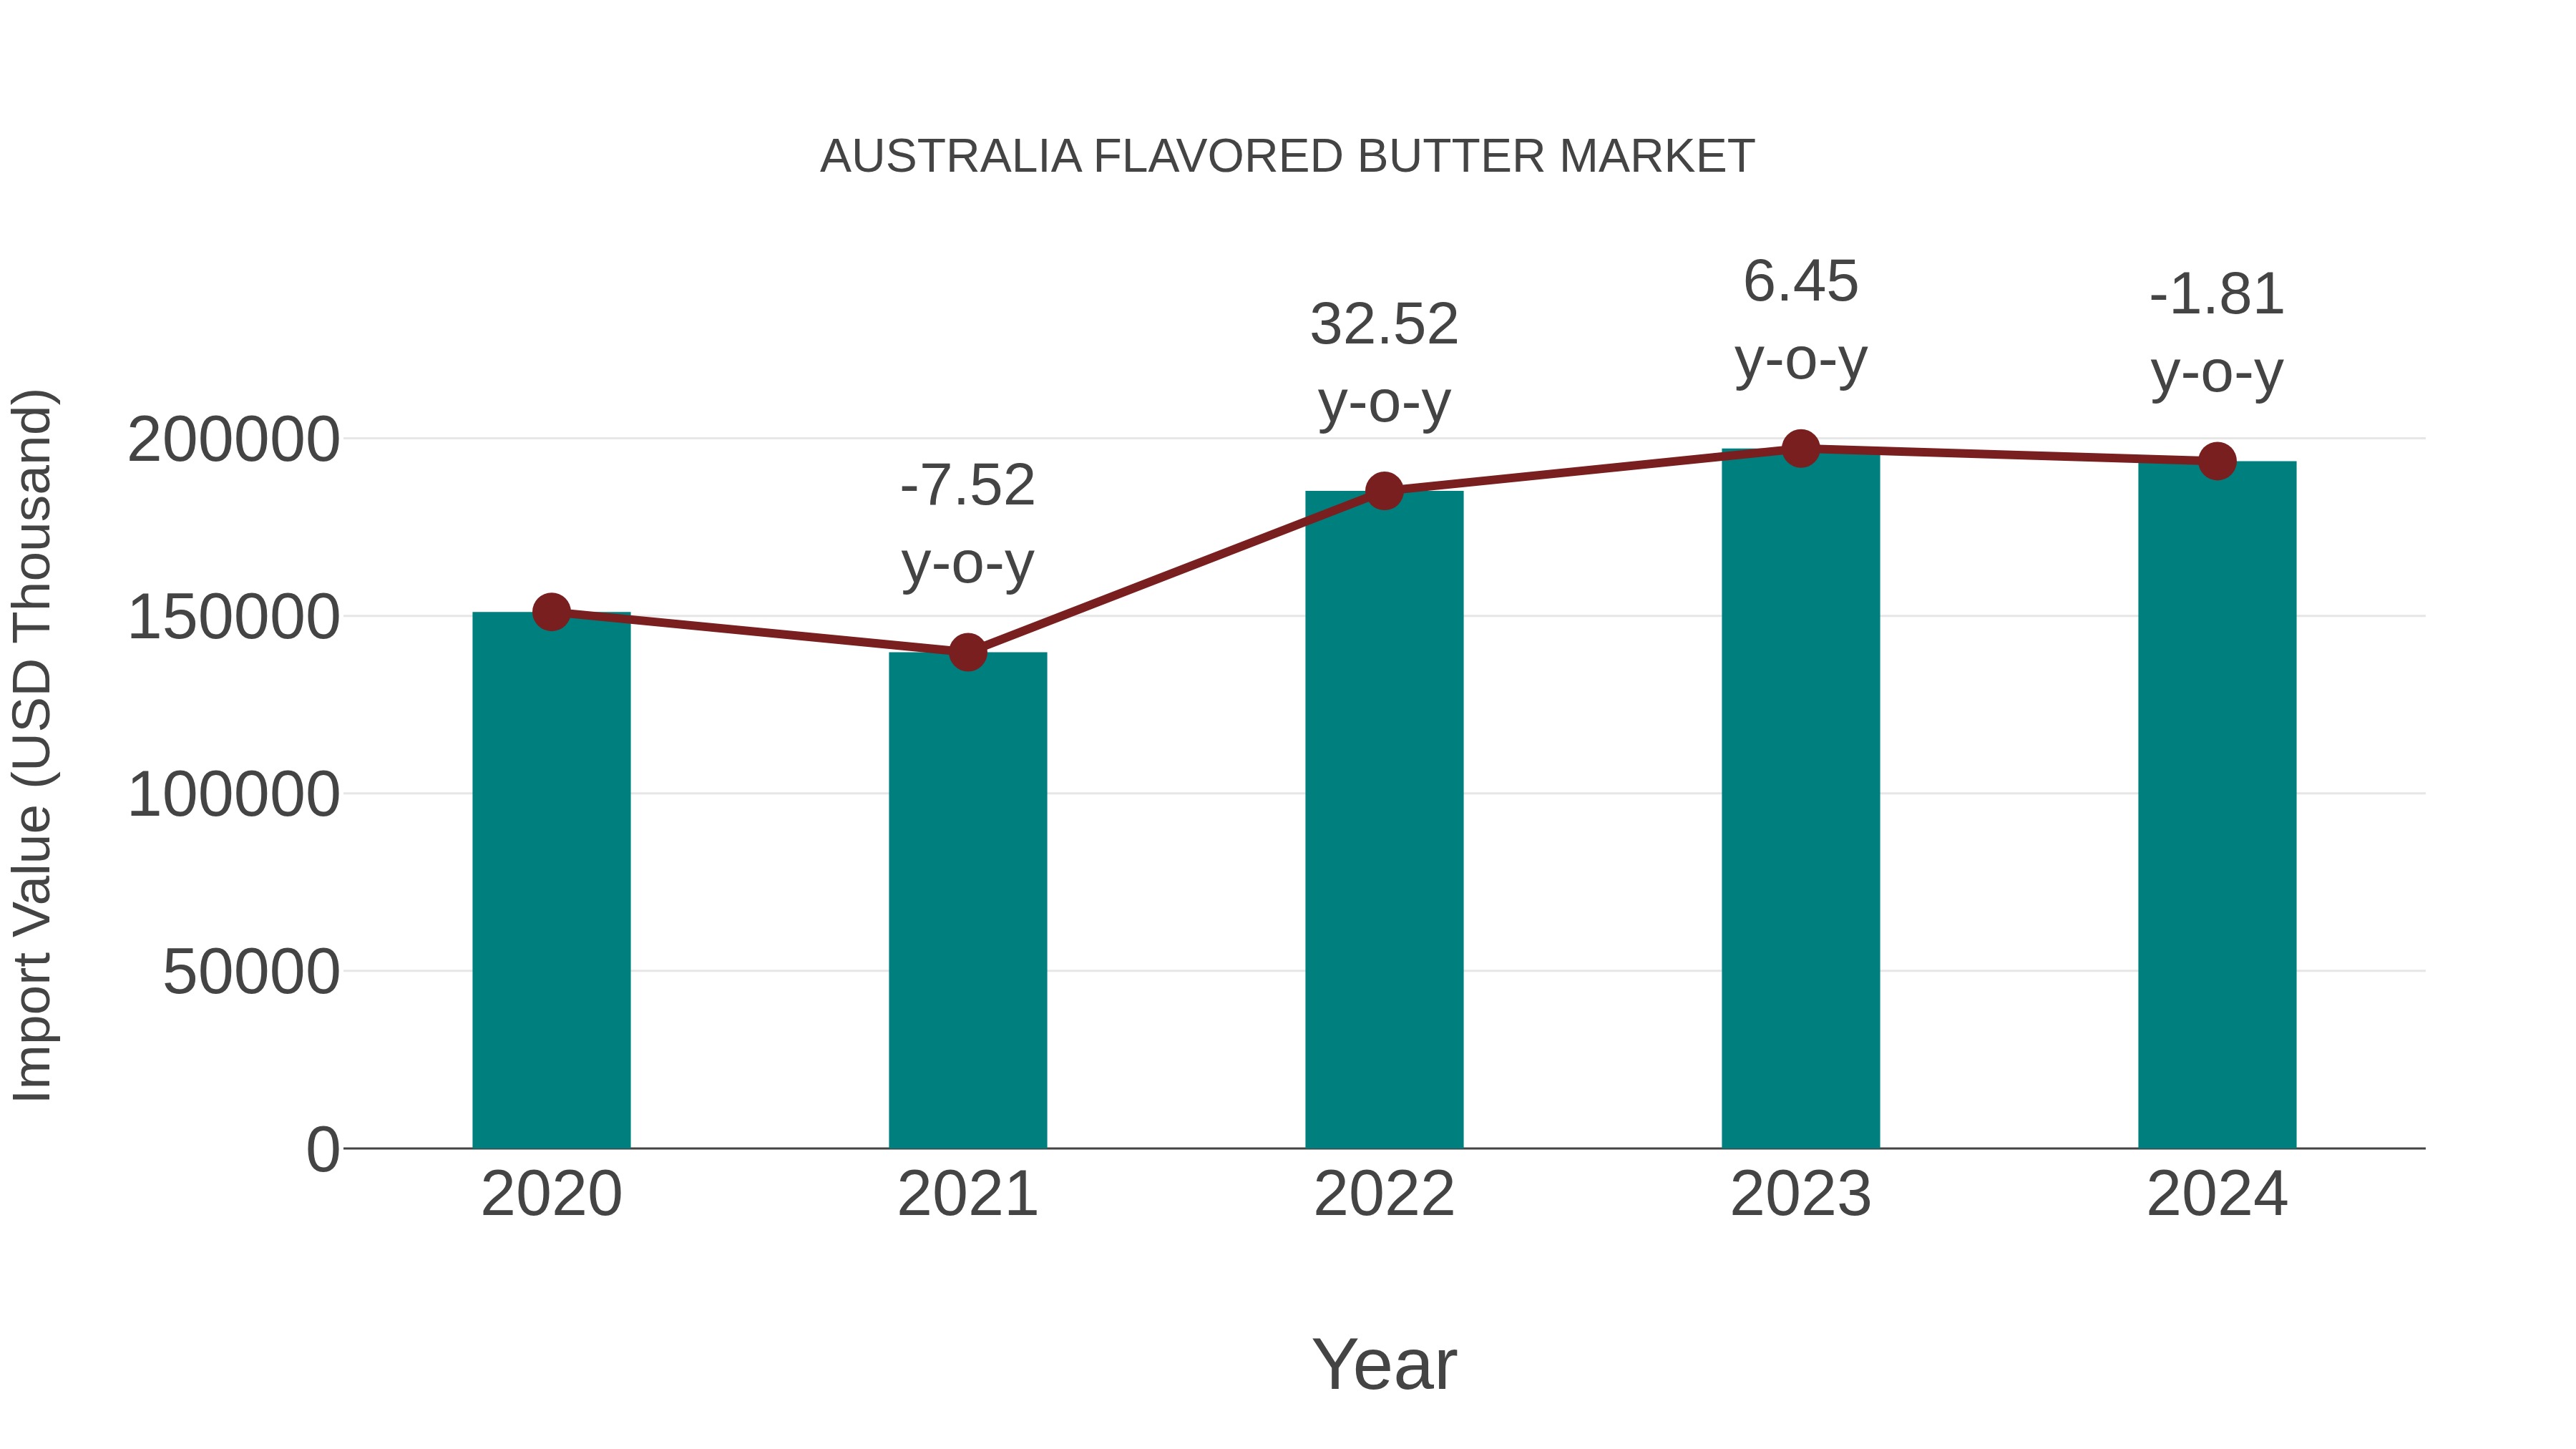
Australia Flavored Butter Market: Import Trend Analysis
In the Australia flavored butter market, the import trend experienced a slight decline, with a growth rate of -1.81% from 2023 to 2024. However, the compound annual growth rate (CAGR) for the period 2020-2024 stood at a healthy 6.39%. This dip in import momentum may be attributed to shifts in consumer preferences or changes in trade policies impacting market stability.
Australia Flavored Butter Market Overview
The flavored butter market in Australia is expanding as consumers seek premium and gourmet food products with unique taste profiles. Flavored butters infused with herbs, spices, and natural extracts cater to the rising trend of home cooking and artisanal food preparation. This market benefits from growing awareness of the nutritional value of butter and its versatile applications in both cooking and baking. Product innovation, including lactose-free and organic flavored butter variants, is also contributing to market growth.
Trends of the market
The flavored butter market in Australia is witnessing increased consumer interest in gourmet and artisanal products. Variants such as garlic, herb, chili, and truffle-flavored butter are gaining popularity, especially in the hospitality and home-cooking segments. Growth is also supported by the increasing demand for value-added dairy products and the growing trend of culinary experimentation among Australian consumers.
Challenges of the market
This market faces challenges related to maintaining product freshness and stability, especially with natural flavor additives. High competition from margarine and plant-based spreads also affects growth. Regulatory requirements around dairy labeling and allergens add further complexity to product innovation and distribution.
Investment opportunities in the Market
Investment in the flavored butter market is supported by the growing popularity of artisanal and gourmet dairy products in Australia. There is an opportunity to develop unique flavored butter variants targeting premium segments and foodservice industries, such as restaurants and bakeries. Innovations in packaging and shelf life enhancement can further boost product appeal. Expanding distribution channels to include online retail and specialty stores can also widen consumer reach.
Government Policy of the market
Australias flavored butter market is governed by dairy industry regulations enforced by the Department of Agriculture, Water and the Environment, alongside FSANZ food safety standards. Policies focus on milk quality, dairy product composition, and labeling accuracy to protect consumers and uphold product authenticity. The government also supports the promotion of locally produced dairy products through marketing and export facilitation policies. Restrictions on certain flavor additives are in place to ensure consumer health and maintain industry standards.
Key Highlights of the Report:
- Australia Flavored Butter Market Outlook
- Market Size of Australia Flavored Butter Market, 2025
- Forecast of Australia Flavored Butter Market, 2032
- Historical Data and Forecast of Australia Flavored Butter Revenues & Volume for the Period 2022 - 2032F
- Australia Flavored Butter Market Trend Evolution
- Australia Flavored Butter Market Drivers and Challenges
- Australia Flavored Butter Price Trends
- Australia Flavored Butter Porter's Five Forces
- Australia Flavored Butter Industry Life Cycle
- Historical Data and Forecast of Australia Flavored Butter Market Revenues & Volume By Nature for the Period 2022 - 2032F
- Historical Data and Forecast of Australia Flavored Butter Market Revenues & Volume By Organic for the Period 2022 - 2032F
- Historical Data and Forecast of Australia Flavored Butter Market Revenues & Volume By Conventional for the Period 2022 - 2032F
- Historical Data and Forecast of Australia Flavored Butter Market Revenues & Volume By Product Type for the Period 2022 - 2032F
- Historical Data and Forecast of Australia Flavored Butter Market Revenues & Volume By Salted for the Period 2022 - 2032F
- Historical Data and Forecast of Australia Flavored Butter Market Revenues & Volume By Unsalted for the Period 2022 - 2032F
- Historical Data and Forecast of Australia Flavored Butter Market Revenues & Volume By Format for the Period 2022 - 2032F
- Historical Data and Forecast of Australia Flavored Butter Market Revenues & Volume By Spreadable for the Period 2022 - 2032F
- Historical Data and Forecast of Australia Flavored Butter Market Revenues & Volume By Non-Spreadable for the Period 2022 - 2032F
- Historical Data and Forecast of Australia Flavored Butter Market Revenues & Volume By Form for the Period 2022 - 2032F
- Historical Data and Forecast of Australia Flavored Butter Market Revenues & Volume By Powder for the Period 2022 - 2032F
- Historical Data and Forecast of Australia Flavored Butter Market Revenues & Volume By Liquid for the Period 2022 - 2032F
- Historical Data and Forecast of Australia Flavored Butter Market Revenues & Volume By Paste for the Period 2022 - 2032F
- Historical Data and Forecast of Australia Flavored Butter Market Revenues & Volume By Applications for the Period 2022 - 2032F
- Historical Data and Forecast of Australia Flavored Butter Market Revenues & Volume By Milk and Dairy Products for the Period 2022 - 2032F
- Historical Data and Forecast of Australia Flavored Butter Market Revenues & Volume By Bakery Products for the Period 2022 - 2032F
- Historical Data and Forecast of Australia Flavored Butter Market Revenues & Volume By Value Added Food and Beverages for the Period 2022 - 2032F
- Historical Data and Forecast of Australia Flavored Butter Market Revenues & Volume By Dips and Sauces and Blends and Seasonings for the Period 2022 - 2032F
- Historical Data and Forecast of Australia Flavored Butter Market Revenues & Volume By Distribution Channel for the Period 2022 - 2032F
- Historical Data and Forecast of Australia Flavored Butter Market Revenues & Volume By Store-Based Retailing for the Period 2022 - 2032F
- Historical Data and Forecast of Australia Flavored Butter Market Revenues & Volume By Online Retailing for the Period 2022 - 2032F
- Australia Flavored Butter Import Export Trade Statistics
- Market Opportunity Assessment By Nature
- Market Opportunity Assessment By Product Type
- Market Opportunity Assessment By Format
- Market Opportunity Assessment By Form
- Market Opportunity Assessment By Applications
- Market Opportunity Assessment By Distribution Channel
- Australia Flavored Butter Top Companies Market Share
- Australia Flavored Butter Competitive Benchmarking By Technical and Operational Parameters
- Australia Flavored Butter Company Profiles
- Australia Flavored Butter Key Strategic Recommendations
Australia Flavored Butter Market (2026-2032): FAQs
6Wresearch actively monitors the Australia Flavored Butter Market and publishes its comprehensive annual report, highlighting emerging trends, growth drivers, revenue analysis, and forecast outlook. Our insights help businesses to make data-backed strategic decisions with ongoing market dynamics. Our analysts track relevent industries related to the Australia Flavored Butter Market, allowing our clients with actionable intelligence and reliable forecasts tailored to emerging regional needs.
Yes, we provide customisation as per your requirements. To learn more, feel free to contact us on sales@6wresearch.com
1 Executive Summary |
2 Introduction |
2.1 Key Highlights of the Report |
2.2 Report Description |
2.3 Market Scope & Segmentation |
2.4 Research Methodology |
2.5 Assumptions |
3 Australia Flavored Butter Market Overview |
3.1 Australia Country Macro Economic Indicators |
3.2 Australia Flavored Butter Market Revenues & Volume, 2022 & 2032F |
3.3 Australia Flavored Butter Market - Industry Life Cycle |
3.4 Australia Flavored Butter Market - Porter's Five Forces |
3.5 Australia Flavored Butter Market Revenues & Volume Share, By Nature, 2022 & 2032F |
3.6 Australia Flavored Butter Market Revenues & Volume Share, By Product Type, 2022 & 2032F |
3.7 Australia Flavored Butter Market Revenues & Volume Share, By Format, 2022 & 2032F |
3.8 Australia Flavored Butter Market Revenues & Volume Share, By Form, 2022 & 2032F |
3.9 Australia Flavored Butter Market Revenues & Volume Share, By Applications, 2022 & 2032F |
3.10 Australia Flavored Butter Market Revenues & Volume Share, By Distribution Channel, 2022 & 2032F |
4 Australia Flavored Butter Market Dynamics |
4.1 Impact Analysis |
4.2 Market Drivers |
4.2.1 Increasing consumer demand for premium and gourmet food products |
4.2.2 Growing interest in unique and artisanal flavors in food products |
4.2.3 Rising awareness about health benefits of using natural ingredients in food products |
4.3 Market Restraints |
4.3.1 Fluctuating prices of key ingredients like butter and flavorings |
4.3.2 Intense competition from other spreads and condiments in the market |
4.3.3 Regulatory challenges related to food labeling and quality standards |
5 Australia Flavored Butter Market Trends |
6 Australia Flavored Butter Market, By Types |
6.1 Australia Flavored Butter Market, By Nature |
6.1.1 Overview and Analysis |
6.1.2 Australia Flavored Butter Market Revenues & Volume, By Nature, 2022 - 2032F |
6.1.3 Australia Flavored Butter Market Revenues & Volume, By Organic, 2022 - 2032F |
6.1.4 Australia Flavored Butter Market Revenues & Volume, By Conventional, 2022 - 2032F |
6.2 Australia Flavored Butter Market, By Product Type |
6.2.1 Overview and Analysis |
6.2.2 Australia Flavored Butter Market Revenues & Volume, By Salted, 2022 - 2032F |
6.2.3 Australia Flavored Butter Market Revenues & Volume, By Unsalted, 2022 - 2032F |
6.3 Australia Flavored Butter Market, By Format |
6.3.1 Overview and Analysis |
6.3.2 Australia Flavored Butter Market Revenues & Volume, By Spreadable, 2022 - 2032F |
6.3.3 Australia Flavored Butter Market Revenues & Volume, By Non-Spreadable, 2022 - 2032F |
6.4 Australia Flavored Butter Market, By Form |
6.4.1 Overview and Analysis |
6.4.2 Australia Flavored Butter Market Revenues & Volume, By Powder, 2022 - 2032F |
6.4.3 Australia Flavored Butter Market Revenues & Volume, By Liquid, 2022 - 2032F |
6.4.4 Australia Flavored Butter Market Revenues & Volume, By Paste, 2022 - 2032F |
6.5 Australia Flavored Butter Market, By Applications |
6.5.1 Overview and Analysis |
6.5.2 Australia Flavored Butter Market Revenues & Volume, By Milk and Dairy Products, 2022 - 2032F |
6.5.3 Australia Flavored Butter Market Revenues & Volume, By Bakery Products, 2022 - 2032F |
6.5.4 Australia Flavored Butter Market Revenues & Volume, By Value Added Food and Beverages, 2022 - 2032F |
6.5.5 Australia Flavored Butter Market Revenues & Volume, By Dips and Sauces, 2022 - 2032F |
6.5.6 Australia Flavored Butter Market Revenues & Volume, By Blends and Seasonings, 2022 - 2032F |
6.6 Australia Flavored Butter Market, By Distribution Channel |
6.6.1 Overview and Analysis |
6.6.2 Australia Flavored Butter Market Revenues & Volume, By Store-Based Retailing, 2022 - 2032F |
6.6.3 Australia Flavored Butter Market Revenues & Volume, By Online Retailing, 2022 - 2032F |
7 Australia Flavored Butter Market Import-Export Trade Statistics |
7.1 Australia Flavored Butter Market Export to Major Countries |
7.2 Australia Flavored Butter Market Imports from Major Countries |
8 Australia Flavored Butter Market Key Performance Indicators |
8.1 Consumer engagement metrics on social media platforms showcasing interest in flavored butter products |
8.2 Number of new product launches and flavor variations in the flavored butter market |
8.3 Growth in the number of specialty stores and online platforms offering a wide range of flavored butter options |
9 Australia Flavored Butter Market - Opportunity Assessment |
9.1 Australia Flavored Butter Market Opportunity Assessment, By Nature, 2022 & 2032F |
9.2 Australia Flavored Butter Market Opportunity Assessment, By Product Type, 2022 & 2032F |
9.3 Australia Flavored Butter Market Opportunity Assessment, By Format, 2022 & 2032F |
9.4 Australia Flavored Butter Market Opportunity Assessment, By Form, 2022 & 2032F |
9.5 Australia Flavored Butter Market Opportunity Assessment, By Applications, 2022 & 2032F |
9.6 Australia Flavored Butter Market Opportunity Assessment, By Distribution Channel, 2022 & 2032F |
10 Australia Flavored Butter Market - Competitive Landscape |
10.1 Australia Flavored Butter Market Revenue Share, By Companies, 2025 |
10.2 Australia Flavored Butter Market Competitive Benchmarking, By Operating and Technical Parameters |
11 Company Profiles |
12 Recommendations |
13 Disclaimer |
Export potential assessment - trade Analytics for 2030
Export potential enables firms to identify high-growth global markets with greater confidence by combining advanced trade intelligence with a structured quantitative methodology. The framework analyzes emerging demand trends and country-level import patterns while integrating macroeconomic and trade datasets such as GDP and population forecasts, bilateral import–export flows, tariff structures, elasticity differentials between developed and developing economies, geographic distance, and import demand projections. Using weighted trade values from 2020–2024 as the base period to project country-to-country export potential for 2030, these inputs are operationalized through calculated drivers such as gravity model parameters, tariff impact factors, and projected GDP per-capita growth. Through an analysis of hidden potentials, demand hotspots, and market conditions that are most favorable to success, this method enables firms to focus on target countries, maximize returns, and global expansion with data, backed by accuracy.
By factoring in the projected importer demand gap that is currently unmet and could be potential opportunity, it identifies the potential for the Exporter (Country) among 190 countries, against the general trade analysis, which identifies the biggest importer or exporter.
To discover high-growth global markets and optimize your business strategy:
Click Here
Pricing
- Single User License$ 1,995
- Department License$ 2,400
- Site License$ 3,120
- Global License$ 3,795

Search
Thought Leadership and Analyst Meet


Our Clients
Latest Reports
- Canada Cloud CFD Market (2026-2032) | Size & Revenue, Industry, Growth, Competitive Landscape, Forecast, Segmentation, Value, Outlook, Trends, Share, Analysis, Companies
- Taiwan Food Delivery Platform Market (2026-2032) | Companies, Outlook, Analysis, Trends, Value, Revenue, Segmentation, Share, Forecast, Competitive Landscape, Growth, Size & Forecast
- United Kingdom (UK) Long-term Care Insurance Market (2026-2032) | Growth, Share, Consumer Insights, Drivers, Opportunities, Competition, Pricing Analysis, Segments, Restraints, Companies, Competitive, Value, Outlook, Size, Demand, Analysis, Challenges, Strategic Insights, Investment Trends, Revenue, Trends, Supply, Forecast
- United Kingdom (UK) Long Term Care Market (2026-2032) | Companies, Outlook, Analysis, Trends, Value, Revenue, Segmentation, Share, Forecast, Competitive Landscape, Growth, Size & Forecast
- Iraq Insulation and Waterproofing Market (2026-2032) | Outlook, Drivers, Growth, Size, Share, Industry, Revenue, Trends, Demand, Competitive, Strategic Insights, Opportunities, Segments, Companies, Challenges, Strategy, Consumer Insights, Analysis, Investment Trends, Value, Segmentation, Forecast, Restraints
- India Switchgear Market Outlook (2026-2032) | Size, Share, Trends, Growth, Revenue, Forecast, Analysis, Value, Outlook
- Pakistan Contraceptive Implants Market (2025-2031) | Demand, Growth, Size, Share, Industry, Pricing Analysis, Competitive, Strategic Insights, Strategy, Consumer Insights, Analysis, Investment Trends, Opportunities, Revenue, Segments, Value, Segmentation, Supply, Forecast, Restraints, Outlook, Competition, Drivers, Trends, Companies, Challenges
- Sri Lanka Packaging Market (2026-2032) | Outlook, Competition, Drivers, Trends, Demand, Pricing Analysis, Competitive, Strategic Insights, Companies, Challenges, Strategy, Consumer Insights, Analysis, Investment Trends, Opportunities, Growth, Size, Share, Industry, Revenue, Segments, Value, Segmentation, Supply, Forecast, Restraints
- India Kids Watches Market (2026-2032) | Strategy, Consumer Insights, Analysis, Investment Trends, Opportunities, Growth, Size, Share, Industry, Revenue, Segments, Value, Segmentation, Supply, Forecast, Restraints, Outlook, Competition, Drivers, Trends, Demand, Pricing Analysis, Competitive, Strategic Insights, Companies, Challenges
- Saudi Arabia Core Assurance Service Market (2025-2031) | Strategy, Consumer Insights, Analysis, Investment Trends, Opportunities, Growth, Size, Share, Industry, Revenue, Segments, Value, Segmentation, Supply, Forecast, Restraints, Outlook, Competition, Drivers, Trends, Demand, Pricing Analysis, Competitive, Strategic Insights, Companies, Challenges
Industry Events and Analyst Meet

India EV Show 2026

EV tech India Expo 2026

Auto Tech Asia 2026

Battery Tech India 2026

Smart Production Solutions Guangzhou 2026
Whitepaper
- Middle East & Africa Commercial Security Market Click here to view more.
- Middle East & Africa Fire Safety Systems & Equipment Market Click here to view more.
- GCC Drone Market Click here to view more.
- Middle East Lighting Fixture Market Click here to view more.
- GCC Physical & Perimeter Security Market Click here to view more.
6WResearch In News
- Doha a strategic location for EV manufacturing hub: IPA Qatar
- Demand for luxury TVs surging in the GCC, says Samsung
- Empowering Growth: The Thriving Journey of Bangladesh’s Cable Industry
- Demand for luxury TVs surging in the GCC, says Samsung
- Video call with a traditional healer? Once unthinkable, it’s now common in South Africa
- Intelligent Buildings To Smooth GCC’s Path To Net Zero