Australia Flavoured Tea Market (2026-2032) | Trends, Share, Industry, Segmentation, Companies, Growth, Analysis, Size & Revenue, Value, Forecast, Outlook, Competitive Landscape
Market Forecast By Type (Loose Leaf Tea, CTC Tea), By Flavour (Fruits, Flower, Herbs and Spices), By Packaging format (Packed, Loose), By Product Type (Black Tea, Green Tea, Herbal Tea, Oolong Tea), By Distribution Channel (Online and Offline, Supermarkets/Hypermarkets) And Competitive Landscape
| Product Code: ETC6180839 | Publication Date: Sep 2024 | Updated Date: Mar 2026 | Product Type: Market Research Report | |
| Publisher: 6Wresearch | Author: Ravi Bhandari | No. of Pages: 75 | No. of Figures: 35 | No. of Tables: 20 |
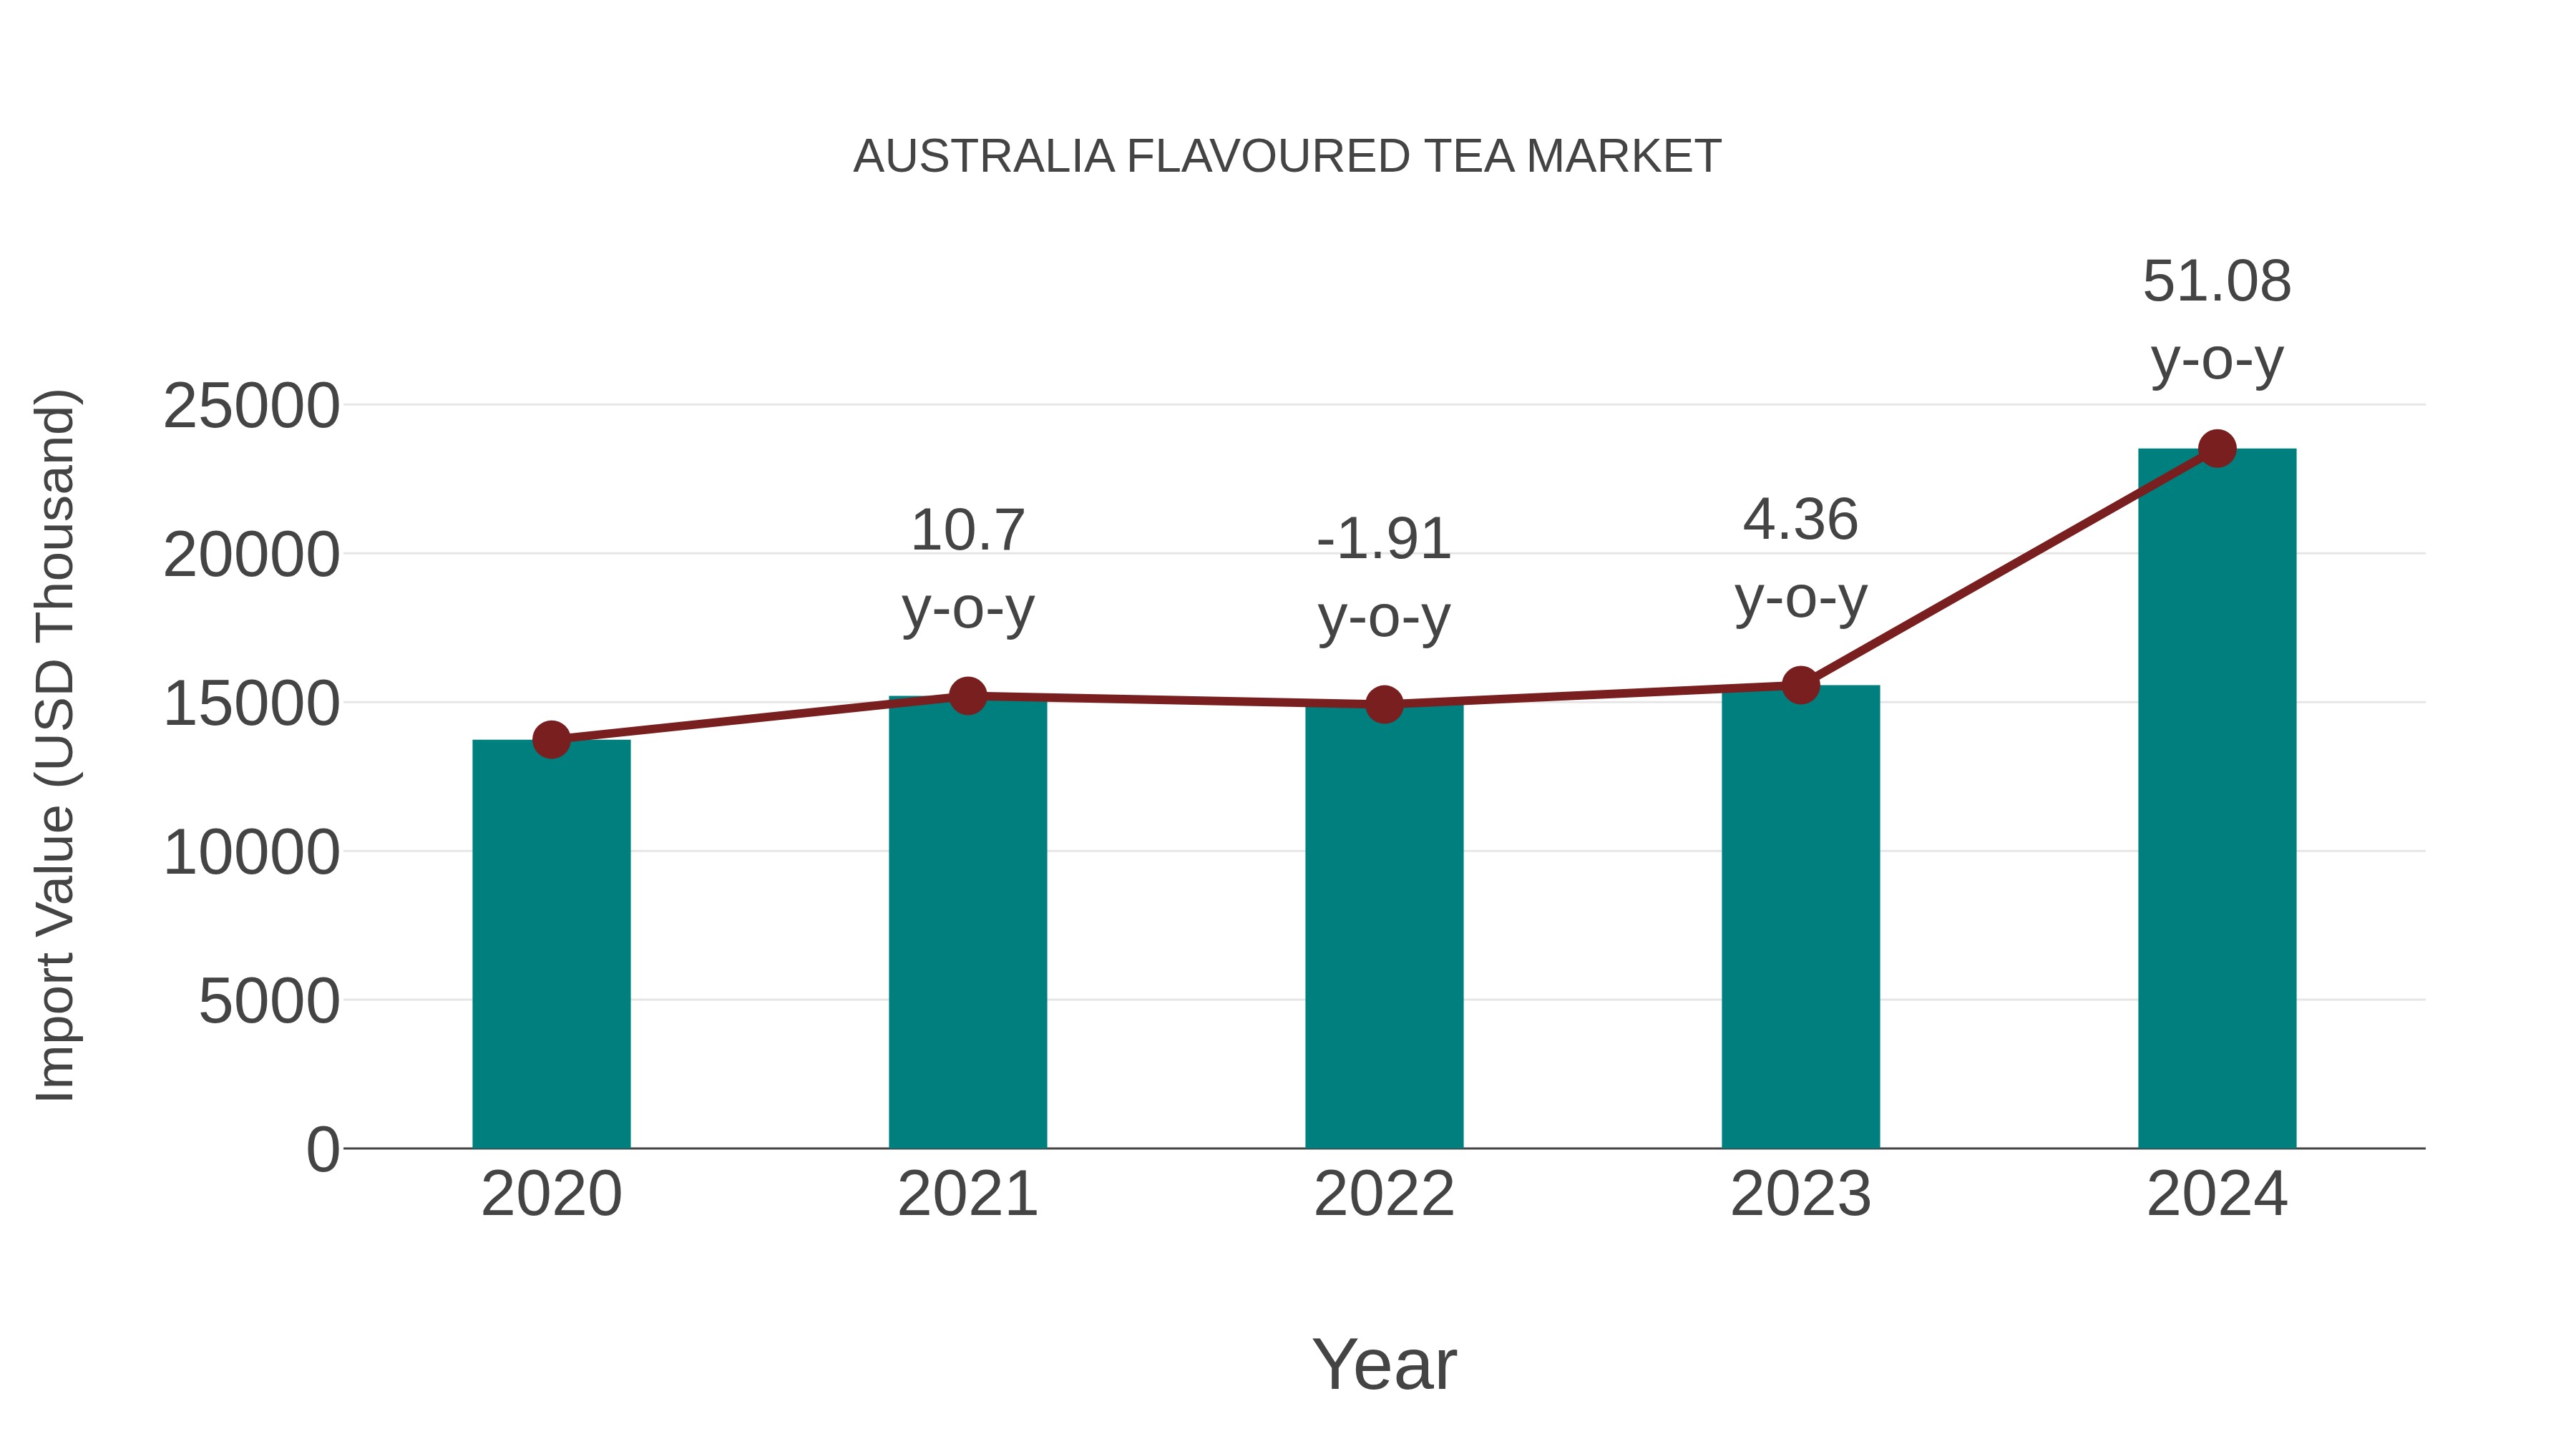
Australia Flavoured Tea Market: Import Trend Analysis
Australia`s import trend for the flavored tea market showed robust growth, with a notable 51.08% increase from 2023 to 2024. The compound annual growth rate (CAGR) for 2020-2024 stood at 14.39%. This surge in imports can be attributed to shifting consumer preferences towards diverse tea flavors and increased demand for premium tea products.
Australia Flavoured Tea Market Overview
The flavoured tea market in Australia is expanding as consumers increasingly seek diverse taste experiences and wellness benefits from tea consumption. Varieties include fruit-infused, herbal, and spiced teas, with both traditional and innovative blends gaining popularity. Health trends promoting antioxidants and natural ingredients drive product development. The rise of specialty tea shops and online sales channels supports market penetration.
Trends of the market
The flavoured tea market in Australia continues to expand, particularly in the herbal and wellness segments. Consumers are seeking out blends with added benefits such as stress relief, detoxification, or energy boosts. Floral and fruit flavors, like hibiscus, chamomile, and peach, are particularly favored in both loose-leaf and ready-to-drink forms.
Challenges of the market
This market is challenged by fluctuating global tea prices and competition from ready-to-drink options and herbal infusions. Balancing flavor profiles while keeping them free from artificial additives is difficult. Consumers` preference for premium and organic varieties also raises cost and sourcing issues.
Investment opportunities in the Market
The flavored tea market is expanding with consumer preferences shifting towards exotic and health-enhancing blends. Investment opportunities include developing unique flavor combinations incorporating native Australian botanicals and superfoods. There is also demand for organic and sustainably sourced teas with innovative packaging. Creating ready-to-drink flavored tea products for convenience can tap into busy urban lifestyles, widening the market further.
Government Policy of the market
Australias flavored tea market is governed by food safety regulations requiring accurate ingredient disclosure and permissible additive use. FSANZ standards apply to flavorings used in teas, ensuring they meet safety thresholds. Import controls affect tea leaves and flavor compounds, emphasizing quality and biosecurity. Marketing and labeling laws prevent misleading health claims. Additionally, government initiatives encouraging the consumption of healthier beverages influence product innovation in flavored tea offerings.
Key Highlights of the Report:
- Australia Flavoured Tea Market Outlook
- Market Size of Australia Flavoured Tea Market, 2025
- Forecast of Australia Flavoured Tea Market, 2032
- Historical Data and Forecast of Australia Flavoured Tea Revenues & Volume for the Period 2022 - 2032F
- Australia Flavoured Tea Market Trend Evolution
- Australia Flavoured Tea Market Drivers and Challenges
- Australia Flavoured Tea Price Trends
- Australia Flavoured Tea Porter's Five Forces
- Australia Flavoured Tea Industry Life Cycle
- Historical Data and Forecast of Australia Flavoured Tea Market Revenues & Volume By Type for the Period 2022 - 2032F
- Historical Data and Forecast of Australia Flavoured Tea Market Revenues & Volume By Loose Leaf Tea for the Period 2022 - 2032F
- Historical Data and Forecast of Australia Flavoured Tea Market Revenues & Volume By CTC Tea for the Period 2022 - 2032F
- Historical Data and Forecast of Australia Flavoured Tea Market Revenues & Volume By Flavour for the Period 2022 - 2032F
- Historical Data and Forecast of Australia Flavoured Tea Market Revenues & Volume By Fruits for the Period 2022 - 2032F
- Historical Data and Forecast of Australia Flavoured Tea Market Revenues & Volume By Flower for the Period 2022 - 2032F
- Historical Data and Forecast of Australia Flavoured Tea Market Revenues & Volume By Herbs and Spices for the Period 2022 - 2032F
- Historical Data and Forecast of Australia Flavoured Tea Market Revenues & Volume By Packaging format for the Period 2022 - 2032F
- Historical Data and Forecast of Australia Flavoured Tea Market Revenues & Volume By Packed for the Period 2022 - 2032F
- Historical Data and Forecast of Australia Flavoured Tea Market Revenues & Volume By Loose for the Period 2022 - 2032F
- Historical Data and Forecast of Australia Flavoured Tea Market Revenues & Volume By Product Type for the Period 2022 - 2032F
- Historical Data and Forecast of Australia Flavoured Tea Market Revenues & Volume By Black Tea for the Period 2022 - 2032F
- Historical Data and Forecast of Australia Flavoured Tea Market Revenues & Volume By Green Tea for the Period 2022 - 2032F
- Historical Data and Forecast of Australia Flavoured Tea Market Revenues & Volume By Herbal Tea for the Period 2022 - 2032F
- Historical Data and Forecast of Australia Flavoured Tea Market Revenues & Volume By Oolong Tea for the Period 2022 - 2032F
- Historical Data and Forecast of Australia Flavoured Tea Market Revenues & Volume By Distribution Channel for the Period 2022 - 2032F
- Historical Data and Forecast of Australia Flavoured Tea Market Revenues & Volume By Online and Offline for the Period 2022 - 2032F
- Historical Data and Forecast of Australia Flavoured Tea Market Revenues & Volume By Supermarkets/Hypermarkets for the Period 2022 - 2032F
- Australia Flavoured Tea Import Export Trade Statistics
- Market Opportunity Assessment By Type
- Market Opportunity Assessment By Flavour
- Market Opportunity Assessment By Packaging format
- Market Opportunity Assessment By Product Type
- Market Opportunity Assessment By Distribution Channel
- Australia Flavoured Tea Top Companies Market Share
- Australia Flavoured Tea Competitive Benchmarking By Technical and Operational Parameters
- Australia Flavoured Tea Company Profiles
- Australia Flavoured Tea Key Strategic Recommendations
Australia Flavoured Tea Market (2026-2032): FAQs
6Wresearch actively monitors the Australia Flavoured Tea Market and publishes its comprehensive annual report, highlighting emerging trends, growth drivers, revenue analysis, and forecast outlook. Our insights help businesses to make data-backed strategic decisions with ongoing market dynamics. Our analysts track relevent industries related to the Australia Flavoured Tea Market, allowing our clients with actionable intelligence and reliable forecasts tailored to emerging regional needs.
Yes, we provide customisation as per your requirements. To learn more, feel free to contact us on sales@6wresearch.com
1 Executive Summary |
2 Introduction |
2.1 Key Highlights of the Report |
2.2 Report Description |
2.3 Market Scope & Segmentation |
2.4 Research Methodology |
2.5 Assumptions |
3 Australia Flavoured Tea Market Overview |
3.1 Australia Country Macro Economic Indicators |
3.2 Australia Flavoured Tea Market Revenues & Volume, 2022 & 2032F |
3.3 Australia Flavoured Tea Market - Industry Life Cycle |
3.4 Australia Flavoured Tea Market - Porter's Five Forces |
3.5 Australia Flavoured Tea Market Revenues & Volume Share, By Type, 2022 & 2032F |
3.6 Australia Flavoured Tea Market Revenues & Volume Share, By Flavour, 2022 & 2032F |
3.7 Australia Flavoured Tea Market Revenues & Volume Share, By Packaging forma, 2022 & 2032F |
3.8 Australia Flavoured Tea Market Revenues & Volume Share, By Product Type, 2022 & 2032F |
3.9 Australia Flavoured Tea Market Revenues & Volume Share, By Distribution Channel, 2022 & 2032F |
4 Australia Flavoured Tea Market Dynamics |
4.1 Impact Analysis |
4.2 Market Drivers |
4.2.1 Increasing consumer awareness about health benefits of flavoured tea |
4.2.2 Growing trend towards health and wellness products |
4.2.3 Rising demand for unique and exotic tea flavors |
4.3 Market Restraints |
4.3.1 Price sensitivity of consumers towards premium flavoured tea products |
4.3.2 Competition from other beverage categories such as coffee and soft drinks |
5 Australia Flavoured Tea Market Trends |
6 Australia Flavoured Tea Market, By Types |
6.1 Australia Flavoured Tea Market, By Type |
6.1.1 Overview and Analysis |
6.1.2 Australia Flavoured Tea Market Revenues & Volume, By Type, 2022 - 2032F |
6.1.3 Australia Flavoured Tea Market Revenues & Volume, By Loose Leaf Tea, 2022 - 2032F |
6.1.4 Australia Flavoured Tea Market Revenues & Volume, By CTC Tea, 2022 - 2032F |
6.2 Australia Flavoured Tea Market, By Flavour |
6.2.1 Overview and Analysis |
6.2.2 Australia Flavoured Tea Market Revenues & Volume, By Fruits, 2022 - 2032F |
6.2.3 Australia Flavoured Tea Market Revenues & Volume, By Flower, 2022 - 2032F |
6.2.4 Australia Flavoured Tea Market Revenues & Volume, By Herbs, 2022 - 2032F |
6.2.5 Australia Flavoured Tea Market Revenues & Volume, By Spices, 2022 - 2032F |
6.3 Australia Flavoured Tea Market, By Packaging forma |
6.3.1 Overview and Analysis |
6.3.2 Australia Flavoured Tea Market Revenues & Volume, By Packed, 2022 - 2032F |
6.3.3 Australia Flavoured Tea Market Revenues & Volume, By Loose, 2022 - 2032F |
6.4 Australia Flavoured Tea Market, By Product Type |
6.4.1 Overview and Analysis |
6.4.2 Australia Flavoured Tea Market Revenues & Volume, By Black Tea, 2022 - 2032F |
6.4.3 Australia Flavoured Tea Market Revenues & Volume, By Green Tea, 2022 - 2032F |
6.4.4 Australia Flavoured Tea Market Revenues & Volume, By Herbal Tea, 2022 - 2032F |
6.4.5 Australia Flavoured Tea Market Revenues & Volume, By Oolong Tea, 2022 - 2032F |
6.4.6 Australia Flavoured Tea Market Revenues & Volume, By Other Products, 2022 - 2032F |
6.5 Australia Flavoured Tea Market, By Distribution Channel |
6.5.1 Overview and Analysis |
6.5.2 Australia Flavoured Tea Market Revenues & Volume, By Online, 2022 - 2032F |
6.5.3 Australia Flavoured Tea Market Revenues & Volume, By Offline, 2022 - 2032F |
6.5.4 Australia Flavoured Tea Market Revenues & Volume, By Supermarkets/Hypermarkets, 2022 - 2032F |
7 Australia Flavoured Tea Market Import-Export Trade Statistics |
7.1 Australia Flavoured Tea Market Export to Major Countries |
7.2 Australia Flavoured Tea Market Imports from Major Countries |
8 Australia Flavoured Tea Market Key Performance Indicators |
8.1 Number of new product launches in the flavoured tea segment |
8.2 Consumer engagement on social media platforms related to flavoured tea |
8.3 Growth in online searches for flavoured tea recipes |
8.4 Percentage increase in the consumption of herbal teas in Australia |
8.5 Number of partnerships between tea companies and health and wellness influencers or organizations |
9 Australia Flavoured Tea Market - Opportunity Assessment |
9.1 Australia Flavoured Tea Market Opportunity Assessment, By Type, 2022 & 2032F |
9.2 Australia Flavoured Tea Market Opportunity Assessment, By Flavour, 2022 & 2032F |
9.3 Australia Flavoured Tea Market Opportunity Assessment, By Packaging forma, 2022 & 2032F |
9.4 Australia Flavoured Tea Market Opportunity Assessment, By Product Type, 2022 & 2032F |
9.5 Australia Flavoured Tea Market Opportunity Assessment, By Distribution Channel, 2022 & 2032F |
10 Australia Flavoured Tea Market - Competitive Landscape |
10.1 Australia Flavoured Tea Market Revenue Share, By Companies, 2025 |
10.2 Australia Flavoured Tea Market Competitive Benchmarking, By Operating and Technical Parameters |
11 Company Profiles |
12 Recommendations |
13 Disclaimer |
Global Go To Market Strategy - 2030
Export potential enables firms to identify high-growth global markets with greater confidence by combining advanced trade intelligence with a structured quantitative methodology. The framework analyzes emerging demand trends and country-level import patterns while integrating macroeconomic and trade datasets such as GDP and population forecasts, bilateral import–export flows, tariff structures, elasticity differentials between developed and developing economies, geographic distance, and import demand projections. Using weighted trade values from 2020–2024 as the base period to project country-to-country export potential for 2030, these inputs are operationalized through calculated drivers such as gravity model parameters, tariff impact factors, and projected GDP per-capita growth. Through an analysis of hidden potentials, demand hotspots, and market conditions that are most favorable to success, this method enables firms to focus on target countries, maximize returns, and global expansion with data, backed by accuracy.
By factoring in the projected importer demand gap that is currently unmet and could be potential opportunity, it identifies the potential for the Exporter (Country) among 190 countries, against the general trade analysis, which identifies the biggest importer or exporter.
To discover high-growth global markets and optimize your business strategy:
Click Here
Pricing
- Single User License$ 1,995
- Department License$ 2,400
- Site License$ 3,120
- Global License$ 3,795

Leadership Perspectives from Industry Events
Search
Thought Leadership and Analyst Meet


Our Clients
6WResearch In News
- India Export Attractiveness Tracker 2026
- India Air Conditioner Market Set for Strong Rebound in 2026 After Weather-Led Correction and GST-Driven Recovery: 6Wresearch
- ADAS in India: How Automatic Emergency Braking, Blind Spot Detection & Driver Monitoring are Transforming Road Safety
- Doha a strategic location for EV manufacturing hub: IPA Qatar
- Demand for luxury TVs surging in the GCC, says Samsung
- Empowering Growth: The Thriving Journey of Bangladesh’s Cable Industry
Latest Reports
- Nicaragua RPG Gaming Market (2026-2032)
- New Zealand RPG Gaming Market (2026-2032)
- Netherlands RPG Gaming Market (2026-2032)
- Nauru RPG Gaming Market (2026-2032)
- Namibia RPG Gaming Market (2026-2032)
- Mozambique RPG Gaming Market (2026-2032)
- Montenegro RPG Gaming Market (2026-2032)
- Mongolia RPG Gaming Market (2026-2032)
- Monaco RPG Gaming Market (2026-2032)
- Micronesia RPG Gaming Market (2026-2032)
Industry Events and Analyst Meet

EV India Expo 2026

HIMTEX 2026

India Refining Summit 2026

India EV Show 2026

EV tech India Expo 2026
Whitepaper
- Middle East & Africa Commercial Security Market Click here to view more.
- Middle East & Africa Fire Safety Systems & Equipment Market Click here to view more.
- GCC Drone Market Click here to view more.
- Middle East Lighting Fixture Market Click here to view more.
- GCC Physical & Perimeter Security Market Click here to view more.