Australia Flexographic Inks Market (2026-2032) | Outlook, Segmentation, Industry, Share, Companies, Value, Competitive Landscape, Analysis, Size & Revenue, Forecast, Trends, Growth
Market Forecast By Type (Water-based, Solvent-based, UV-cured), By Application (Packaging, Others), By Resin (Nitrocellulose, Polyamide, Polyurethane, Acrylic) And Competitive Landscape
| Product Code: ETC6180896 | Publication Date: Sep 2024 | Updated Date: Mar 2026 | Product Type: Market Research Report | |
| Publisher: 6Wresearch | Author: Dhaval Chaurasia | No. of Pages: 75 | No. of Figures: 35 | No. of Tables: 20 |
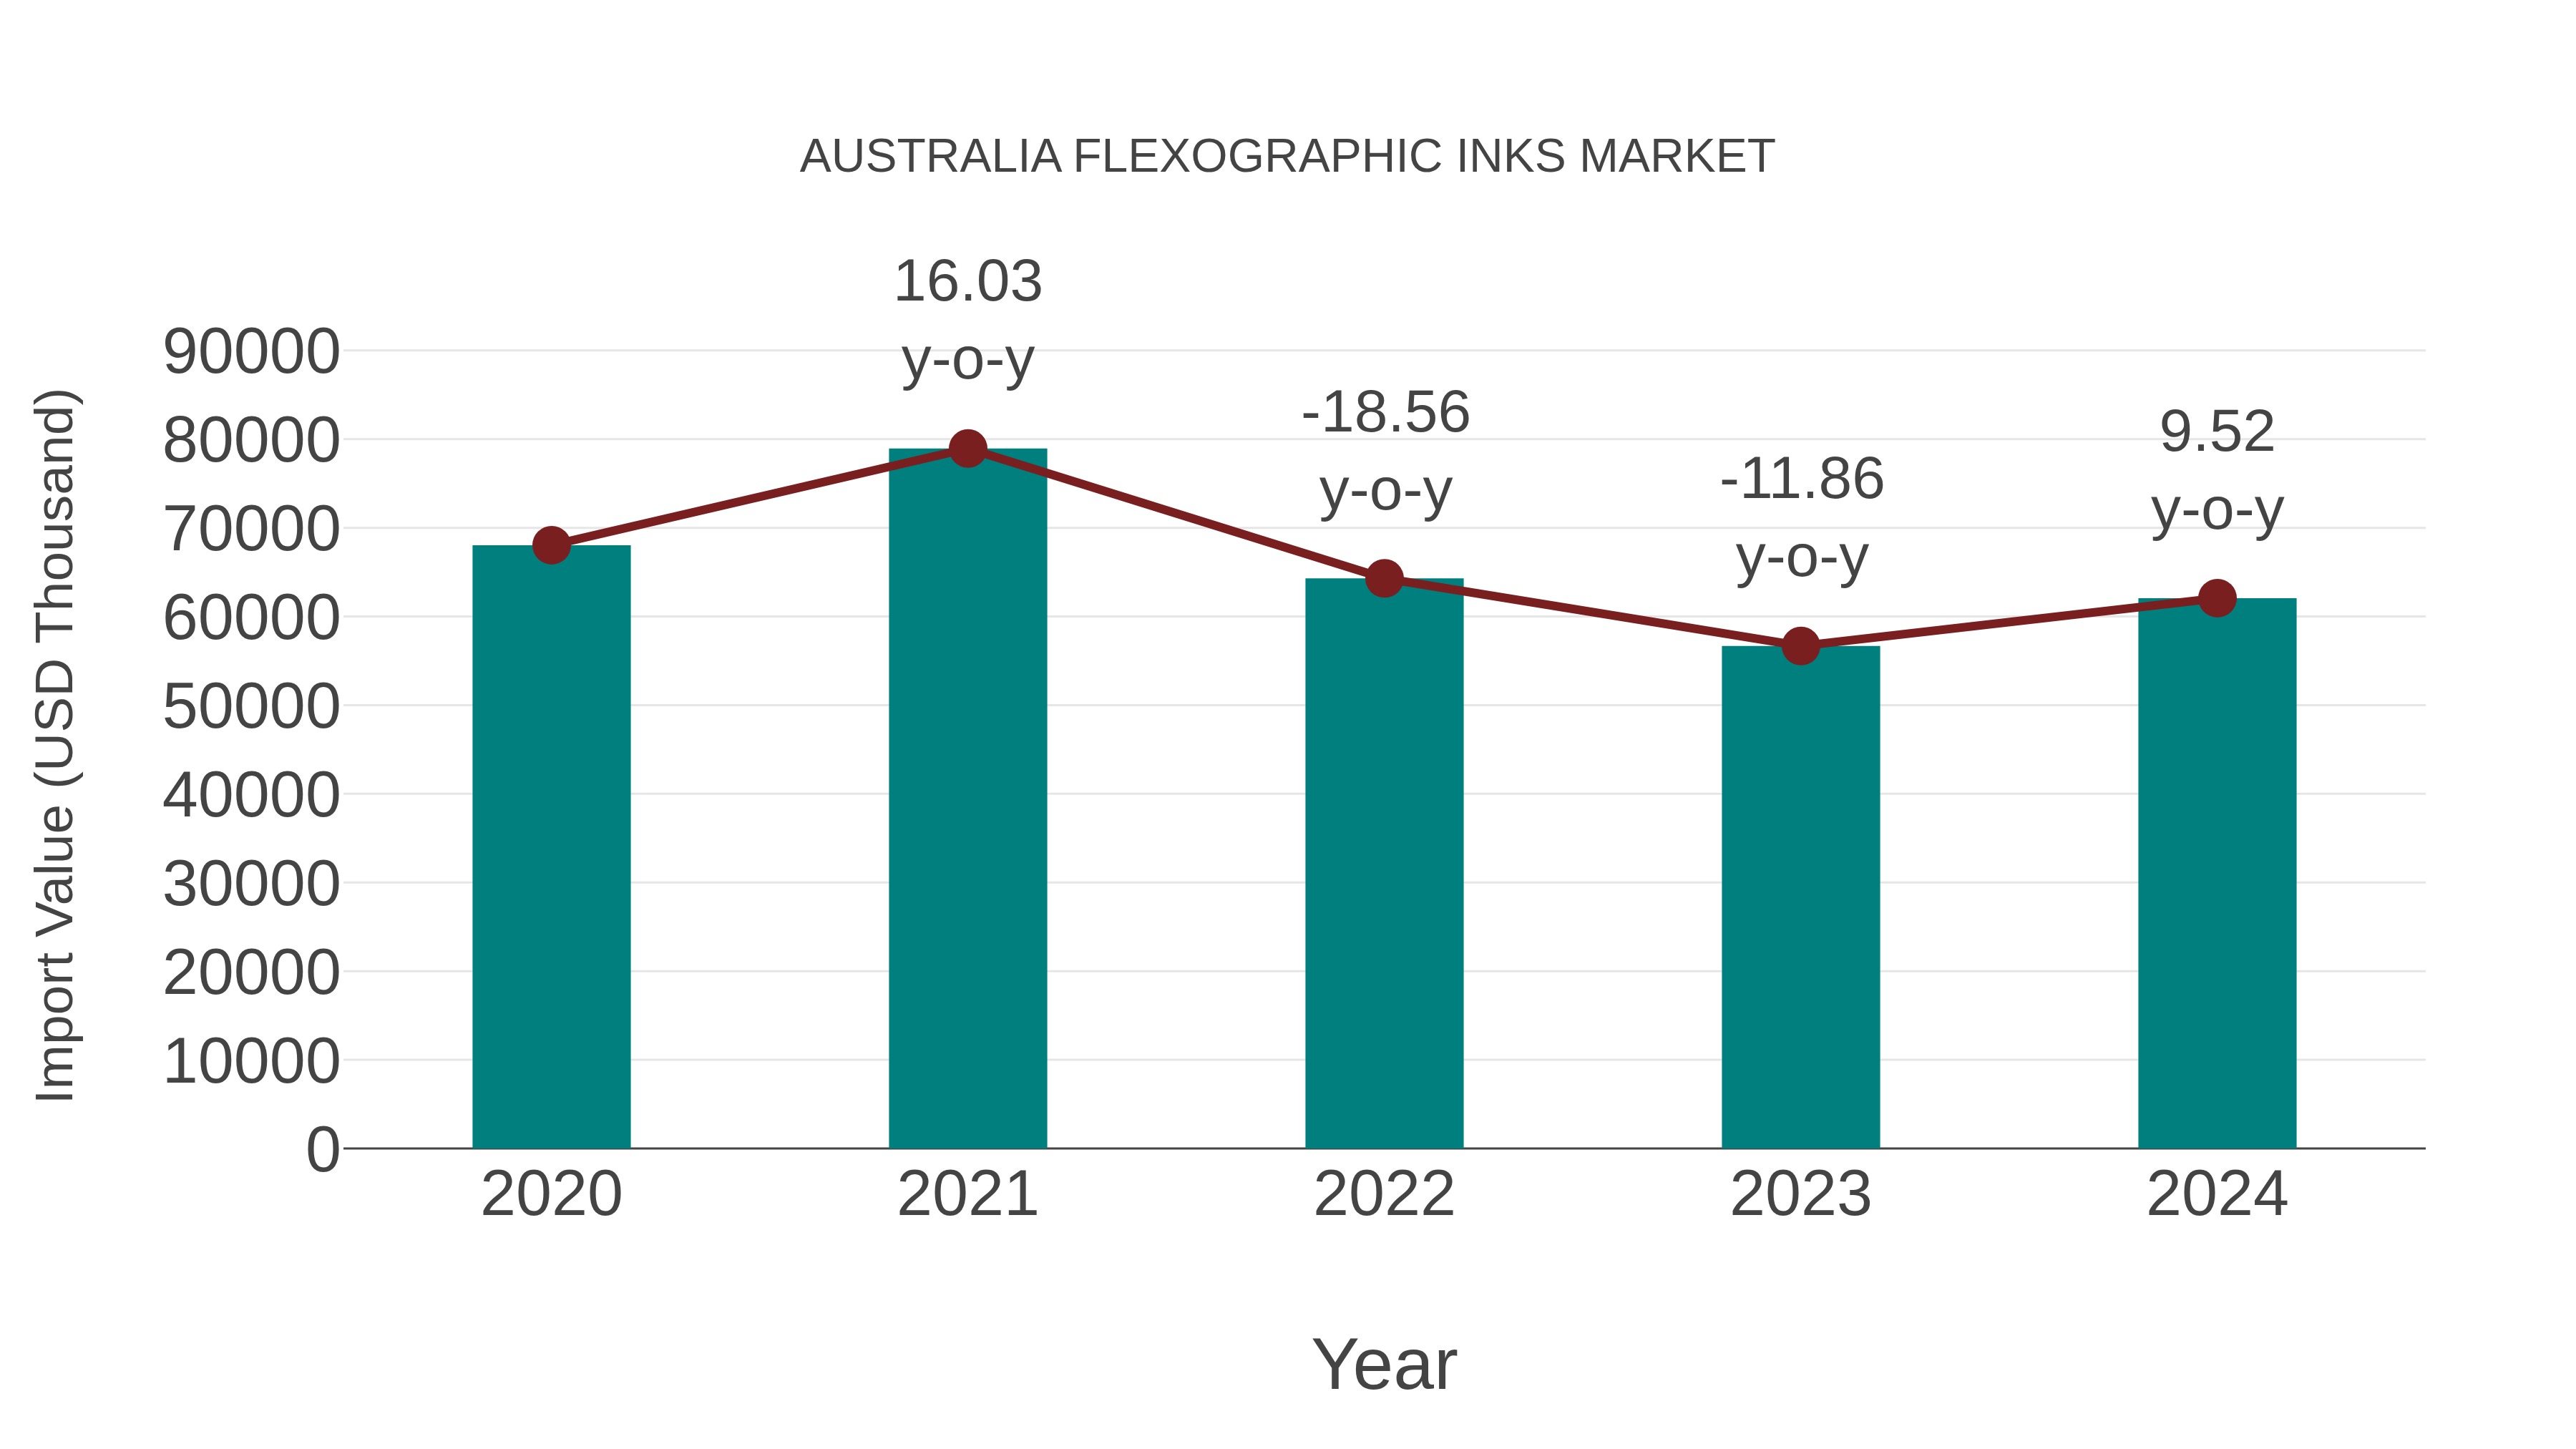
Australia Flexographic Inks Market: Import Trend Analysis
Australia`s import trend for flexographic inks in 2024 showed a growth rate of 9.52%, contrasting with a CAGR of -2.27% for the period 2020-2023. This growth could be attributed to an increased demand for specialized printing inks, potentially driven by advancements in packaging technologies or a shift towards sustainable printing solutions within the market.
Australia Flexographic Inks Market Overview
The flexographic inks market in Australia serves a range of industries including packaging, labeling, and publishing. These inks are valued for their fast drying times, versatility, and ability to print on various substrates including plastics, paper, and foil. Environmental regulations promoting low VOC (volatile organic compounds) emissions and the shift towards water-based and UV-curable inks are shaping market developments. Growth in flexible packaging drives ink consumption in the region.
Trends of the market
The flexographic inks market in Australia is undergoing transformation driven by the demand for eco-friendly and high-performance inks compatible with flexible packaging substrates. There is a marked shift towards water-based and UV-curable inks to reduce volatile organic compound (VOC) emissions and comply with environmental regulations. Innovations aim to improve print quality, drying times, and adhesion on various materials such as plastics and paper. The growing packaging industry, particularly flexible and sustainable packaging, is fueling demand for advanced flexographic inks. Additionally, digital printing integration with flexography is emerging as a hybrid solution to enhance customization and reduce waste.
Challenges of the market
The flexographic inks market in Australia struggles with the demand for environmentally friendly, low-VOC (volatile organic compounds) inks that comply with stringent environmental regulations. Balancing performance with sustainability is difficult, as eco-friendly inks may not always meet durability or print quality expectations. Raw material price volatility affects ink formulation costs. Moreover, technological advancements require continuous innovation, while manufacturers face competition from digital and other printing technologies, impacting market growth.
Investment opportunities in the Market
Investment opportunities in Australias flexographic inks market arise from rising demand for sustainable and eco-friendly inks in packaging and labeling. The market is shifting towards water-based, UV-curable, and biodegradable inks that meet stringent environmental regulations. Companies innovating in low-VOC and high-performance inks for flexible packaging stand to gain market share amid growing awareness around sustainability.
Government Policy of the market
In the flexographic inks market, Australian environmental regulations play a significant role. Policies restricting volatile organic compounds (VOCs) and hazardous substances in inks push manufacturers to develop safer, eco-friendly formulations. Compliance with waste management and chemical handling regulations also affects production processes and market offerings.
Key Highlights of the Report:
- Australia Flexographic Inks Market Outlook
- Market Size of Australia Flexographic Inks Market, 2025
- Forecast of Australia Flexographic Inks Market, 2032
- Historical Data and Forecast of Australia Flexographic Inks Revenues & Volume for the Period 2022 - 2032F
- Australia Flexographic Inks Market Trend Evolution
- Australia Flexographic Inks Market Drivers and Challenges
- Australia Flexographic Inks Price Trends
- Australia Flexographic Inks Porter's Five Forces
- Australia Flexographic Inks Industry Life Cycle
- Historical Data and Forecast of Australia Flexographic Inks Market Revenues & Volume By Type for the Period 2022 - 2032F
- Historical Data and Forecast of Australia Flexographic Inks Market Revenues & Volume By Water-based for the Period 2022 - 2032F
- Historical Data and Forecast of Australia Flexographic Inks Market Revenues & Volume By Solvent-based for the Period 2022 - 2032F
- Historical Data and Forecast of Australia Flexographic Inks Market Revenues & Volume By UV-cured for the Period 2022 - 2032F
- Historical Data and Forecast of Australia Flexographic Inks Market Revenues & Volume By Application for the Period 2022 - 2032F
- Historical Data and Forecast of Australia Flexographic Inks Market Revenues & Volume By Packaging for the Period 2022 - 2032F
- Historical Data and Forecast of Australia Flexographic Inks Market Revenues & Volume By Others for the Period 2022 - 2032F
- Historical Data and Forecast of Australia Flexographic Inks Market Revenues & Volume By Resin for the Period 2022 - 2032F
- Historical Data and Forecast of Australia Flexographic Inks Market Revenues & Volume By Nitrocellulose for the Period 2022 - 2032F
- Historical Data and Forecast of Australia Flexographic Inks Market Revenues & Volume By Polyamide for the Period 2022 - 2032F
- Historical Data and Forecast of Australia Flexographic Inks Market Revenues & Volume By Polyurethane for the Period 2022 - 2032F
- Historical Data and Forecast of Australia Flexographic Inks Market Revenues & Volume By Acrylic for the Period 2022 - 2032F
- Australia Flexographic Inks Import Export Trade Statistics
- Market Opportunity Assessment By Type
- Market Opportunity Assessment By Application
- Market Opportunity Assessment By Resin
- Australia Flexographic Inks Top Companies Market Share
- Australia Flexographic Inks Competitive Benchmarking By Technical and Operational Parameters
- Australia Flexographic Inks Company Profiles
- Australia Flexographic Inks Key Strategic Recommendations
Australia Flexographic Inks Market (2026-2032): FAQs
6Wresearch actively monitors the Australia Flexographic Inks Market and publishes its comprehensive annual report, highlighting emerging trends, growth drivers, revenue analysis, and forecast outlook. Our insights help businesses to make data-backed strategic decisions with ongoing market dynamics. Our analysts track relevent industries related to the Australia Flexographic Inks Market, allowing our clients with actionable intelligence and reliable forecasts tailored to emerging regional needs.
Yes, we provide customisation as per your requirements. To learn more, feel free to contact us on sales@6wresearch.com
1 Executive Summary |
2 Introduction |
2.1 Key Highlights of the Report |
2.2 Report Description |
2.3 Market Scope & Segmentation |
2.4 Research Methodology |
2.5 Assumptions |
3 Australia Flexographic Inks Market Overview |
3.1 Australia Country Macro Economic Indicators |
3.2 Australia Flexographic Inks Market Revenues & Volume, 2022 & 2032F |
3.3 Australia Flexographic Inks Market - Industry Life Cycle |
3.4 Australia Flexographic Inks Market - Porter's Five Forces |
3.5 Australia Flexographic Inks Market Revenues & Volume Share, By Type, 2022 & 2032F |
3.6 Australia Flexographic Inks Market Revenues & Volume Share, By Application, 2022 & 2032F |
3.7 Australia Flexographic Inks Market Revenues & Volume Share, By Resin, 2022 & 2032F |
4 Australia Flexographic Inks Market Dynamics |
4.1 Impact Analysis |
4.2 Market Drivers |
4.2.1 Growing demand for sustainable and eco-friendly packaging solutions |
4.2.2 Increasing adoption of flexographic printing technology in packaging industry |
4.2.3 Rising investments in the food and beverage sector in Australia |
4.3 Market Restraints |
4.3.1 Fluctuating raw material prices |
4.3.2 Intense competition from digital printing technologies |
4.3.3 Stringent environmental regulations impacting ink formulations |
5 Australia Flexographic Inks Market Trends |
6 Australia Flexographic Inks Market, By Types |
6.1 Australia Flexographic Inks Market, By Type |
6.1.1 Overview and Analysis |
6.1.2 Australia Flexographic Inks Market Revenues & Volume, By Type, 2022 - 2032F |
6.1.3 Australia Flexographic Inks Market Revenues & Volume, By Water-based, 2022 - 2032F |
6.1.4 Australia Flexographic Inks Market Revenues & Volume, By Solvent-based, 2022 - 2032F |
6.1.5 Australia Flexographic Inks Market Revenues & Volume, By UV-cured, 2022 - 2032F |
6.2 Australia Flexographic Inks Market, By Application |
6.2.1 Overview and Analysis |
6.2.2 Australia Flexographic Inks Market Revenues & Volume, By Packaging, 2022 - 2032F |
6.2.3 Australia Flexographic Inks Market Revenues & Volume, By Others, 2022 - 2032F |
6.3 Australia Flexographic Inks Market, By Resin |
6.3.1 Overview and Analysis |
6.3.2 Australia Flexographic Inks Market Revenues & Volume, By Nitrocellulose, 2022 - 2032F |
6.3.3 Australia Flexographic Inks Market Revenues & Volume, By Polyamide, 2022 - 2032F |
6.3.4 Australia Flexographic Inks Market Revenues & Volume, By Polyurethane, 2022 - 2032F |
6.3.5 Australia Flexographic Inks Market Revenues & Volume, By Acrylic, 2022 - 2032F |
7 Australia Flexographic Inks Market Import-Export Trade Statistics |
7.1 Australia Flexographic Inks Market Export to Major Countries |
7.2 Australia Flexographic Inks Market Imports from Major Countries |
8 Australia Flexographic Inks Market Key Performance Indicators |
8.1 Adoption rate of water-based and UV-curable flexographic inks |
8.2 Percentage of packaging companies using flexographic printing technology |
8.3 Investment in research and development for developing innovative flexographic ink formulations |
8.4 Number of new product launches in the flexographic inks market |
8.5 Growth in demand for flexographic inks in key end-use industries such as food and beverage, pharmaceuticals, and cosmetics |
9 Australia Flexographic Inks Market - Opportunity Assessment |
9.1 Australia Flexographic Inks Market Opportunity Assessment, By Type, 2022 & 2032F |
9.2 Australia Flexographic Inks Market Opportunity Assessment, By Application, 2022 & 2032F |
9.3 Australia Flexographic Inks Market Opportunity Assessment, By Resin, 2022 & 2032F |
10 Australia Flexographic Inks Market - Competitive Landscape |
10.1 Australia Flexographic Inks Market Revenue Share, By Companies, 2025 |
10.2 Australia Flexographic Inks Market Competitive Benchmarking, By Operating and Technical Parameters |
11 Company Profiles |
12 Recommendations |
13 Disclaimer |
Export potential assessment - trade Analytics for 2030
Export potential enables firms to identify high-growth global markets with greater confidence by combining advanced trade intelligence with a structured quantitative methodology. The framework analyzes emerging demand trends and country-level import patterns while integrating macroeconomic and trade datasets such as GDP and population forecasts, bilateral import–export flows, tariff structures, elasticity differentials between developed and developing economies, geographic distance, and import demand projections. Using weighted trade values from 2020–2024 as the base period to project country-to-country export potential for 2030, these inputs are operationalized through calculated drivers such as gravity model parameters, tariff impact factors, and projected GDP per-capita growth. Through an analysis of hidden potentials, demand hotspots, and market conditions that are most favorable to success, this method enables firms to focus on target countries, maximize returns, and global expansion with data, backed by accuracy.
By factoring in the projected importer demand gap that is currently unmet and could be potential opportunity, it identifies the potential for the Exporter (Country) among 190 countries, against the general trade analysis, which identifies the biggest importer or exporter.
To discover high-growth global markets and optimize your business strategy:
Click Here
Pricing
- Single User License$ 1,995
- Department License$ 2,400
- Site License$ 3,120
- Global License$ 3,795

Search
Thought Leadership and Analyst Meet


Our Clients
Latest Reports
- France Thermally Conductive Filler Dispersants Market (2026-2032) | Challenges, Restraints, Value, Share, Size, segmentation, Analysis, Trends, Investment Opportunities, Outlook, Pricing, Demand, Forecast, Revenue, Companies, Growth, Drivers, Strategy, Insights, Competition
- Egypt Thermally Conductive Filler Dispersants Market (2026-2032) | Competition, Forecast, Strategy, Value, Insights, Outlook, Investment Opportunities, Pricing, Demand, Share, segmentation, Drivers, Size, Companies, Restraints, Growth, Trends, Revenue, Challenges, Analysis
- Czech Republic Thermally Conductive Filler Dispersants Market (2026-2032) | Forecast, Pricing, Analysis, Drivers, Insights, Size, Demand, Growth, Challenges, segmentation, Competition, Outlook, Trends, Investment Opportunities, Companies, Strategy, Revenue, Share, Value, Restraints
- Colombia Thermally Conductive Filler Dispersants Market (2026-2032) | segmentation, Trends, Share, Drivers, Strategy, Companies, Demand, Insights, Size, Challenges, Value, Competition, Analysis, Growth, Revenue, Restraints, Forecast, Pricing, Outlook, Investment Opportunities
- China Thermally Conductive Filler Dispersants Market (2026-2032) | Restraints, Investment Opportunities, Pricing, Companies, Share, Size, Challenges, Trends, Outlook, Value, Analysis, Competition, Revenue, Drivers, Forecast, Demand, Insights, Growth, Strategy, segmentation
- Chile Thermally Conductive Filler Dispersants Market (2026-2032) | Investment Opportunities, Trends, Value, Restraints, Share, Companies, Forecast, segmentation, Pricing, Challenges, Demand, Size, Analysis, Drivers, Outlook, Growth, Competition, Strategy, Revenue, Insights
- Cambodia Thermally Conductive Filler Dispersants Market (2026-2032) | Analysis, Share, Outlook, Strategy, Pricing, Demand, Size, Growth, segmentation, Insights, Revenue, Forecast, Challenges, Competition, Companies, Investment Opportunities, Trends, Restraints, Value, Drivers
- Brazil Thermally Conductive Filler Dispersants Market (2026-2032) | Restraints, Forecast, Competition, Size, Revenue, Value, Investment Opportunities, Trends, Insights, Outlook, Growth, Analysis, Drivers, segmentation, Pricing, Challenges, Strategy, Share, Companies, Demand
- Bangladesh Thermally Conductive Filler Dispersants Market (2026-2032) | Restraints, Trends, Analysis, Competition, Insights, Forecast, Value, Investment Opportunities, Pricing, Share, Demand, Outlook, Revenue, segmentation, Companies, Drivers, Growth, Size, Challenges, Strategy
- Bahrain Thermally Conductive Filler Dispersants Market (2026-2032) | Trends, Outlook, Pricing, Demand, Value, Competition, Forecast, Growth, segmentation, Revenue, Companies, Analysis, Insights, Size, Drivers, Challenges, Strategy, Investment Opportunities, Share, Restraints
Industry Events and Analyst Meet

HIMTEX 2026

India Refining Summit 2026

India EV Show 2026

EV tech India Expo 2026

Auto Tech Asia 2026
Whitepaper
- Middle East & Africa Commercial Security Market Click here to view more.
- Middle East & Africa Fire Safety Systems & Equipment Market Click here to view more.
- GCC Drone Market Click here to view more.
- Middle East Lighting Fixture Market Click here to view more.
- GCC Physical & Perimeter Security Market Click here to view more.
6WResearch In News
- Doha a strategic location for EV manufacturing hub: IPA Qatar
- Demand for luxury TVs surging in the GCC, says Samsung
- Empowering Growth: The Thriving Journey of Bangladesh’s Cable Industry
- Demand for luxury TVs surging in the GCC, says Samsung
- Video call with a traditional healer? Once unthinkable, it’s now common in South Africa
- Intelligent Buildings To Smooth GCC’s Path To Net Zero