Australia LNG Market (2026-2032) | Companies, Industry, Forecast, Size & Revenue, Share, Growth, Competitive Landscape, Trends, Analysis, Outlook, Segmentation, Value
Market Forecast By LNG Infrastructure (LNG Liquefaction Plants, LNG Regasification Facilities, LNG Shipping), By Application (Transportation Fuel, Power Generation, Other Applications) And Competitive Landscape
| Product Code: ETC6183615 | Publication Date: Sep 2024 | Updated Date: Mar 2026 | Product Type: Market Research Report | |
| Publisher: 6Wresearch | Author: Shubham Padhi | No. of Pages: 75 | No. of Figures: 35 | No. of Tables: 20 |
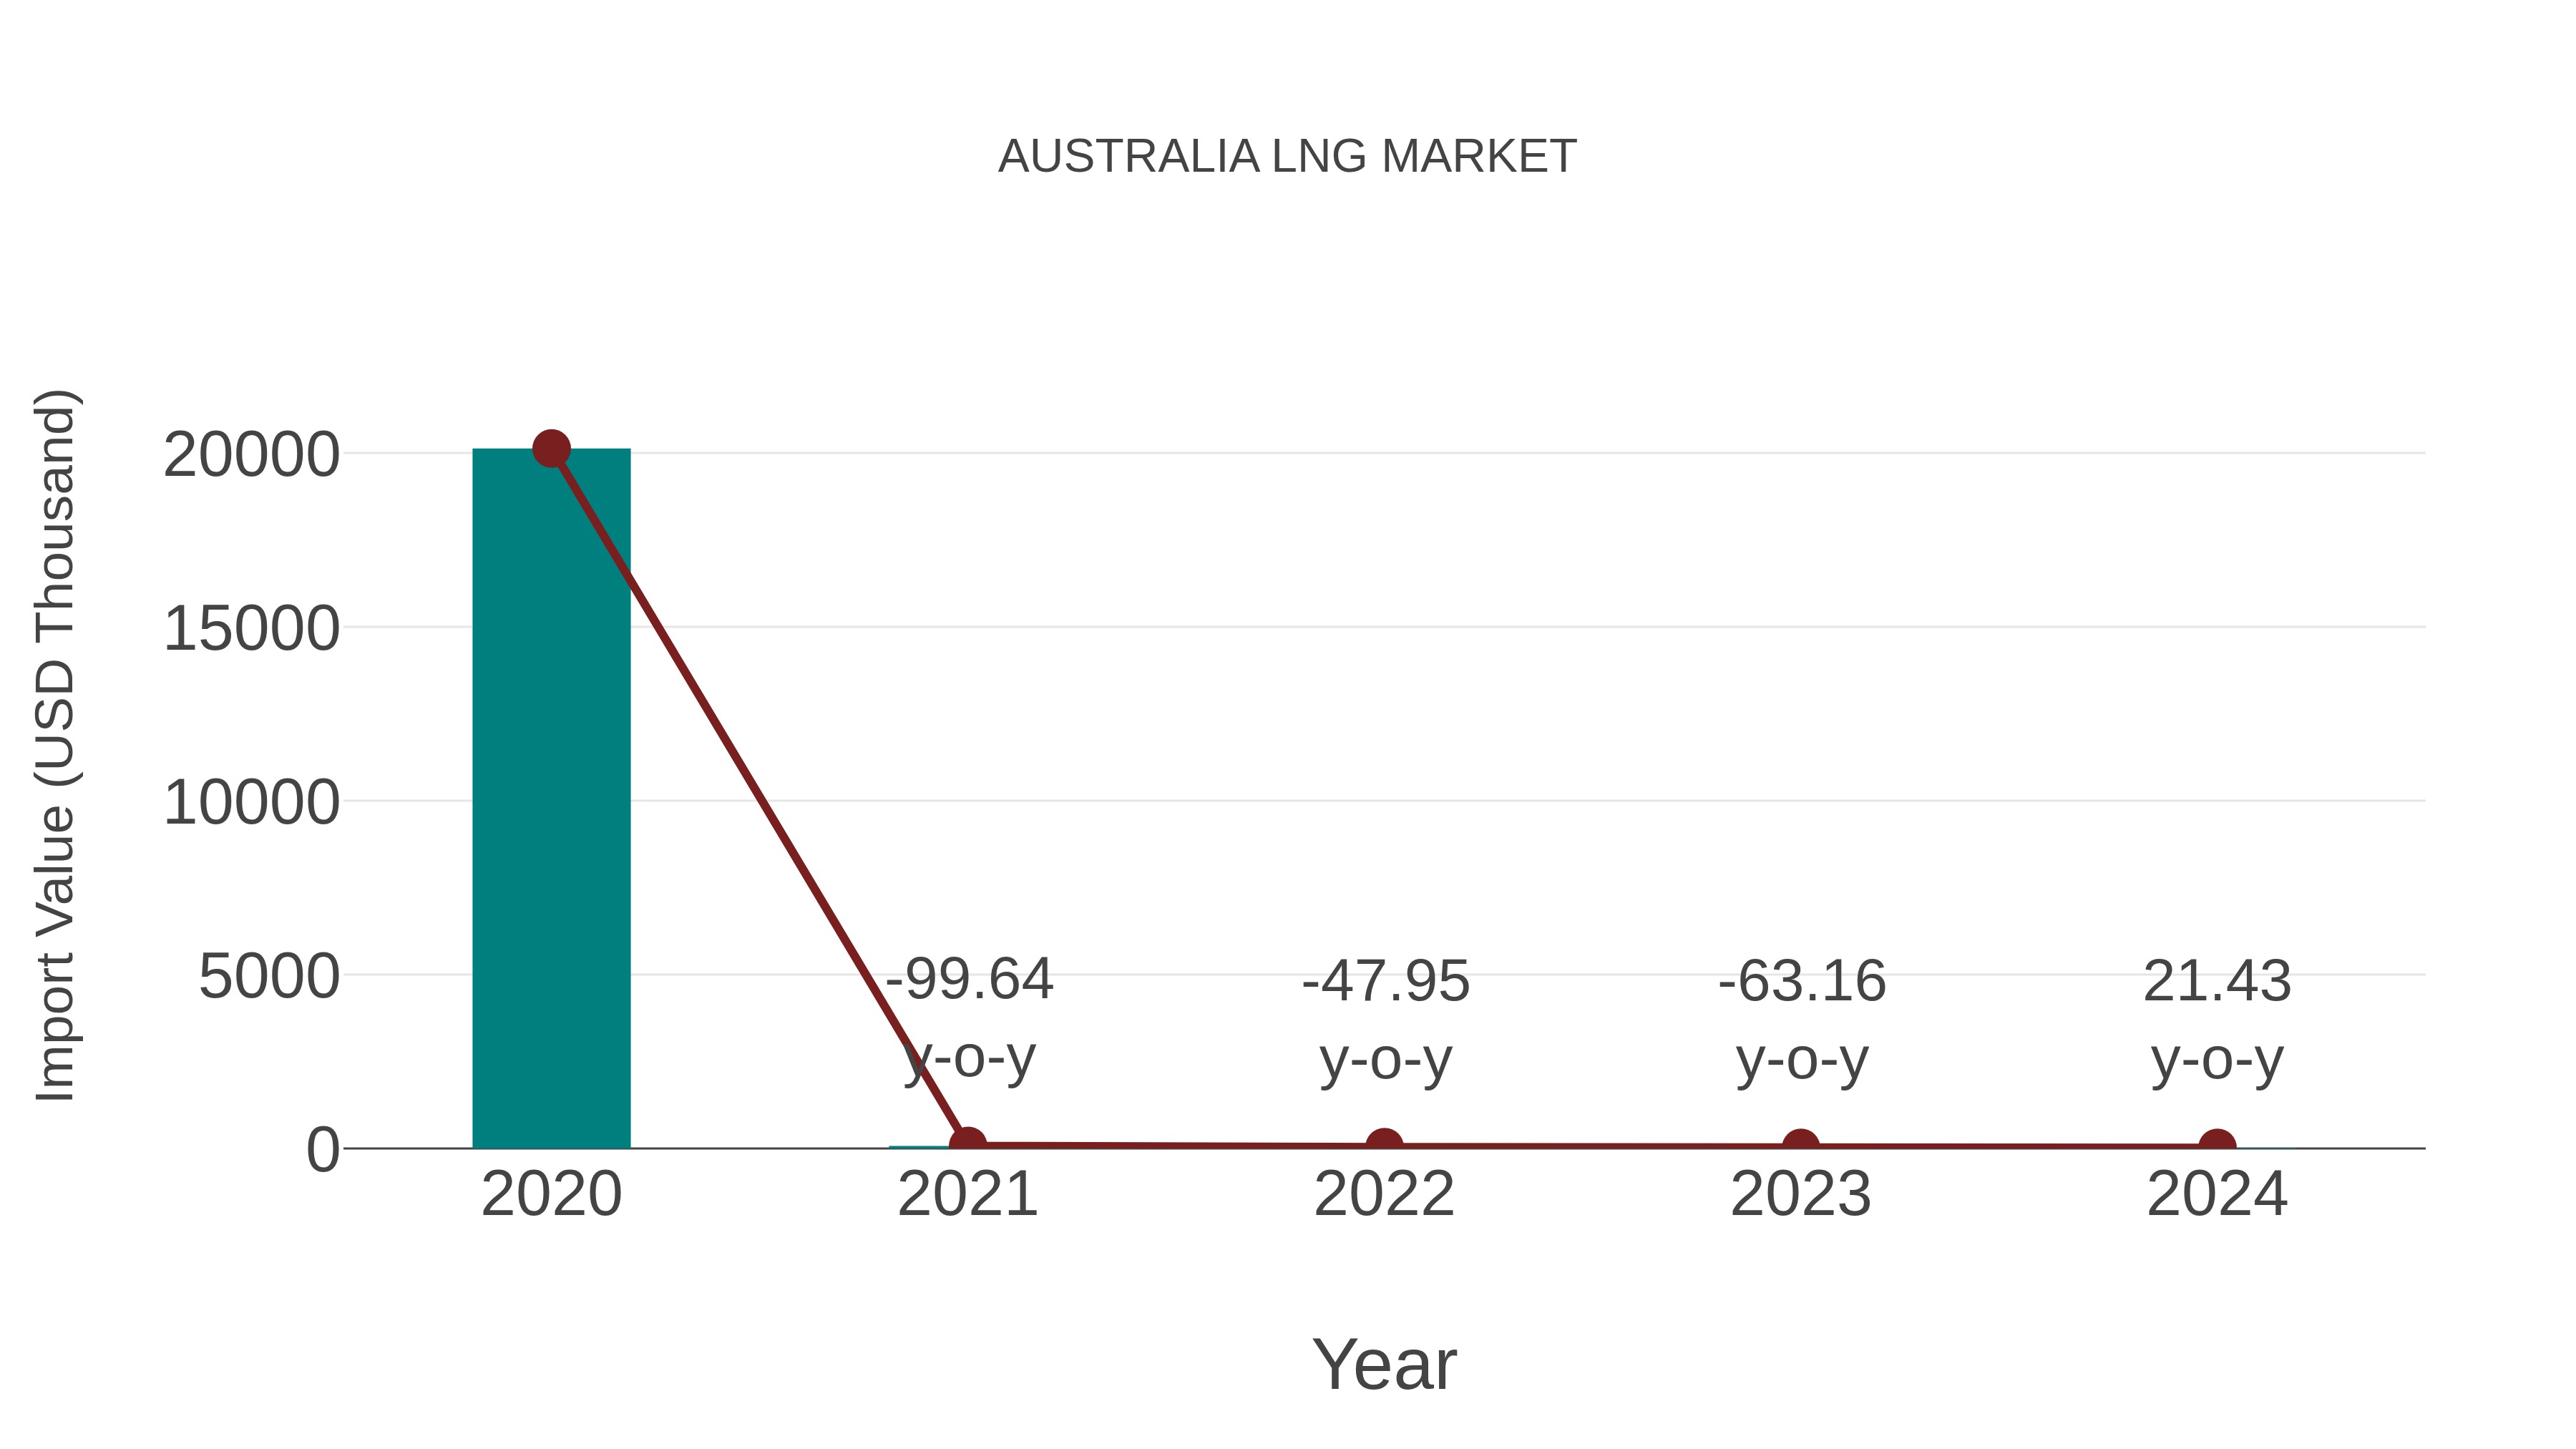
Australia Lng Market: Import Trend Analysis
The Australia LNG market witnessed a negative Compound Annual Growth Rate (CAGR) of -82.95% from 2020 to 2024. However, there was a notable year-on-year growth rate of 21.43% observed in 2023-2024, indicating a surge in imports during that period.
Australia LNG Market Growth Rate
According to 6Wresearch internal database and industry insights, the Australia LNG Market is projected to register a compound annual growth rate (CAGR) of 13.2% during the forecast period (2026–2032).
Five-Year Growth Trajectory of the Australia LNG Market with Core Drivers
Below mentioned are the evaluation of year-wise growth rate along with key drivers:
| Years | Estimated Annual Growth (%) | Growth Drivers |
| 2021 | 3.5% | Continued operation of existing nuclear reactors and grid stability needs |
| 2022 | 3.9% | Government focus on long-term energy diversification |
| 2023 | 420.00% | Investments toward completion and life-extension of nuclear facilities |
| 2024 | 4.4% | Rising electricity demand from industrial and urban sectors |
| 2025 | 4.6% | Policy support for low-carbon baseload power generation |
Topics Covered in the Australia LNG Market Report
The Australia LNG Market report thoroughly covers the market by LNG infrastructure, and application. The report provides an unbiased and detailed analysis of ongoing market trends, opportunities, high-growth areas, and market drivers, which would help stakeholders devise and align their strategies according to the current and future market dynamics.
Australia LNG Market Highlights
| Report Name | Australia LNG Market |
| Forecast Period | 2026–2032 |
| CAGR | 13.2% |
| Growing Sector | Energy & Utilities |
Australia LNG Market Synopsis
In Australia, the liquefied natural gas (LNG) market is rapidly expanding due to the increasing number of newly built liquefaction facilities, strengthened export agreements with developing Asian countries, and supportive government policies for both domestic and international use. As a result, Australia is one of the world's largest producers of LNG with numerous new liquidification facilities and an extensive distribution network that allows it to deliver to all major worldwide markets.
Evaluation of Growth Drivers in the Australia LNG Market
Below mentioned are some growth drivers and their impact on market dynamics:
| Drivers | Primary Segments Affected | Why It Matters |
| Rising Global LNG Demand | Export & Infrastructure | Strong demand from Asia increases export volumes and revenue potential. |
| Expansion of Liquefaction Capacity | LNG Infrastructure | Upgraded and additional facilities boost output efficiency and increase export potential. |
| Strategic Supply Agreements | LNG Shipping & Contracts | Contracts with key Asian partners guarantee consistent LNG export opportunities. |
| Technological Advancements | All Segments | Upgraded liquefaction facilities and floating LNG technology elevate efficiency and throughput. |
| Government Policies & Incentives | Infrastructure & Trade | Measures including export support and gas reservation policies encourage investment and maintain domestic availability. |
The Australia LNG Market is projected to grow at a CAGR of 13.2% during the forecast period (2026–2032). The growth of the Australia LNG Market is driven by rising global demand for LNG, substantial investments in liquefaction infrastructure, and the establishment of strategic export contracts with key international partners. The continuous integration of advanced technologies ensures efficient production and dependable shipping. Rising utilization of LNG in electricity generation and transport supports wider market growth. Combined, these trends increase application adoption, strengthen exports, and reinforce Australia position in the global LNG market.
Evaluation of Restraints in the Australia LNG Market
Below mentioned are some major restraints and their influence on market dynamics:
| Restraints | Primary Segments Affected | What This Means |
| High Capital Expenditure | All Infrastructure | Large upfront costs limit the entry of new players and slow project expansion. |
| Export Volume Fluctuations | LNG Exports | LNG Exports Variability in global demand can affect revenue and infrastructure utilization. |
| Regulatory Uncertainty | All Sectors | Modifications in policies, like gas reservation requirements, may alter export dynamics and affect investor trust. |
| Domestic Supply Constraints | Domestic Market | Emphasis on LNG exports puts pressure on local supply, necessitating improvements in pipeline and infrastructure networks. |
Australia LNG Market Challenges
The Australia LNG Industry faces several challenges that may impact its growth. High initial investments in liquefaction plants and shipping infrastructure act as financial constraints. Policy uncertainties, including gas reservation requirements, may impact export levels and operations. Additionally, incorporating advanced technologies, particularly for floating LNG, and handling large-scale logistical operations add further difficulties. Tackling these challenges is essential to sustain growth, improve competitiveness, and secure long-term stability in Australia LNG sector.
Australia LNG Market Trends
Some major trends contributing to the development of the Australia LNG Market Growth are:
- Expansion of Small-Scale LNG Infrastructure: Newly built small-scale LNG facilities are supplying regional and remote areas, supporting industrial and transport applications.
- Marine LNG Bunkering Growth: Stricter vessel emission rules are promoting LNG use in shipping, encouraging investment in bunkering infrastructure.
- Low-Carbon LNG Initiatives: The uptake of low-emission LNG technologies and carbon capture solutions is increasing, creating opportunities for sustainable export expansion.
- Strategic Export Agreements: Extended supply contracts with Asian countries secure market stability and encourage additional infrastructure investment.
Investment Opportunities in the Australia LNG Market
Here are some investment opportunities in the Australia LNG Market:
- Liquefaction and Shipping Expansion: Investments in expanding liquefaction plants and shipping networks can increase production capacity and export reliability.
- Small-Scale LNG Projects: Growth in domestic and industrial applications is driven by small-scale LNG facilities and expanded regional distribution.
- Low-Emission LNG Production: The use of renewable LNG and carbon-reducing solutions provides avenues for green investment and alignment with emission reduction targets.
- Marine and Transportation Fuel Applications: Growing LNG use in shipping and heavy-duty transport fuels presents new market segments and revenue opportunities.
Top 5 Leading Players in the Australia LNG Market
Here are some top companies contributing to the Australia LNG Market Share:
1. Woodside Energy Group Ltd
| Company Name | Woodside Energy Group Ltd |
| Established Year | 1954 |
| Headquarters | Perth, Australia |
| Official Website | - |
Description: Woodside is a leading LNG producer with extensive offshore gas assets and liquefaction operations, focusing on sustainable energy solutions and export partnerships across Asia.
2. Chevron Australia
| Company Name | Chevron Australia |
| Established Year | 1936 |
| Headquarters | Perth, Australia |
| Official Website | - |
Description: Chevron operates major LNG projects, including Gorgon and Wheatstone, supporting high export capacity and energy security while expanding infrastructure capabilities.
3. Santos Ltd
| Company Name | Adelaide, Australia |
| Established Year | 1954 |
| Headquarters | Santos Ltd |
| Official Website | - |
Description: Santos manages LNG projects such as Barossa and PNG LNG, supplying regional and global markets and entering mid-term supply agreements with key partners.
4. APLNG (Australia Pacific LNG)
| Company Name | APLNG (Australia Pacific LNG) |
| Established Year | 2009 |
| Headquarters | Brisbane, Australia |
| Official Website | - |
Description: APLNG contributes to Australia’s LNG exports and domestic supply networks, supporting integrated upstream production and downstream delivery.
5. GLNG (Gladstone LNG)
| Company Name | GLNG (Gladstone LNG) |
| Established Year | 2010 |
| Headquarters | Queensland, Australia |
| Official Website | - |
Description: GLNG is a major liquefaction facility supplying international markets, integrating upstream gas production for efficiency and reliability.
Government Initiatives Introduced in the Australia LNG Market
According to Australian Government data, Australia Future Gas Strategy promotes consistent LNG exports while supporting low-carbon LNG certification and initiatives to reduce emissions. Major investments in pipelines and domestic infrastructure are improving regional connectivity, ensuring dependable supply for industrial and transportation sectors. These initiatives boost LNG operational efficiency, extend market coverage, enhance logistics, and maintain a stable energy supply.
Future Insights of the Australia LNG Market
Australia will continue developing its LNG market due to many factors, including ongoing development of infrastructure, export agreements/strategies, government support, and increasing use of low carbon technologies. LNG is also being used more often in electricity generation, transportation, small-scale and marine applications, which will promote further growth into those markets. Improvements related to the efficiency of liquefaction and shipping will also enhance operational reliability thereby keeping Australia at the forefront of global LNG exporting and fostering sustainable energy practices while creating long-term growth opportunities in Australia LNG industry.
Market Segmentation Analysis
The report offers a comprehensive study of the following market segments and their leading categories:
Liquefaction Plants to Dominate the Market – By LNG Infrastructure
According to Ritika Kalra, Senior Research Analyst, 6Wresearch, Liquefaction plants dominate due to Australia position as a major LNG exporter. Large onshore facilities such as North West Shelf, Gorgon, Wheatstone, and GLNG provide high production capacity and stable supply to international markets.
Power Generation to Dominate the Market – By Application
Power generation dominates application-wise due to the extensive use of LNG in electricity and industrial energy systems. Transportation fuel is the fastest-growing segment, driven by LNG fueling stations for heavy-duty vehicles and marine applications.
Key Attractiveness of the Report
- 10 Years of Market Numbers
- Historical Data from 2022 to 2025
- Base Year: 2025
- Forecast Data until 2032
- Key Performance Indicators Impacting the Market
- Major Upcoming Developments and Projects
Key Highlights of the Report:
- Australia LNG Market Outlook
- Market Size of Australia LNG Market, 2025
- Forecast of Australia LNG Market, 2032
- Historical Data and Forecast of Australia LNG Revenues & Volume for the Period 2022 - 2032F
- Australia LNG Market Trend Evolution
- Australia LNG Market Drivers and Challenges
- Australia LNG Price Trends
- Australia LNG Porter's Five Forces
- Australia LNG Industry Life Cycle
- Historical Data and Forecast of Australia LNG Market Revenues & Volume By LNG Infrastructure for the Period 2022 - 2032F
- Historical Data and Forecast of Australia LNG Market Revenues & Volume By LNG Liquefaction Plants for the Period 2022 - 2032F
- Historical Data and Forecast of Australia LNG Market Revenues & Volume By LNG Regasification Facilities for the Period 2022 - 2032F
- Historical Data and Forecast of Australia LNG Market Revenues & Volume By LNG Shipping for the Period 2022 - 2032F
- Historical Data and Forecast of Australia LNG Market Revenues & Volume By Application for the Period 2022 - 2032F
- Historical Data and Forecast of Australia LNG Market Revenues & Volume By Transportation Fuel for the Period 2022 - 2032F
- Historical Data and Forecast of Australia LNG Market Revenues & Volume By Power Generation for the Period 2022 - 2032F
- Historical Data and Forecast of Australia LNG Market Revenues & Volume By Other Applications for the Period 2022 - 2032F
- Australia LNG Import Export Trade Statistics
- Market Opportunity Assessment By LNG Infrastructure
- Market Opportunity Assessment By Application
- Australia LNG Top Companies Market Share
- Australia LNG Competitive Benchmarking By Technical and Operational Parameters
- Australia LNG Company Profiles
- Australia LNG Key Strategic Recommendations
Market Covered
The report offers a comprehensive study of the subsequent market segments:
By Treatment
- Supportive Therapy
- Antiviral Therapy
By Route of Administration
- Oral
- Parenteral
- Others
By End-Users
- Clinics
- Hospitals
- Others
By Distribution Channel
- Hospital Pharmacy
- Retail Pharmacy
- Online Pharmacy
- Others
Australia LNG Market (2026-2032): FAQs
The Australia LNG Market is projected to grow at a CAGR of 13.2% during 2026–2032.
LNG liquefaction plants dominate due to high production capacity and export volumes.
The industry is challenged by substantial investment costs, unpredictable export volumes, policy uncertainties, and restrictions on domestic gas supply.
Initiatives such as the Future Gas Strategy and gas reservation schemes in Queensland promote reliable domestic supply and encourage steady growth in LNG exports.
6Wresearch actively monitors the Australia LNG Market and publishes its comprehensive annual report, highlighting emerging trends, growth drivers, revenue analysis, and forecast outlook. Our insights help businesses to make data-backed strategic decisions with ongoing market dynamics. Our analysts track relevent industries related to the Australia LNG Market, allowing our clients with actionable intelligence and reliable forecasts tailored to emerging regional needs.
Yes, we provide customisation as per your requirements. To learn more, feel free to contact us on sales@6wresearch.com
| 1 Executive Summary |
| 2 Introduction |
| 2.1 Key Highlights of the Report |
| 2.2 Report Description |
| 2.3 Market Scope & Segmentation |
| 2.4 Research Methodology |
| 2.5 Assumptions |
| 3 Australia LNG Market Overview |
| 3.1 Australia Country Macro Economic Indicators |
| 3.2 Australia LNG Market Revenues & Volume, 2022 & 2032F |
| 3.3 Australia LNG Market - Industry Life Cycle |
| 3.4 Australia LNG Market - Porter's Five Forces |
| 3.5 Australia LNG Market Revenues & Volume Share, By LNG Infrastructure, 2022 & 2032F |
| 3.6 Australia LNG Market Revenues & Volume Share, By Application, 2022 & 2032F |
| 4 Australia LNG Market Dynamics |
| 4.1 Impact Analysis |
| 4.2 Market Drivers |
| 4.2.1 Growing demand for cleaner energy sources globally |
| 4.2.2 Increasing investments in natural gas infrastructure |
| 4.2.3 Favorable government regulations and policies supporting LNG production and export |
| 4.3 Market Restraints |
| 4.3.1 Volatility in global energy prices |
| 4.3.2 High upfront capital costs for LNG projects |
| 4.3.3 Competition from other energy sources such as renewables |
| 5 Australia LNG Market Trends |
| 6 Australia LNG Market, By Types |
| 6.1 Australia LNG Market, By LNG Infrastructure |
| 6.1.1 Overview and Analysis |
| 6.1.2 Australia LNG Market Revenues & Volume, By LNG Infrastructure, 2022- 2032F |
| 6.1.3 Australia LNG Market Revenues & Volume, By LNG Liquefaction Plants, 2022- 2032F |
| 6.1.4 Australia LNG Market Revenues & Volume, By LNG Regasification Facilities, 2022- 2032F |
| 6.1.5 Australia LNG Market Revenues & Volume, By LNG Shipping, 2022- 2032F |
| 6.2 Australia LNG Market, By Application |
| 6.2.1 Overview and Analysis |
| 6.2.2 Australia LNG Market Revenues & Volume, By Transportation Fuel, 2022- 2032F |
| 6.2.3 Australia LNG Market Revenues & Volume, By Power Generation, 2022- 2032F |
| 6.2.4 Australia LNG Market Revenues & Volume, By Other Applications, 2022- 2032F |
| 7 Australia LNG Market Import-Export Trade Statistics |
| 7.1 Australia LNG Market Export to Major Countries |
| 7.2 Australia LNG Market Imports from Major Countries |
| 8 Australia LNG Market Key Performance Indicators |
| 8.1 LNG production capacity utilization rate |
| 8.2 LNG export volume to key markets |
| 8.3 Number of new LNG projects sanctioned |
| 8.4 LNG spot prices in major markets |
| 8.5 LNG shipping rates and capacity utilization |
| 9 Australia LNG Market - Opportunity Assessment |
| 9.1 Australia LNG Market Opportunity Assessment, By LNG Infrastructure, 2022 & 2032F |
| 9.2 Australia LNG Market Opportunity Assessment, By Application, 2022 & 2032F |
| 10 Australia LNG Market - Competitive Landscape |
| 10.1 Australia LNG Market Revenue Share, By Companies, 2025 |
| 10.2 Australia LNG Market Competitive Benchmarking, By Operating and Technical Parameters |
| 11 Company Profiles |
| 12 Recommendations |
| 13 Disclaimer |
Global Go To Market Strategy - 2030
Export potential enables firms to identify high-growth global markets with greater confidence by combining advanced trade intelligence with a structured quantitative methodology. The framework analyzes emerging demand trends and country-level import patterns while integrating macroeconomic and trade datasets such as GDP and population forecasts, bilateral import–export flows, tariff structures, elasticity differentials between developed and developing economies, geographic distance, and import demand projections. Using weighted trade values from 2020–2024 as the base period to project country-to-country export potential for 2030, these inputs are operationalized through calculated drivers such as gravity model parameters, tariff impact factors, and projected GDP per-capita growth. Through an analysis of hidden potentials, demand hotspots, and market conditions that are most favorable to success, this method enables firms to focus on target countries, maximize returns, and global expansion with data, backed by accuracy.
By factoring in the projected importer demand gap that is currently unmet and could be potential opportunity, it identifies the potential for the Exporter (Country) among 190 countries, against the general trade analysis, which identifies the biggest importer or exporter.
To discover high-growth global markets and optimize your business strategy:
Click Here
Pricing
- Single User License$ 1,995
- Department License$ 2,400
- Site License$ 3,120
- Global License$ 3,795

Leadership Perspectives from Industry Events
Search
Thought Leadership and Analyst Meet


Our Clients
6WResearch In News
- India Air Conditioner Market Set for Strong Rebound in 2026 After Weather-Led Correction and GST-Driven Recovery: 6Wresearch
- ADAS in India: How Automatic Emergency Braking, Blind Spot Detection & Driver Monitoring are Transforming Road Safety
- Doha a strategic location for EV manufacturing hub: IPA Qatar
- Demand for luxury TVs surging in the GCC, says Samsung
- Empowering Growth: The Thriving Journey of Bangladesh’s Cable Industry
- Demand for luxury TVs surging in the GCC, says Samsung
Latest Reports
- Poland Fire Protection Systems Market (2026-2032)
- Cape Verde Portable Hand-Thrown Extinguisher Market (2026-2032)
- Canada Portable Hand-Thrown Extinguisher Market (2026-2032)
- Cameroon Portable Hand-Thrown Extinguisher Market (2026-2032)
- Burundi Portable Hand-Thrown Extinguisher Market (2026-2032)
- Burkina Faso Portable Hand-Thrown Extinguisher Market (2026-2032)
- Bulgaria Portable Hand-Thrown Extinguisher Market (2026-2032)
- Brunei Portable Hand-Thrown Extinguisher Market (2026-2032)
- Botswana Portable Hand-Thrown Extinguisher Market (2026-2032)
- Bosnia and Herzegovina Portable Hand-Thrown Extinguisher Market (2026-2032)
Industry Events and Analyst Meet

HIMTEX 2026

India Refining Summit 2026

India EV Show 2026

EV tech India Expo 2026

Auto Tech Asia 2026
Whitepaper
- Middle East & Africa Commercial Security Market Click here to view more.
- Middle East & Africa Fire Safety Systems & Equipment Market Click here to view more.
- GCC Drone Market Click here to view more.
- Middle East Lighting Fixture Market Click here to view more.
- GCC Physical & Perimeter Security Market Click here to view more.