Australia Low E Glass Market (2026-2032) | Investment Trends, Consumer Insights, Forecast, Restraints, Analysis, Size, Growth, Competitive, Strategy, Share, Supply, Trends, Companies, Opportunities, Segmentation, Challenges, Value, Drivers, Demand, Strategic Insights, Outlook, Competition, Segments, Pricing Analysis, Industry, Revenue
Market Forecast By Glazing (Single Glazing, Double Glazing, Triple Glazing), By Coating Type (Solar control low-E coating, Passive low-E coating, Others), By End use (Building and Construction, Automotive, Others) And Competitive Landscape
| Product Code: ETC12576062 | Publication Date: Apr 2025 | Updated Date: Mar 2026 | Product Type: Market Research Report | |
| Publisher: 6Wresearch | Author: Sachin Kumar Rai | No. of Pages: 65 | No. of Figures: 34 | No. of Tables: 19 |
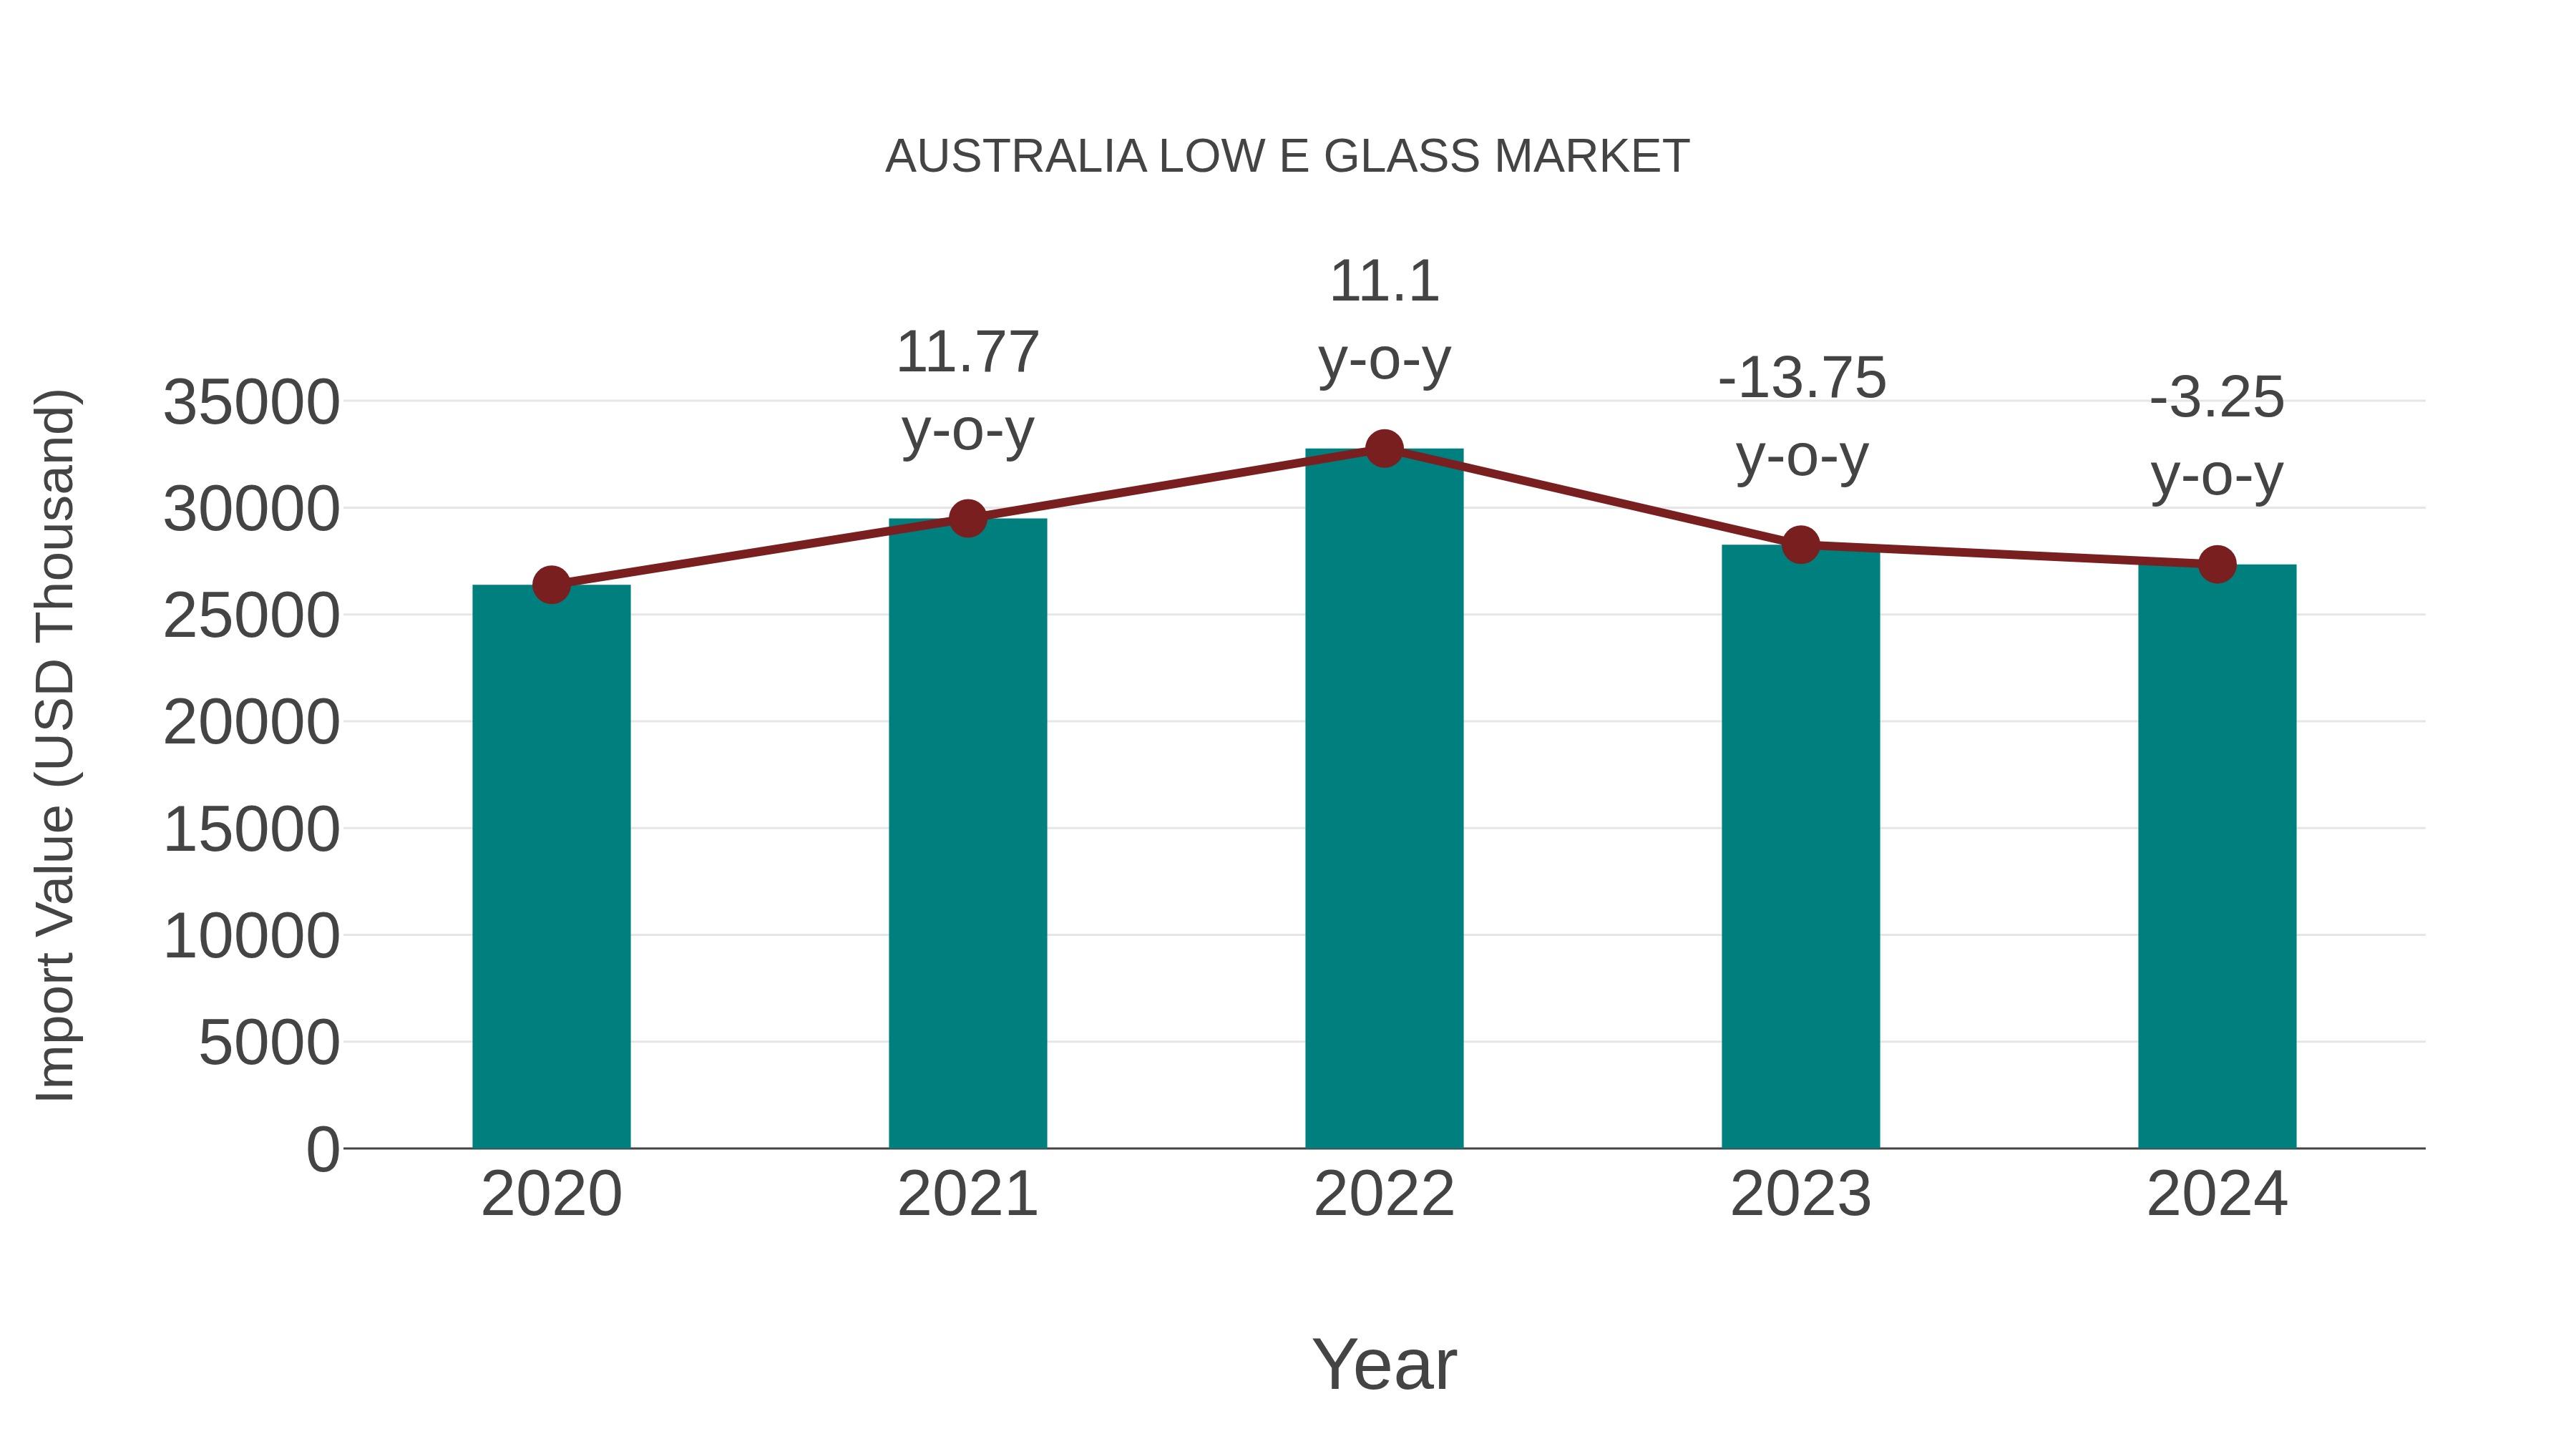
Australia Low E Glass Market: Import Trend Analysis
In the Australia low e glass market, the import trend experienced a decline with a growth rate of -3.25% from 2023 to 2024, while the compound annual growth rate (CAGR) for 2020-2024 stood at 0.89%. This downward momentum in imports could be attributed to shifting demand patterns or evolving trade policies impacting market stability.
Australia Low E Glass Market Overview
The low e glass market in Australia is experiencing steady growth due to increasing awareness of energy efficiency in buildings. Low e glass, or low emissivity glass, is designed to reduce heat transfer and enhance insulation in buildings, helping to lower energy consumption for heating and cooling. The construction industry`s focus on sustainable building practices and stringent energy efficiency regulations are driving the demand for low e glass in Australia. Additionally, the rising trend of eco-friendly construction materials and the growing emphasis on green building certifications are further propelling the market growth. Key players in the Australian low e glass market include Viridian Glass, Pilkington, and AGC Glass, offering a range of low e glass products tailored to meet the specific needs of commercial and residential construction projects.
Australia Low E Glass Market Trends
The Australia low-e glass market is experiencing steady growth driven by increasing awareness of energy efficiency and sustainability in construction. Low-e glass is gaining popularity due to its ability to improve thermal insulation and reduce energy consumption in buildings. The demand for low-e glass is also being fueled by government regulations promoting energy-efficient building practices. Additionally, advancements in technology have led to the development of low-e glass products with enhanced performance properties, such as improved solar control and glare reduction. The market is witnessing a shift towards triple glazing and vacuum glazing solutions to further enhance energy efficiency in buildings. Overall, the Australia low-e glass market is expected to continue its growth trajectory as the construction industry increasingly prioritizes energy-efficient building materials.
Australia Low E Glass Market Challenges
In the Australian low e glass market, one of the main challenges faced is the higher cost associated with low e glass compared to traditional glass options. This cost factor can act as a barrier for some consumers or businesses looking to adopt energy-efficient solutions. Additionally, there may be a lack of awareness or understanding about the benefits of low e glass, leading to slower adoption rates. Another challenge is the need for skilled professionals to properly install and maintain low e glass products, which can be a limiting factor in the market. Overall, addressing these challenges through education, cost-effective solutions, and training programs for professionals can help drive the growth of the low e glass market in Australia.
Australia Low E Glass Market Investment Opportunities
The low e glass market in Australia presents promising investment opportunities due to the increasing focus on energy efficiency in buildings. With the growing awareness of the environmental impact of traditional glass products, there is a rising demand for low e glass which provides better insulation and helps reduce energy consumption. Investing in companies that manufacture, distribute, or install low e glass products in Australia could be lucrative as the construction industry continues to prioritize sustainable building practices. Additionally, government initiatives and regulations supporting energy-efficient solutions further enhance the market potential for low e glass investments. Overall, the Australia low e glass market offers a viable opportunity for investors looking to capitalize on the sustainable building trend and contribute to reducing carbon footprint.
Australia Low E Glass Market Government Policy
The Australian government has implemented policies to promote the use of low emissivity (low-e) glass in buildings to enhance energy efficiency and reduce carbon emissions. The Nationwide House Energy Rating Scheme (NatHERS) encourages the adoption of energy-efficient building practices, including the use of low-e glass to improve thermal performance. Additionally, the Green Building Council of Australia (GBCA) awards points towards building certifications for incorporating low-e glass in construction projects. State and local governments may also offer incentives such as grants or rebates to promote the installation of low-e glass in existing buildings or new developments. These policies aim to drive the growth of the low-e glass market in Australia and contribute to sustainable building practices nationwide.
Australia Low E Glass Market Future Outlook
The future outlook for the low e glass market in Australia is promising, with a projected growth driven by factors such as increasing demand for energy-efficient building materials, stringent government regulations promoting sustainable construction practices, and growing awareness among consumers about the benefits of low e glass in reducing energy consumption and improving indoor comfort. The construction industry`s shift towards green building practices and the emphasis on reducing carbon footprint are also expected to drive the adoption of low e glass in commercial and residential buildings. Additionally, technological advancements in glass manufacturing processes and the development of new coatings are likely to enhance the performance and aesthetics of low e glass, further boosting its market growth in Australia.
Key Highlights of the Report:
- Australia Low E Glass Market Outlook
- Market Size of Australia Low E Glass Market,2025
- Forecast of Australia Low E Glass Market, 2032
- Historical Data and Forecast of Australia Low E Glass Revenues & Volume for the Period 2022-2032F
- Australia Low E Glass Market Trend Evolution
- Australia Low E Glass Market Drivers and Challenges
- Australia Low E Glass Price Trends
- Australia Low E Glass Porter's Five Forces
- Australia Low E Glass Industry Life Cycle
- Historical Data and Forecast of Australia Low E Glass Market Revenues & Volume By Glazing for the Period 2022-2032F
- Historical Data and Forecast of Australia Low E Glass Market Revenues & Volume By Single Glazing for the Period 2022-2032F
- Historical Data and Forecast of Australia Low E Glass Market Revenues & Volume By Double Glazing for the Period 2022-2032F
- Historical Data and Forecast of Australia Low E Glass Market Revenues & Volume By Triple Glazing for the Period 2022-2032F
- Historical Data and Forecast of Australia Low E Glass Market Revenues & Volume By Coating Type for the Period 2022-2032F
- Historical Data and Forecast of Australia Low E Glass Market Revenues & Volume By Solar control low-E coating for the Period 2022-2032F
- Historical Data and Forecast of Australia Low E Glass Market Revenues & Volume By Passive low-E coating for the Period 2022-2032F
- Historical Data and Forecast of Australia Low E Glass Market Revenues & Volume By Others for the Period 2022-2032F
- Historical Data and Forecast of Australia Low E Glass Market Revenues & Volume By End use for the Period 2022-2032F
- Historical Data and Forecast of Australia Low E Glass Market Revenues & Volume By Building and Construction for the Period 2022-2032F
- Historical Data and Forecast of Australia Low E Glass Market Revenues & Volume By Automotive for the Period 2022-2032F
- Historical Data and Forecast of Australia Low E Glass Market Revenues & Volume By Others for the Period 2022-2032F
- Australia Low E Glass Import Export Trade Statistics
- Market Opportunity Assessment By Glazing
- Market Opportunity Assessment By Coating Type
- Market Opportunity Assessment By End use
- Australia Low E Glass Top Companies Market Share
- Australia Low E Glass Competitive Benchmarking By Technical and Operational Parameters
- Australia Low E Glass Company Profiles
- Australia Low E Glass Key Strategic Recommendations
Australia Low E Glass Market (2026-2032): FAQs
6Wresearch actively monitors the Australia Low E Glass Market and publishes its comprehensive annual report, highlighting emerging trends, growth drivers, revenue analysis, and forecast outlook. Our insights help businesses to make data-backed strategic decisions with ongoing market dynamics. Our analysts track relevent industries related to the Australia Low E Glass Market, allowing our clients with actionable intelligence and reliable forecasts tailored to emerging regional needs.
Yes, we provide customisation as per your requirements. To learn more, feel free to contact us on sales@6wresearch.com
1 Executive Summary |
2 Introduction |
2.1 Key Highlights of the Report |
2.2 Report Description |
2.3 Market Scope & Segmentation |
2.4 Research Methodology |
2.5 Assumptions |
3 Australia Low E Glass Market Overview |
3.1 Australia Country Macro Economic Indicators |
3.2 Australia Low E Glass Market Revenues & Volume, 2022 & 2032F |
3.3 Australia Low E Glass Market - Industry Life Cycle |
3.4 Australia Low E Glass Market - Porter's Five Forces |
3.5 Australia Low E Glass Market Revenues & Volume Share, By Glazing, 2022 & 2032F |
3.6 Australia Low E Glass Market Revenues & Volume Share, By Coating Type, 2022 & 2032F |
3.7 Australia Low E Glass Market Revenues & Volume Share, By End use, 2022 & 2032F |
4 Australia Low E Glass Market Dynamics |
4.1 Impact Analysis |
4.2 Market Drivers |
4.2.1 Increasing focus on energy efficiency in buildings |
4.2.2 Government regulations promoting sustainable construction practices |
4.2.3 Growing awareness about the benefits of low emissivity (low-e) glass in reducing energy consumption |
4.3 Market Restraints |
4.3.1 High initial cost of low-e glass compared to traditional glass |
4.3.2 Limited availability of skilled labor for installation and maintenance |
4.3.3 Fluctuating raw material prices impacting production costs |
5 Australia Low E Glass Market Trends |
6 Australia Low E Glass Market, By Types |
6.1 Australia Low E Glass Market, By Glazing |
6.1.1 Overview and Analysis |
6.1.2 Australia Low E Glass Market Revenues & Volume, By Glazing, 2022-2032F |
6.1.3 Australia Low E Glass Market Revenues & Volume, By Single Glazing, 2022-2032F |
6.1.4 Australia Low E Glass Market Revenues & Volume, By Double Glazing, 2022-2032F |
6.1.5 Australia Low E Glass Market Revenues & Volume, By Triple Glazing, 2022-2032F |
6.2 Australia Low E Glass Market, By Coating Type |
6.2.1 Overview and Analysis |
6.2.2 Australia Low E Glass Market Revenues & Volume, By Solar control low-E coating, 2022-2032F |
6.2.3 Australia Low E Glass Market Revenues & Volume, By Passive low-E coating, 2022-2032F |
6.2.4 Australia Low E Glass Market Revenues & Volume, By Others, 2022-2032F |
6.3 Australia Low E Glass Market, By End use |
6.3.1 Overview and Analysis |
6.3.2 Australia Low E Glass Market Revenues & Volume, By Building and Construction, 2022-2032F |
6.3.3 Australia Low E Glass Market Revenues & Volume, By Automotive, 2022-2032F |
6.3.4 Australia Low E Glass Market Revenues & Volume, By Others, 2022-2032F |
7 Australia Low E Glass Market Import-Export Trade Statistics |
7.1 Australia Low E Glass Market Export to Major Countries |
7.2 Australia Low E Glass Market Imports from Major Countries |
8 Australia Low E Glass Market Key Performance Indicators |
8.1 Energy savings achieved by using low-e glass in buildings |
8.2 Number of green building certifications achieved by projects using low-e glass |
8.3 Rate of adoption of low-e glass in new construction projects |
9 Australia Low E Glass Market - Opportunity Assessment |
9.1 Australia Low E Glass Market Opportunity Assessment, By Glazing, 2022 & 2032F |
9.2 Australia Low E Glass Market Opportunity Assessment, By Coating Type, 2022 & 2032F |
9.3 Australia Low E Glass Market Opportunity Assessment, By End use, 2022 & 2032F |
10 Australia Low E Glass Market - Competitive Landscape |
10.1 Australia Low E Glass Market Revenue Share, By Companies, 2025 |
10.2 Australia Low E Glass Market Competitive Benchmarking, By Operating and Technical Parameters |
11 Company Profiles |
12 Recommendations |
13 Disclaimer |
Global Go To Market Strategy - 2030
Export potential enables firms to identify high-growth global markets with greater confidence by combining advanced trade intelligence with a structured quantitative methodology. The framework analyzes emerging demand trends and country-level import patterns while integrating macroeconomic and trade datasets such as GDP and population forecasts, bilateral import–export flows, tariff structures, elasticity differentials between developed and developing economies, geographic distance, and import demand projections. Using weighted trade values from 2020–2024 as the base period to project country-to-country export potential for 2030, these inputs are operationalized through calculated drivers such as gravity model parameters, tariff impact factors, and projected GDP per-capita growth. Through an analysis of hidden potentials, demand hotspots, and market conditions that are most favorable to success, this method enables firms to focus on target countries, maximize returns, and global expansion with data, backed by accuracy.
By factoring in the projected importer demand gap that is currently unmet and could be potential opportunity, it identifies the potential for the Exporter (Country) among 190 countries, against the general trade analysis, which identifies the biggest importer or exporter.
To discover high-growth global markets and optimize your business strategy:
Click Here
Pricing
- Single User License$ 1,995
- Department License$ 2,400
- Site License$ 3,120
- Global License$ 3,795

Leadership Perspectives from Industry Events
Search
Thought Leadership and Analyst Meet


Our Clients
6WResearch In News
- Doha a strategic location for EV manufacturing hub: IPA Qatar
- Demand for luxury TVs surging in the GCC, says Samsung
- Empowering Growth: The Thriving Journey of Bangladesh’s Cable Industry
- Demand for luxury TVs surging in the GCC, says Samsung
- Video call with a traditional healer? Once unthinkable, it’s now common in South Africa
- Intelligent Buildings To Smooth GCC’s Path To Net Zero
Latest Reports
- Cape Verde Portable Hand-Thrown Extinguisher Market (2026-2032)
- Canada Portable Hand-Thrown Extinguisher Market (2026-2032)
- Cameroon Portable Hand-Thrown Extinguisher Market (2026-2032)
- Burundi Portable Hand-Thrown Extinguisher Market (2026-2032)
- Burkina Faso Portable Hand-Thrown Extinguisher Market (2026-2032)
- Bulgaria Portable Hand-Thrown Extinguisher Market (2026-2032)
- Brunei Portable Hand-Thrown Extinguisher Market (2026-2032)
- Botswana Portable Hand-Thrown Extinguisher Market (2026-2032)
- Bosnia and Herzegovina Portable Hand-Thrown Extinguisher Market (2026-2032)
- Bolivia Portable Hand-Thrown Extinguisher Market (2026-2032)
Industry Events and Analyst Meet

HIMTEX 2026

India Refining Summit 2026

India EV Show 2026

EV tech India Expo 2026

Auto Tech Asia 2026
Whitepaper
- Middle East & Africa Commercial Security Market Click here to view more.
- Middle East & Africa Fire Safety Systems & Equipment Market Click here to view more.
- GCC Drone Market Click here to view more.
- Middle East Lighting Fixture Market Click here to view more.
- GCC Physical & Perimeter Security Market Click here to view more.