Australia Micromorph Market (2026-2032) | Growth, Analysis, Trends, Outlook, Forecast, Competitive Landscape, Size & Revenue, Segmentation, Companies, Industry, Value, Share
Market Forecast By Type (Hybrid PSCs, Flexible PSCs, Multi-Junction PSCs), By Application (Smart Glass, Solar Panel, Perovskite in Tandem Solar Cells, Portable Devices, Utilities), By End User (Manufacturing, Energy, Industrial Automation, Aerospace, Consumer Electronics) And Competitive Landscape
| Product Code: ETC6185169 | Publication Date: Sep 2024 | Updated Date: Mar 2026 | Product Type: Market Research Report | |
| Publisher: 6Wresearch | Author: Shubham Padhi | No. of Pages: 75 | No. of Figures: 35 | No. of Tables: 20 |
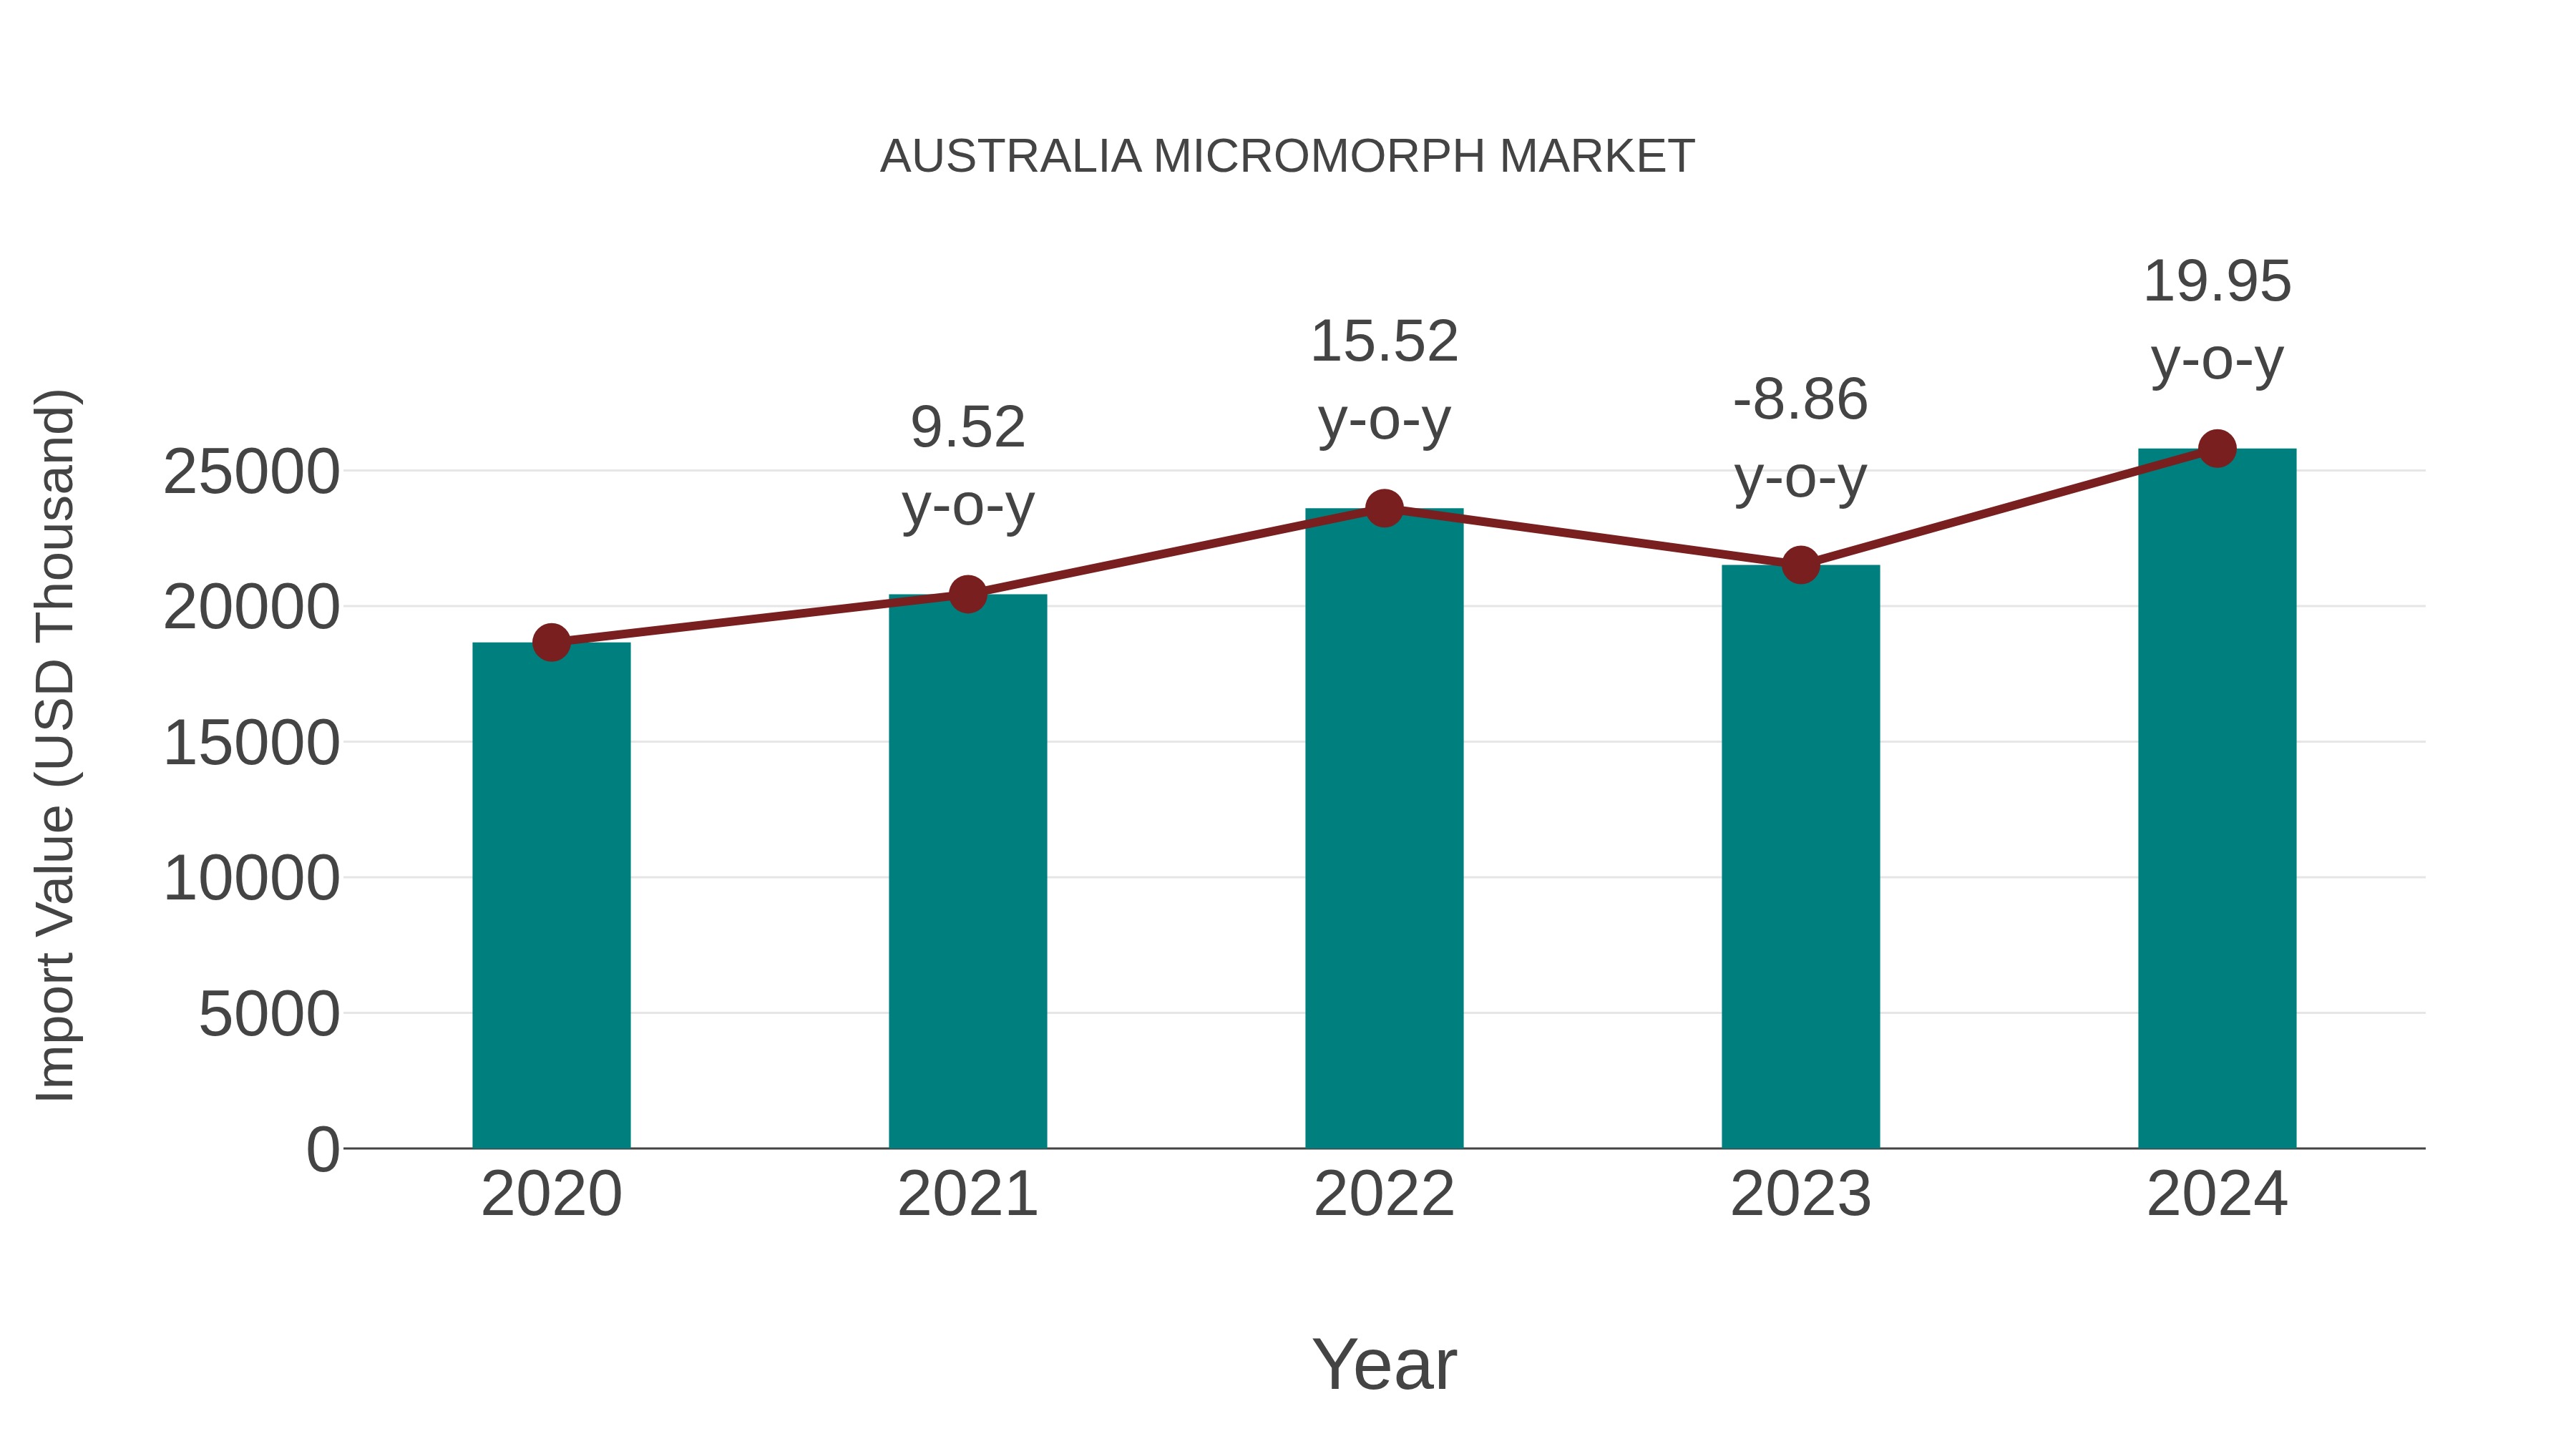
Australia Micromorph Market: Import Trend Analysis
Australia`s import trend for the micromorph market exhibited strong growth from 2023 to 2024, with a notable increase of 19.95%. The compound annual growth rate (CAGR) for the period 2020-2024 stood at 8.45%. This import momentum can be attributed to a shift in demand towards advanced technology solutions in the renewable energy sector.
Australia Micromorph Market Overview
The micromorph solar cell market in Australia, focusing on thin-film photovoltaic (PV) technology, is gaining attention for its potential in flexible and lightweight solar panels. Despite being in a niche stage compared to traditional silicon PV panels, micromorph technology is supported by research institutions aiming for higher efficiency and better performance in low-light conditions. Australias robust solar energy adoption and support for renewable innovation are key drivers for this market, although commercialization remains limited.
Trends of the market
The micromorph (micromorphous silicon) market in Australia is relatively niche but gaining attention within the solar photovoltaic segment. It is recognized for its potential to improve energy conversion efficiency by combining amorphous and microcrystalline silicon layers. As Australia invests more in solar energy, especially in residential and utility-scale projects, interest in thin-film technologies like micromorph PV is expected to grow. Cost reductions and performance improvements are essential trends driving R&D in this field.
Challenges of the market
The micromorph (microcrystalline and amorphous silicon solar cells) market in Australia is challenged by intense competition from more efficient photovoltaic technologies such as mono- and polycrystalline silicon panels. The lower conversion efficiency of micromorph solar cells makes them less attractive in a market increasingly driven by performance and return on investment. Additionally, price pressures and import reliance from Asian markets further stifle local development.
Investment opportunities in the Market
The micromorph solar technology segment, though still emerging, offers speculative but potentially high-yield investments. As Australia continues transitioning to solar energy, thin-film technologies like micromorph PV are positioned for adoption in BIPV (building-integrated photovoltaics) and flexible solar applications. Investors can look at R&D funding, pilot manufacturing, or joint ventures with academic institutions and solar startups focused on next-gen photovoltaics.
Government Policy of the market
Government policies that support the development of renewable energy technologies indirectly impact the micromorph market, particularly as it relates to solar energy. The Australian government has set ambitious renewable energy targets, and while micromorph solar cells are part of the innovation landscape, government funding and incentives are more commonly focused on more mainstream photovoltaic technologies. The market also faces the challenge of being a small player in a highly competitive space where policies favor more efficient and widely accepted solar solutions.
Key Highlights of the Report:
- Australia Micromorph Market Outlook
- Market Size of Australia Micromorph Market, 2025
- Forecast of Australia Micromorph Market, 2032
- Historical Data and Forecast of Australia Micromorph Revenues & Volume for the Period 2022 - 2032F
- Australia Micromorph Market Trend Evolution
- Australia Micromorph Market Drivers and Challenges
- Australia Micromorph Price Trends
- Australia Micromorph Porter's Five Forces
- Australia Micromorph Industry Life Cycle
- Historical Data and Forecast of Australia Micromorph Market Revenues & Volume By Type for the Period 2022 - 2032F
- Historical Data and Forecast of Australia Micromorph Market Revenues & Volume By Hybrid PSCs for the Period 2022 - 2032F
- Historical Data and Forecast of Australia Micromorph Market Revenues & Volume By Flexible PSCs for the Period 2022 - 2032F
- Historical Data and Forecast of Australia Micromorph Market Revenues & Volume By Multi-Junction PSCs for the Period 2022 - 2032F
- Historical Data and Forecast of Australia Micromorph Market Revenues & Volume By Application for the Period 2022 - 2032F
- Historical Data and Forecast of Australia Micromorph Market Revenues & Volume By Smart Glass for the Period 2022 - 2032F
- Historical Data and Forecast of Australia Micromorph Market Revenues & Volume By Solar Panel for the Period 2022 - 2032F
- Historical Data and Forecast of Australia Micromorph Market Revenues & Volume By Perovskite in Tandem Solar Cells for the Period 2022 - 2032F
- Historical Data and Forecast of Australia Micromorph Market Revenues & Volume By Portable Devices for the Period 2022 - 2032F
- Historical Data and Forecast of Australia Micromorph Market Revenues & Volume By Utilities for the Period 2022 - 2032F
- Historical Data and Forecast of Australia Micromorph Market Revenues & Volume By End User for the Period 2022 - 2032F
- Historical Data and Forecast of Australia Micromorph Market Revenues & Volume By Manufacturing for the Period 2022 - 2032F
- Historical Data and Forecast of Australia Micromorph Market Revenues & Volume By Energy for the Period 2022 - 2032F
- Historical Data and Forecast of Australia Micromorph Market Revenues & Volume By Industrial Automation for the Period 2022 - 2032F
- Historical Data and Forecast of Australia Micromorph Market Revenues & Volume By Aerospace for the Period 2022 - 2032F
- Historical Data and Forecast of Australia Micromorph Market Revenues & Volume By Consumer Electronics for the Period 2022 - 2032F
- Australia Micromorph Import Export Trade Statistics
- Market Opportunity Assessment By Type
- Market Opportunity Assessment By Application
- Market Opportunity Assessment By End User
- Australia Micromorph Top Companies Market Share
- Australia Micromorph Competitive Benchmarking By Technical and Operational Parameters
- Australia Micromorph Company Profiles
- Australia Micromorph Key Strategic Recommendations
Australia Micromorph Market (2026-2032): FAQs
6Wresearch actively monitors the Australia Micromorph Market and publishes its comprehensive annual report, highlighting emerging trends, growth drivers, revenue analysis, and forecast outlook. Our insights help businesses to make data-backed strategic decisions with ongoing market dynamics. Our analysts track relevent industries related to the Australia Micromorph Market, allowing our clients with actionable intelligence and reliable forecasts tailored to emerging regional needs.
Yes, we provide customisation as per your requirements. To learn more, feel free to contact us on sales@6wresearch.com
1 Executive Summary |
2 Introduction |
2.1 Key Highlights of the Report |
2.2 Report Description |
2.3 Market Scope & Segmentation |
2.4 Research Methodology |
2.5 Assumptions |
3 Australia Micromorph Market Overview |
3.1 Australia Country Macro Economic Indicators |
3.2 Australia Micromorph Market Revenues & Volume, 2022 & 2032F |
3.3 Australia Micromorph Market - Industry Life Cycle |
3.4 Australia Micromorph Market - Porter's Five Forces |
3.5 Australia Micromorph Market Revenues & Volume Share, By Type, 2022 & 2032F |
3.6 Australia Micromorph Market Revenues & Volume Share, By Application, 2022 & 2032F |
3.7 Australia Micromorph Market Revenues & Volume Share, By End User, 2022 & 2032F |
4 Australia Micromorph Market Dynamics |
4.1 Impact Analysis |
4.2 Market Drivers |
4.2.1 Increasing demand for renewable energy sources in Australia |
4.2.2 Government incentives and policies supporting the adoption of solar energy |
4.2.3 Technological advancements in micromorph solar panel technology |
4.3 Market Restraints |
4.3.1 High initial costs of micromorph solar panels compared to traditional energy sources |
4.3.2 Competition from other solar energy technologies |
4.3.3 Dependence on sunlight and weather conditions for optimal performance |
5 Australia Micromorph Market Trends |
6 Australia Micromorph Market, By Types |
6.1 Australia Micromorph Market, By Type |
6.1.1 Overview and Analysis |
6.1.2 Australia Micromorph Market Revenues & Volume, By Type, 2022 - 2032F |
6.1.3 Australia Micromorph Market Revenues & Volume, By Hybrid PSCs, 2022 - 2032F |
6.1.4 Australia Micromorph Market Revenues & Volume, By Flexible PSCs, 2022 - 2032F |
6.1.5 Australia Micromorph Market Revenues & Volume, By Multi-Junction PSCs, 2022 - 2032F |
6.2 Australia Micromorph Market, By Application |
6.2.1 Overview and Analysis |
6.2.2 Australia Micromorph Market Revenues & Volume, By Smart Glass, 2022 - 2032F |
6.2.3 Australia Micromorph Market Revenues & Volume, By Solar Panel, 2022 - 2032F |
6.2.4 Australia Micromorph Market Revenues & Volume, By Perovskite in Tandem Solar Cells, 2022 - 2032F |
6.2.5 Australia Micromorph Market Revenues & Volume, By Portable Devices, 2022 - 2032F |
6.2.6 Australia Micromorph Market Revenues & Volume, By Utilities, 2022 - 2032F |
6.3 Australia Micromorph Market, By End User |
6.3.1 Overview and Analysis |
6.3.2 Australia Micromorph Market Revenues & Volume, By Manufacturing, 2022 - 2032F |
6.3.3 Australia Micromorph Market Revenues & Volume, By Energy, 2022 - 2032F |
6.3.4 Australia Micromorph Market Revenues & Volume, By Industrial Automation, 2022 - 2032F |
6.3.5 Australia Micromorph Market Revenues & Volume, By Aerospace, 2022 - 2032F |
6.3.6 Australia Micromorph Market Revenues & Volume, By Consumer Electronics, 2022 - 2032F |
7 Australia Micromorph Market Import-Export Trade Statistics |
7.1 Australia Micromorph Market Export to Major Countries |
7.2 Australia Micromorph Market Imports from Major Countries |
8 Australia Micromorph Market Key Performance Indicators |
8.1 Average cost per watt of micromorph solar panels |
8.2 Efficiency improvement rate of micromorph technology |
8.3 Number of government grants or incentives supporting solar energy adoption |
8.4 Adoption rate of micromorph solar panels in residential and commercial sectors |
8.5 Rate of research and development investment in micromorph technology |
9 Australia Micromorph Market - Opportunity Assessment |
9.1 Australia Micromorph Market Opportunity Assessment, By Type, 2022 & 2032F |
9.2 Australia Micromorph Market Opportunity Assessment, By Application, 2022 & 2032F |
9.3 Australia Micromorph Market Opportunity Assessment, By End User, 2022 & 2032F |
10 Australia Micromorph Market - Competitive Landscape |
10.1 Australia Micromorph Market Revenue Share, By Companies, 2025 |
10.2 Australia Micromorph Market Competitive Benchmarking, By Operating and Technical Parameters |
11 Company Profiles |
12 Recommendations |
13 Disclaimer |
Global Go To Market Strategy - 2030
Export potential enables firms to identify high-growth global markets with greater confidence by combining advanced trade intelligence with a structured quantitative methodology. The framework analyzes emerging demand trends and country-level import patterns while integrating macroeconomic and trade datasets such as GDP and population forecasts, bilateral import–export flows, tariff structures, elasticity differentials between developed and developing economies, geographic distance, and import demand projections. Using weighted trade values from 2020–2024 as the base period to project country-to-country export potential for 2030, these inputs are operationalized through calculated drivers such as gravity model parameters, tariff impact factors, and projected GDP per-capita growth. Through an analysis of hidden potentials, demand hotspots, and market conditions that are most favorable to success, this method enables firms to focus on target countries, maximize returns, and global expansion with data, backed by accuracy.
By factoring in the projected importer demand gap that is currently unmet and could be potential opportunity, it identifies the potential for the Exporter (Country) among 190 countries, against the general trade analysis, which identifies the biggest importer or exporter.
To discover high-growth global markets and optimize your business strategy:
Click Here
Pricing
- Single User License$ 1,995
- Department License$ 2,400
- Site License$ 3,120
- Global License$ 3,795

Leadership Perspectives from Industry Events
Search
Thought Leadership and Analyst Meet


Our Clients
6WResearch In News
- Doha a strategic location for EV manufacturing hub: IPA Qatar
- Demand for luxury TVs surging in the GCC, says Samsung
- Empowering Growth: The Thriving Journey of Bangladesh’s Cable Industry
- Demand for luxury TVs surging in the GCC, says Samsung
- Video call with a traditional healer? Once unthinkable, it’s now common in South Africa
- Intelligent Buildings To Smooth GCC’s Path To Net Zero
Latest Reports
- Taiwan Airport Wireless Infrastructure Market (2026-2032)
- Vietnam Airport Wireless Infrastructure Market (2026-2032)
- Thailand Airport Wireless Infrastructure Market (2026-2032)
- South Korea Airport Wireless Infrastructure Market (2026-2032)
- Romania Airport Wireless Infrastructure Market (2026-2032)
- Qatar Airport Wireless Infrastructure Market (2026-2032)
- Philippines Airport Wireless Infrastructure Market (2026-2032)
- Japan Airport Wireless Infrastructure Market (2026-2032)
- Taiwan Airport Winter Services Market (2026-2032)
- Vietnam Airport Winter Services Market (2026-2032)
Industry Events and Analyst Meet

HIMTEX 2026

India Refining Summit 2026

India EV Show 2026

EV tech India Expo 2026

Auto Tech Asia 2026
Whitepaper
- Middle East & Africa Commercial Security Market Click here to view more.
- Middle East & Africa Fire Safety Systems & Equipment Market Click here to view more.
- GCC Drone Market Click here to view more.
- Middle East Lighting Fixture Market Click here to view more.
- GCC Physical & Perimeter Security Market Click here to view more.