Australia Non-athletic Footwear Market (2026-2032) | Competitive Landscape, Segmentation, Outlook, Growth, Size & Revenue, Companies, Trends, Analysis, Value, Forecast, Industry, Share
Market Forecast By Product Type (Lace Up Shoes, Slip On Shoes), By Material (Leather, Mesh, Natural Rubber, Polyester, Others (Faux Fur, Faux Leather, etc.)), By End-user (Men, Women, Kids), By Price (Low, Medium, High), By Distribution Channel (Online, Offline) And Competitive Landscape
| Product Code: ETC6186371 | Publication Date: Sep 2024 | Updated Date: Mar 2026 | Product Type: Market Research Report | |
| Publisher: 6Wresearch | Author: Shubham Deep | No. of Pages: 75 | No. of Figures: 35 | No. of Tables: 20 |
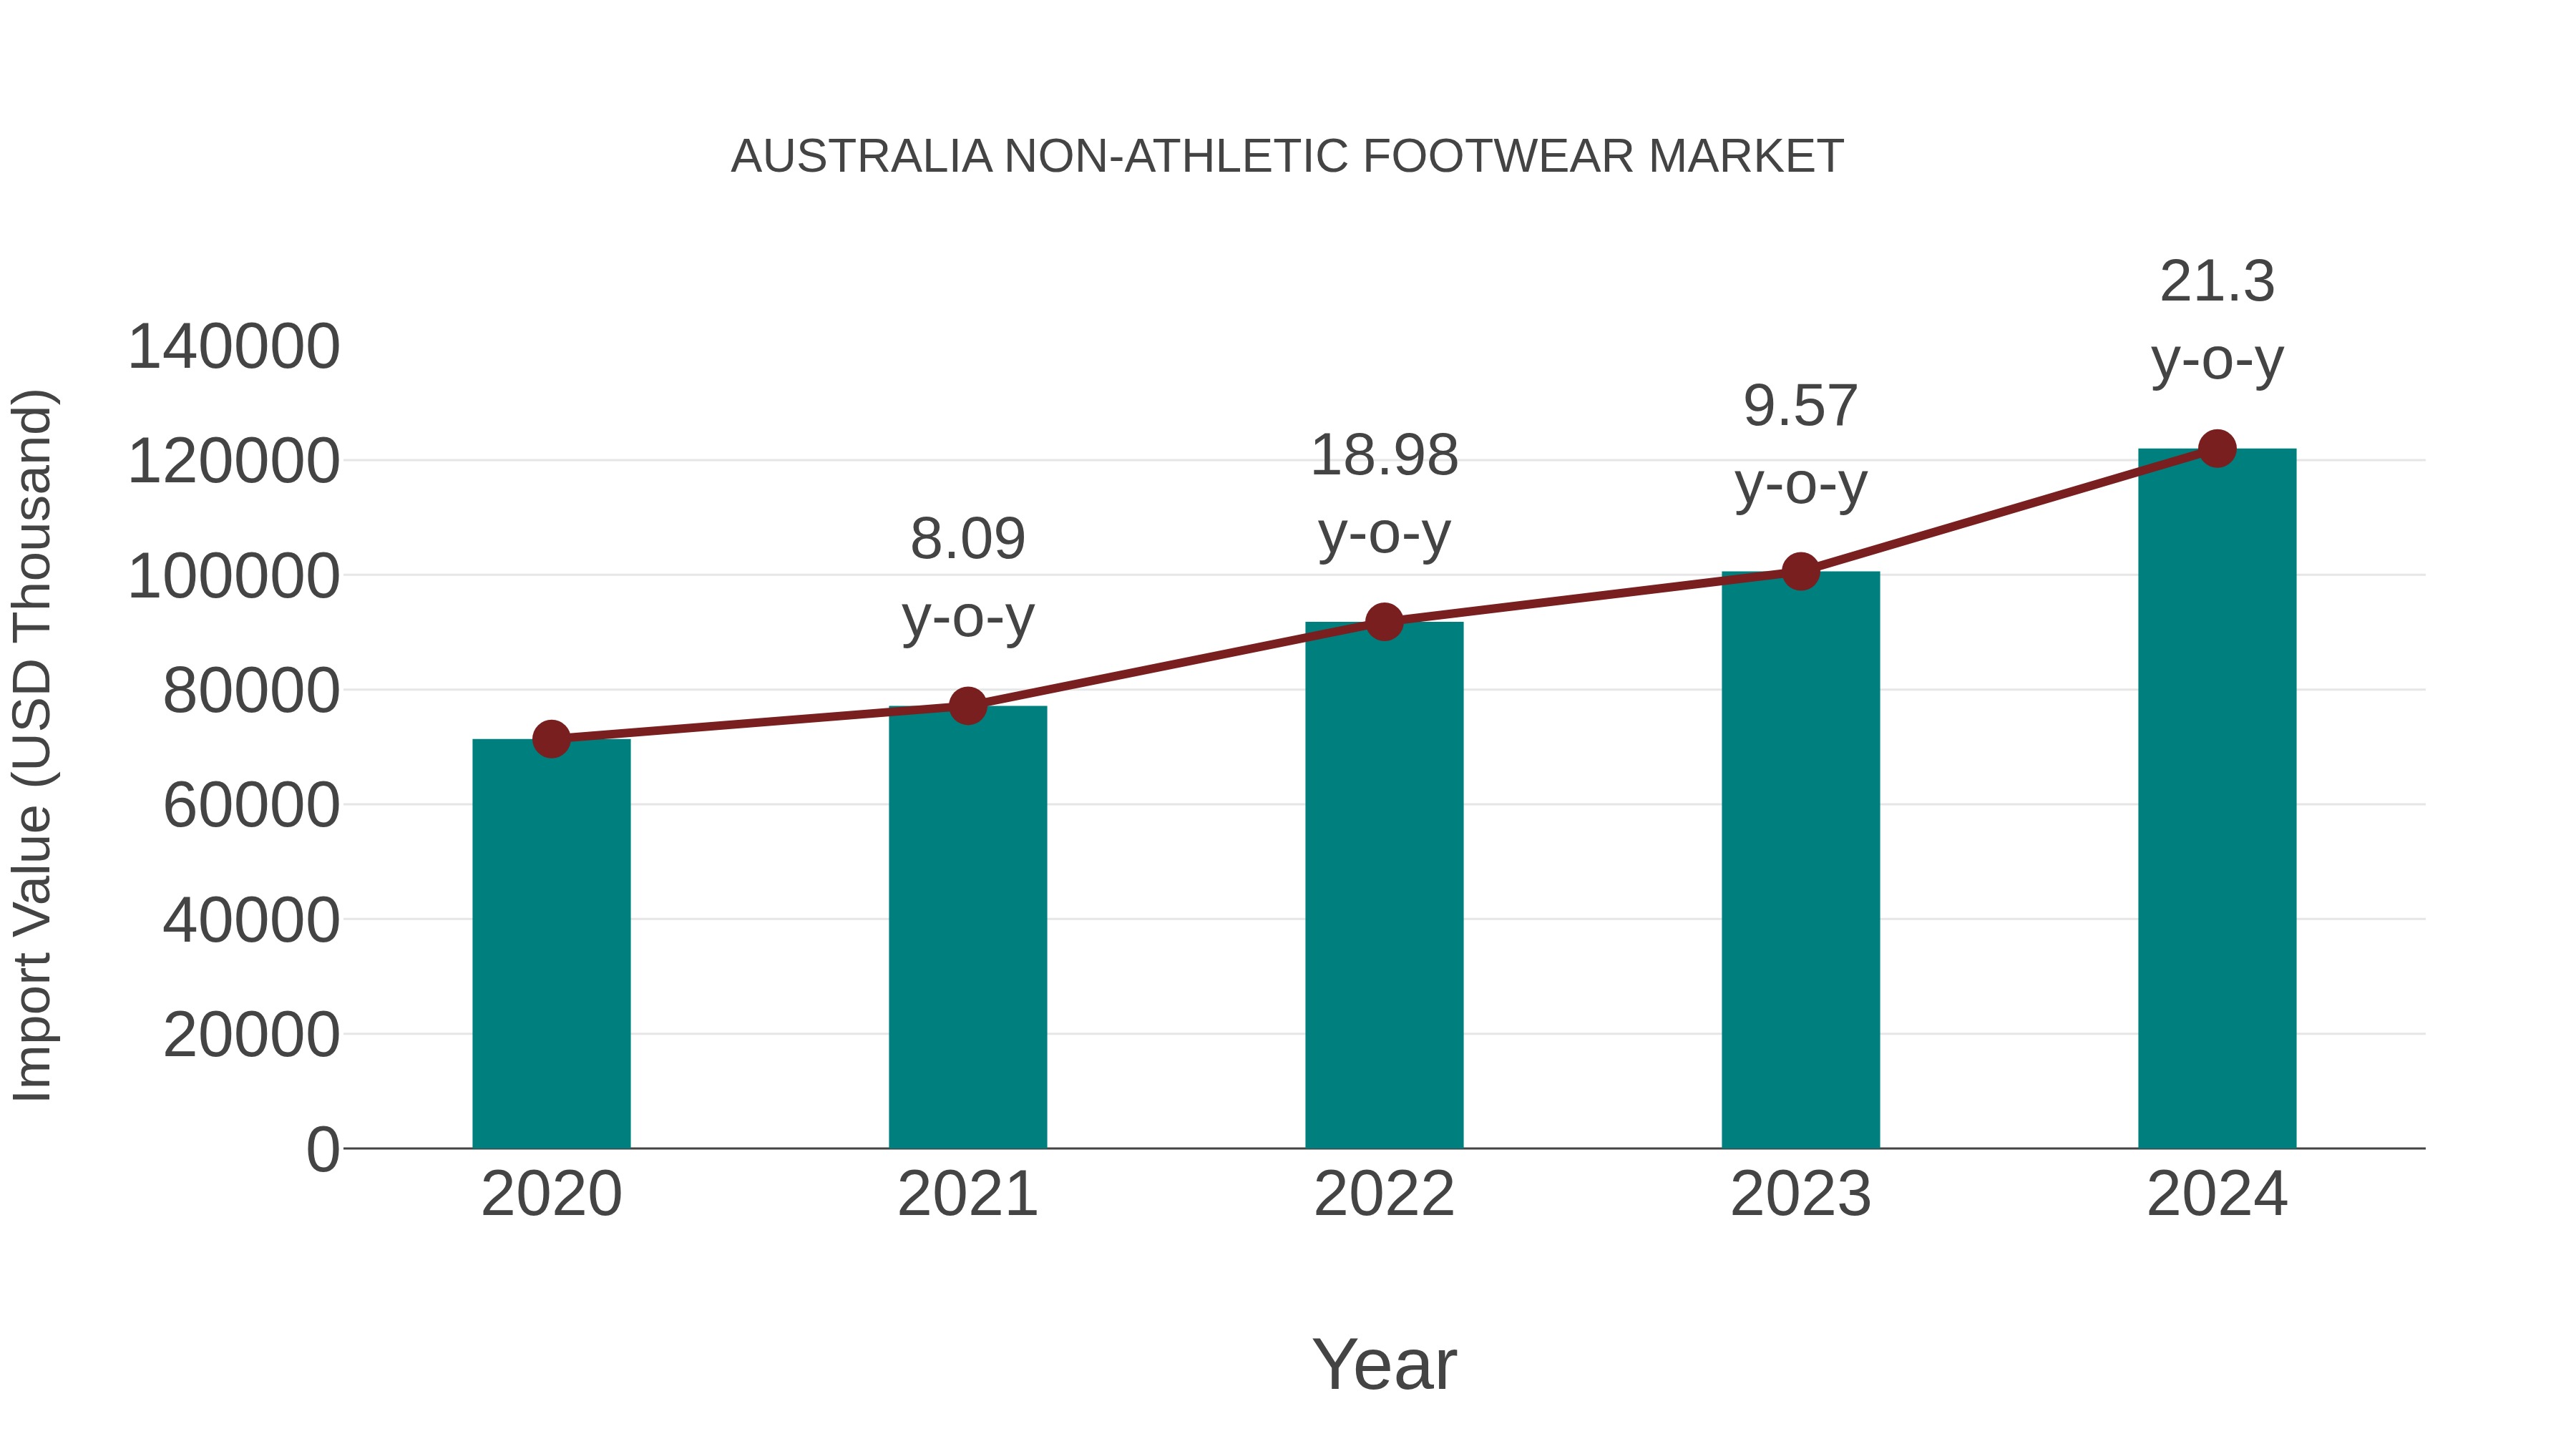
Australia Non-athletic Footwear Market: Import Trend Analysis
Australia`s non-athletic footwear import trend experienced significant growth, with a 21.3% increase from 2023 to 2024 and a compound annual growth rate (CAGR) of 14.34% from 2020 to 2024. This uptrend can be attributed to shifting consumer preferences towards more diverse footwear styles and increased demand for imported footwear products in the Australian market.
Australia Non Athletic Footwear Market Overview
The non-athletic footwear market in Australia is growing due to changing fashion trends and increased demand for comfort and style. Casual and formal footwear segments are expanding as consumers prioritize both functionality and aesthetics. The rise of e-commerce and growing interest in sustainable materials are influencing purchasing decisions and market growth.
Drivers of the market
The non-athletic footwear market in Australia is driven by increasing demand for casual and fashion footwear. Growing disposable income, rising influence of social media and fashion trends, and increasing availability of eco-friendly and sustainable footwear options are fueling market growth. Expansion of e-commerce platforms and rising focus on product innovation and comfort are also supporting market expansion.
Challenges of the market
The non-athletic footwear market in Australia faces challenges from high production costs due to material and labor expenses. Regulatory requirements for product safety and environmental sustainability increase production complexity. Competition from low-cost imports and branded athletic footwear reduces market demand. Fluctuations in raw material prices and supply chain disruptions further restrict market growth.
Investment opportunities in the Market
The non-athletic footwear market in Australia is growing due to increasing demand for casual and comfort-oriented footwear. Investment opportunities exist in developing sustainable and vegan footwear, expanding e-commerce presence, and introducing customizable design options. Growth in lifestyle-focused consumer trends and increasing disposable income are driving market demand.
Government Policy of the market
Non-athletic footwear imports and domestic production are regulated under trade and consumer protection laws. Product safety and labeling requirements are enforced under the Australian Consumer Law (ACL). The government provides incentives for domestic footwear manufacturing through the Modern Manufacturing Initiative (MMI). Environmental guidelines encourage the use of sustainable materials and recycling in footwear production. Import tariffs on footwear products are adjusted based on trade agreements with partner countries.
Key Highlights of the Report:
- Australia Non-athletic Footwear Market Outlook
- Market Size of Australia Non-athletic Footwear Market, 2025
- Forecast of Australia Non-athletic Footwear Market, 2032
- Historical Data and Forecast of Australia Non-athletic Footwear Revenues & Volume for the Period 2022 - 2032F
- Australia Non-athletic Footwear Market Trend Evolution
- Australia Non-athletic Footwear Market Drivers and Challenges
- Australia Non-athletic Footwear Price Trends
- Australia Non-athletic Footwear Porter's Five Forces
- Australia Non-athletic Footwear Industry Life Cycle
- Historical Data and Forecast of Australia Non-athletic Footwear Market Revenues & Volume By Product Type for the Period 2022 - 2032F
- Historical Data and Forecast of Australia Non-athletic Footwear Market Revenues & Volume By Lace Up Shoes for the Period 2022 - 2032F
- Historical Data and Forecast of Australia Non-athletic Footwear Market Revenues & Volume By Slip On Shoes for the Period 2022 - 2032F
- Historical Data and Forecast of Australia Non-athletic Footwear Market Revenues & Volume By Material for the Period 2022 - 2032F
- Historical Data and Forecast of Australia Non-athletic Footwear Market Revenues & Volume By Leather for the Period 2022 - 2032F
- Historical Data and Forecast of Australia Non-athletic Footwear Market Revenues & Volume By Mesh for the Period 2022 - 2032F
- Historical Data and Forecast of Australia Non-athletic Footwear Market Revenues & Volume By Natural Rubber for the Period 2022 - 2032F
- Historical Data and Forecast of Australia Non-athletic Footwear Market Revenues & Volume By Polyester for the Period 2022 - 2032F
- Historical Data and Forecast of Australia Non-athletic Footwear Market Revenues & Volume By Others (Faux Fur, Faux Leather, etc.) for the Period 2022 - 2032F
- Historical Data and Forecast of Australia Non-athletic Footwear Market Revenues & Volume By End-user for the Period 2022 - 2032F
- Historical Data and Forecast of Australia Non-athletic Footwear Market Revenues & Volume By Men for the Period 2022 - 2032F
- Historical Data and Forecast of Australia Non-athletic Footwear Market Revenues & Volume By Women for the Period 2022 - 2032F
- Historical Data and Forecast of Australia Non-athletic Footwear Market Revenues & Volume By Kids for the Period 2022 - 2032F
- Historical Data and Forecast of Australia Non-athletic Footwear Market Revenues & Volume By Price for the Period 2022 - 2032F
- Historical Data and Forecast of Australia Non-athletic Footwear Market Revenues & Volume By Low for the Period 2022 - 2032F
- Historical Data and Forecast of Australia Non-athletic Footwear Market Revenues & Volume By Medium for the Period 2022 - 2032F
- Historical Data and Forecast of Australia Non-athletic Footwear Market Revenues & Volume By High for the Period 2022 - 2032F
- Historical Data and Forecast of Australia Non-athletic Footwear Market Revenues & Volume By Distribution Channel for the Period 2022 - 2032F
- Historical Data and Forecast of Australia Non-athletic Footwear Market Revenues & Volume By Online for the Period 2022 - 2032F
- Historical Data and Forecast of Australia Non-athletic Footwear Market Revenues & Volume By Offline for the Period 2022 - 2032F
- Australia Non-athletic Footwear Import Export Trade Statistics
- Market Opportunity Assessment By Product Type
- Market Opportunity Assessment By Material
- Market Opportunity Assessment By End-user
- Market Opportunity Assessment By Price
- Market Opportunity Assessment By Distribution Channel
- Australia Non-athletic Footwear Top Companies Market Share
- Australia Non-athletic Footwear Competitive Benchmarking By Technical and Operational Parameters
- Australia Non-athletic Footwear Company Profiles
- Australia Non-athletic Footwear Key Strategic Recommendations
Australia Non-athletic Footwear Market (2026-2032): FAQs
6Wresearch actively monitors the Australia Non-athletic Footwear Market and publishes its comprehensive annual report, highlighting emerging trends, growth drivers, revenue analysis, and forecast outlook. Our insights help businesses to make data-backed strategic decisions with ongoing market dynamics. Our analysts track relevent industries related to the Australia Non-athletic Footwear Market, allowing our clients with actionable intelligence and reliable forecasts tailored to emerging regional needs.
Yes, we provide customisation as per your requirements. To learn more, feel free to contact us on sales@6wresearch.com
1 Executive Summary |
2 Introduction |
2.1 Key Highlights of the Report |
2.2 Report Description |
2.3 Market Scope & Segmentation |
2.4 Research Methodology |
2.5 Assumptions |
3 Australia Non-athletic Footwear Market Overview |
3.1 Australia Country Macro Economic Indicators |
3.2 Australia Non-athletic Footwear Market Revenues & Volume, 2022 & 2032F |
3.3 Australia Non-athletic Footwear Market - Industry Life Cycle |
3.4 Australia Non-athletic Footwear Market - Porter's Five Forces |
3.5 Australia Non-athletic Footwear Market Revenues & Volume Share, By Product Type, 2022 & 2032F |
3.6 Australia Non-athletic Footwear Market Revenues & Volume Share, By Material, 2022 & 2032F |
3.7 Australia Non-athletic Footwear Market Revenues & Volume Share, By End-user, 2022 & 2032F |
3.8 Australia Non-athletic Footwear Market Revenues & Volume Share, By Price, 2022 & 2032F |
3.9 Australia Non-athletic Footwear Market Revenues & Volume Share, By Distribution Channel, 2022 & 2032F |
4 Australia Non-athletic Footwear Market Dynamics |
4.1 Impact Analysis |
4.2 Market Drivers |
4.2.1 Increasing focus on fashion and style among consumers |
4.2.2 Growing disposable income levels in Australia |
4.2.3 Rising demand for comfortable and versatile footwear options |
4.3 Market Restraints |
4.3.1 Intense competition from online retailers and international brands |
4.3.2 Fluctuations in raw material prices affecting production costs |
5 Australia Non-athletic Footwear Market Trends |
6 Australia Non-athletic Footwear Market, By Types |
6.1 Australia Non-athletic Footwear Market, By Product Type |
6.1.1 Overview and Analysis |
6.1.2 Australia Non-athletic Footwear Market Revenues & Volume, By Product Type, 2022 - 2032F |
6.1.3 Australia Non-athletic Footwear Market Revenues & Volume, By Lace Up Shoes, 2022 - 2032F |
6.1.4 Australia Non-athletic Footwear Market Revenues & Volume, By Slip On Shoes, 2022 - 2032F |
6.2 Australia Non-athletic Footwear Market, By Material |
6.2.1 Overview and Analysis |
6.2.2 Australia Non-athletic Footwear Market Revenues & Volume, By Leather, 2022 - 2032F |
6.2.3 Australia Non-athletic Footwear Market Revenues & Volume, By Mesh, 2022 - 2032F |
6.2.4 Australia Non-athletic Footwear Market Revenues & Volume, By Natural Rubber, 2022 - 2032F |
6.2.5 Australia Non-athletic Footwear Market Revenues & Volume, By Polyester, 2022 - 2032F |
6.2.6 Australia Non-athletic Footwear Market Revenues & Volume, By Others (Faux Fur, Faux Leather, etc.), 2022 - 2032F |
6.3 Australia Non-athletic Footwear Market, By End-user |
6.3.1 Overview and Analysis |
6.3.2 Australia Non-athletic Footwear Market Revenues & Volume, By Men, 2022 - 2032F |
6.3.3 Australia Non-athletic Footwear Market Revenues & Volume, By Women, 2022 - 2032F |
6.3.4 Australia Non-athletic Footwear Market Revenues & Volume, By Kids, 2022 - 2032F |
6.4 Australia Non-athletic Footwear Market, By Price |
6.4.1 Overview and Analysis |
6.4.2 Australia Non-athletic Footwear Market Revenues & Volume, By Low, 2022 - 2032F |
6.4.3 Australia Non-athletic Footwear Market Revenues & Volume, By Medium, 2022 - 2032F |
6.4.4 Australia Non-athletic Footwear Market Revenues & Volume, By High, 2022 - 2032F |
6.5 Australia Non-athletic Footwear Market, By Distribution Channel |
6.5.1 Overview and Analysis |
6.5.2 Australia Non-athletic Footwear Market Revenues & Volume, By Online, 2022 - 2032F |
6.5.3 Australia Non-athletic Footwear Market Revenues & Volume, By Offline, 2022 - 2032F |
7 Australia Non-athletic Footwear Market Import-Export Trade Statistics |
7.1 Australia Non-athletic Footwear Market Export to Major Countries |
7.2 Australia Non-athletic Footwear Market Imports from Major Countries |
8 Australia Non-athletic Footwear Market Key Performance Indicators |
8.1 Consumer sentiment towards non-athletic footwear trends |
8.2 Number of new product launches and innovations in the market |
8.3 Consumer engagement and feedback on social media platforms |
8.4 Retail store foot traffic and conversion rates |
8.5 Market penetration in different age demographics and regions |
9 Australia Non-athletic Footwear Market - Opportunity Assessment |
9.1 Australia Non-athletic Footwear Market Opportunity Assessment, By Product Type, 2022 & 2032F |
9.2 Australia Non-athletic Footwear Market Opportunity Assessment, By Material, 2022 & 2032F |
9.3 Australia Non-athletic Footwear Market Opportunity Assessment, By End-user, 2022 & 2032F |
9.4 Australia Non-athletic Footwear Market Opportunity Assessment, By Price, 2022 & 2032F |
9.5 Australia Non-athletic Footwear Market Opportunity Assessment, By Distribution Channel, 2022 & 2032F |
10 Australia Non-athletic Footwear Market - Competitive Landscape |
10.1 Australia Non-athletic Footwear Market Revenue Share, By Companies, 2025 |
10.2 Australia Non-athletic Footwear Market Competitive Benchmarking, By Operating and Technical Parameters |
11 Company Profiles |
12 Recommendations |
13 Disclaimer |
Export potential assessment - trade Analytics for 2030
Export potential enables firms to identify high-growth global markets with greater confidence by combining advanced trade intelligence with a structured quantitative methodology. The framework analyzes emerging demand trends and country-level import patterns while integrating macroeconomic and trade datasets such as GDP and population forecasts, bilateral import–export flows, tariff structures, elasticity differentials between developed and developing economies, geographic distance, and import demand projections. Using weighted trade values from 2020–2024 as the base period to project country-to-country export potential for 2030, these inputs are operationalized through calculated drivers such as gravity model parameters, tariff impact factors, and projected GDP per-capita growth. Through an analysis of hidden potentials, demand hotspots, and market conditions that are most favorable to success, this method enables firms to focus on target countries, maximize returns, and global expansion with data, backed by accuracy.
By factoring in the projected importer demand gap that is currently unmet and could be potential opportunity, it identifies the potential for the Exporter (Country) among 190 countries, against the general trade analysis, which identifies the biggest importer or exporter.
To discover high-growth global markets and optimize your business strategy:
Click Here
Pricing
- Single User License$ 1,995
- Department License$ 2,400
- Site License$ 3,120
- Global License$ 3,795

Search
Thought Leadership and Analyst Meet


Our Clients
Latest Reports
- China Electric Appliance Rental Market (2026-2032) | Trends, Revenue, Growth, Challenges, Size, Value, Outlook, Pricing, Strategy, Insights, Restraints, segmentation, Companies, Investment Opportunities, Analysis, Demand, Drivers, Competition, Forecast, Share
- Chile Electric Appliance Rental Market (2026-2032) | Outlook, Competition, Drivers, Strategy, Revenue, Analysis, Value, Pricing, Restraints, Size, Demand, Share, Growth, Forecast, Challenges, Insights, Investment Opportunities, Companies, Trends, segmentation
- Cambodia Electric Appliance Rental Market (2026-2032) | Companies, Analysis, Restraints, Pricing, Insights, Challenges, Outlook, Strategy, Forecast, Trends, Competition, Value, Revenue, Investment Opportunities, segmentation, Drivers, Size, Demand, Growth, Share
- Brazil Electric Appliance Rental Market (2026-2032) | Revenue, Strategy, Forecast, Companies, segmentation, Competition, Size, Investment Opportunities, Pricing, Restraints, Outlook, Challenges, Analysis, Drivers, Value, Demand, Insights, Trends, Growth, Share
- Bangladesh Electric Appliance Rental Market (2026-2032) | Drivers, Forecast, Investment Opportunities, Strategy, Insights, Demand, Challenges, Outlook, Trends, Competition, Value, Revenue, Size, Pricing, Analysis, Companies, Restraints, segmentation, Share, Growth
- Bahrain Electric Appliance Rental Market (2026-2032) | Outlook, Size, Competition, Restraints, Drivers, Value, Trends, Investment Opportunities, Insights, Forecast, Revenue, Strategy, Growth, Share, Demand, Analysis, Challenges, Companies, segmentation, Pricing
- Azerbaijan Electric Appliance Rental Market (2026-2032) | Trends, Investment Opportunities, Restraints, Insights, Strategy, Competition, Value, Growth, Demand, Drivers, Analysis, Forecast, Size, Share, Outlook, segmentation, Pricing, Challenges, Revenue, Companies
- Australia Electric Appliance Rental Market (2026-2032) | Challenges, Restraints, Forecast, Demand, Size, Competition, Pricing, Investment Opportunities, Revenue, Trends, Drivers, Growth, Outlook, Analysis, Strategy, Value, segmentation, Insights, Companies, Share
- Argentina Electric Appliance Rental Market (2026-2032) | Growth, Trends, Insights, Outlook, Forecast, Size, Drivers, Analysis, Restraints, Challenges, Share, Revenue, Investment Opportunities, Strategy, Demand, Value, Companies, segmentation, Competition, Pricing
- Algeria Electric Appliance Rental Market (2026-2032) | Share, Size, Value, Strategy, Competition, Outlook, Challenges, Companies, Trends, Pricing, Insights, Forecast, Investment Opportunities, Revenue, Growth, Restraints, segmentation, Analysis, Demand, Drivers
Industry Events and Analyst Meet

HIMTEX 2026

India Refining Summit 2026

India EV Show 2026

EV tech India Expo 2026

Auto Tech Asia 2026
Whitepaper
- Middle East & Africa Commercial Security Market Click here to view more.
- Middle East & Africa Fire Safety Systems & Equipment Market Click here to view more.
- GCC Drone Market Click here to view more.
- Middle East Lighting Fixture Market Click here to view more.
- GCC Physical & Perimeter Security Market Click here to view more.
6WResearch In News
- Doha a strategic location for EV manufacturing hub: IPA Qatar
- Demand for luxury TVs surging in the GCC, says Samsung
- Empowering Growth: The Thriving Journey of Bangladesh’s Cable Industry
- Demand for luxury TVs surging in the GCC, says Samsung
- Video call with a traditional healer? Once unthinkable, it’s now common in South Africa
- Intelligent Buildings To Smooth GCC’s Path To Net Zero