Australia Non-Chocolate Candy Market (2026-2032) | Value, Competitive Landscape, Outlook, Share, Size & Revenue, Analysis, Forecast, Trends, Companies, Growth, Segmentation, Industry
Market Forecast By Type (Hard type, Chewing type, Scotch type), By Distribution channel (Supermarkets/Hypermarkets, Specialist Stores, Convenience Stores, Online Stores, Others) And Competitive Landscape
| Product Code: ETC6186304 | Publication Date: Sep 2024 | Updated Date: Mar 2026 | Product Type: Market Research Report | |
| Publisher: 6Wresearch | Author: Shubham Deep | No. of Pages: 75 | No. of Figures: 35 | No. of Tables: 20 |
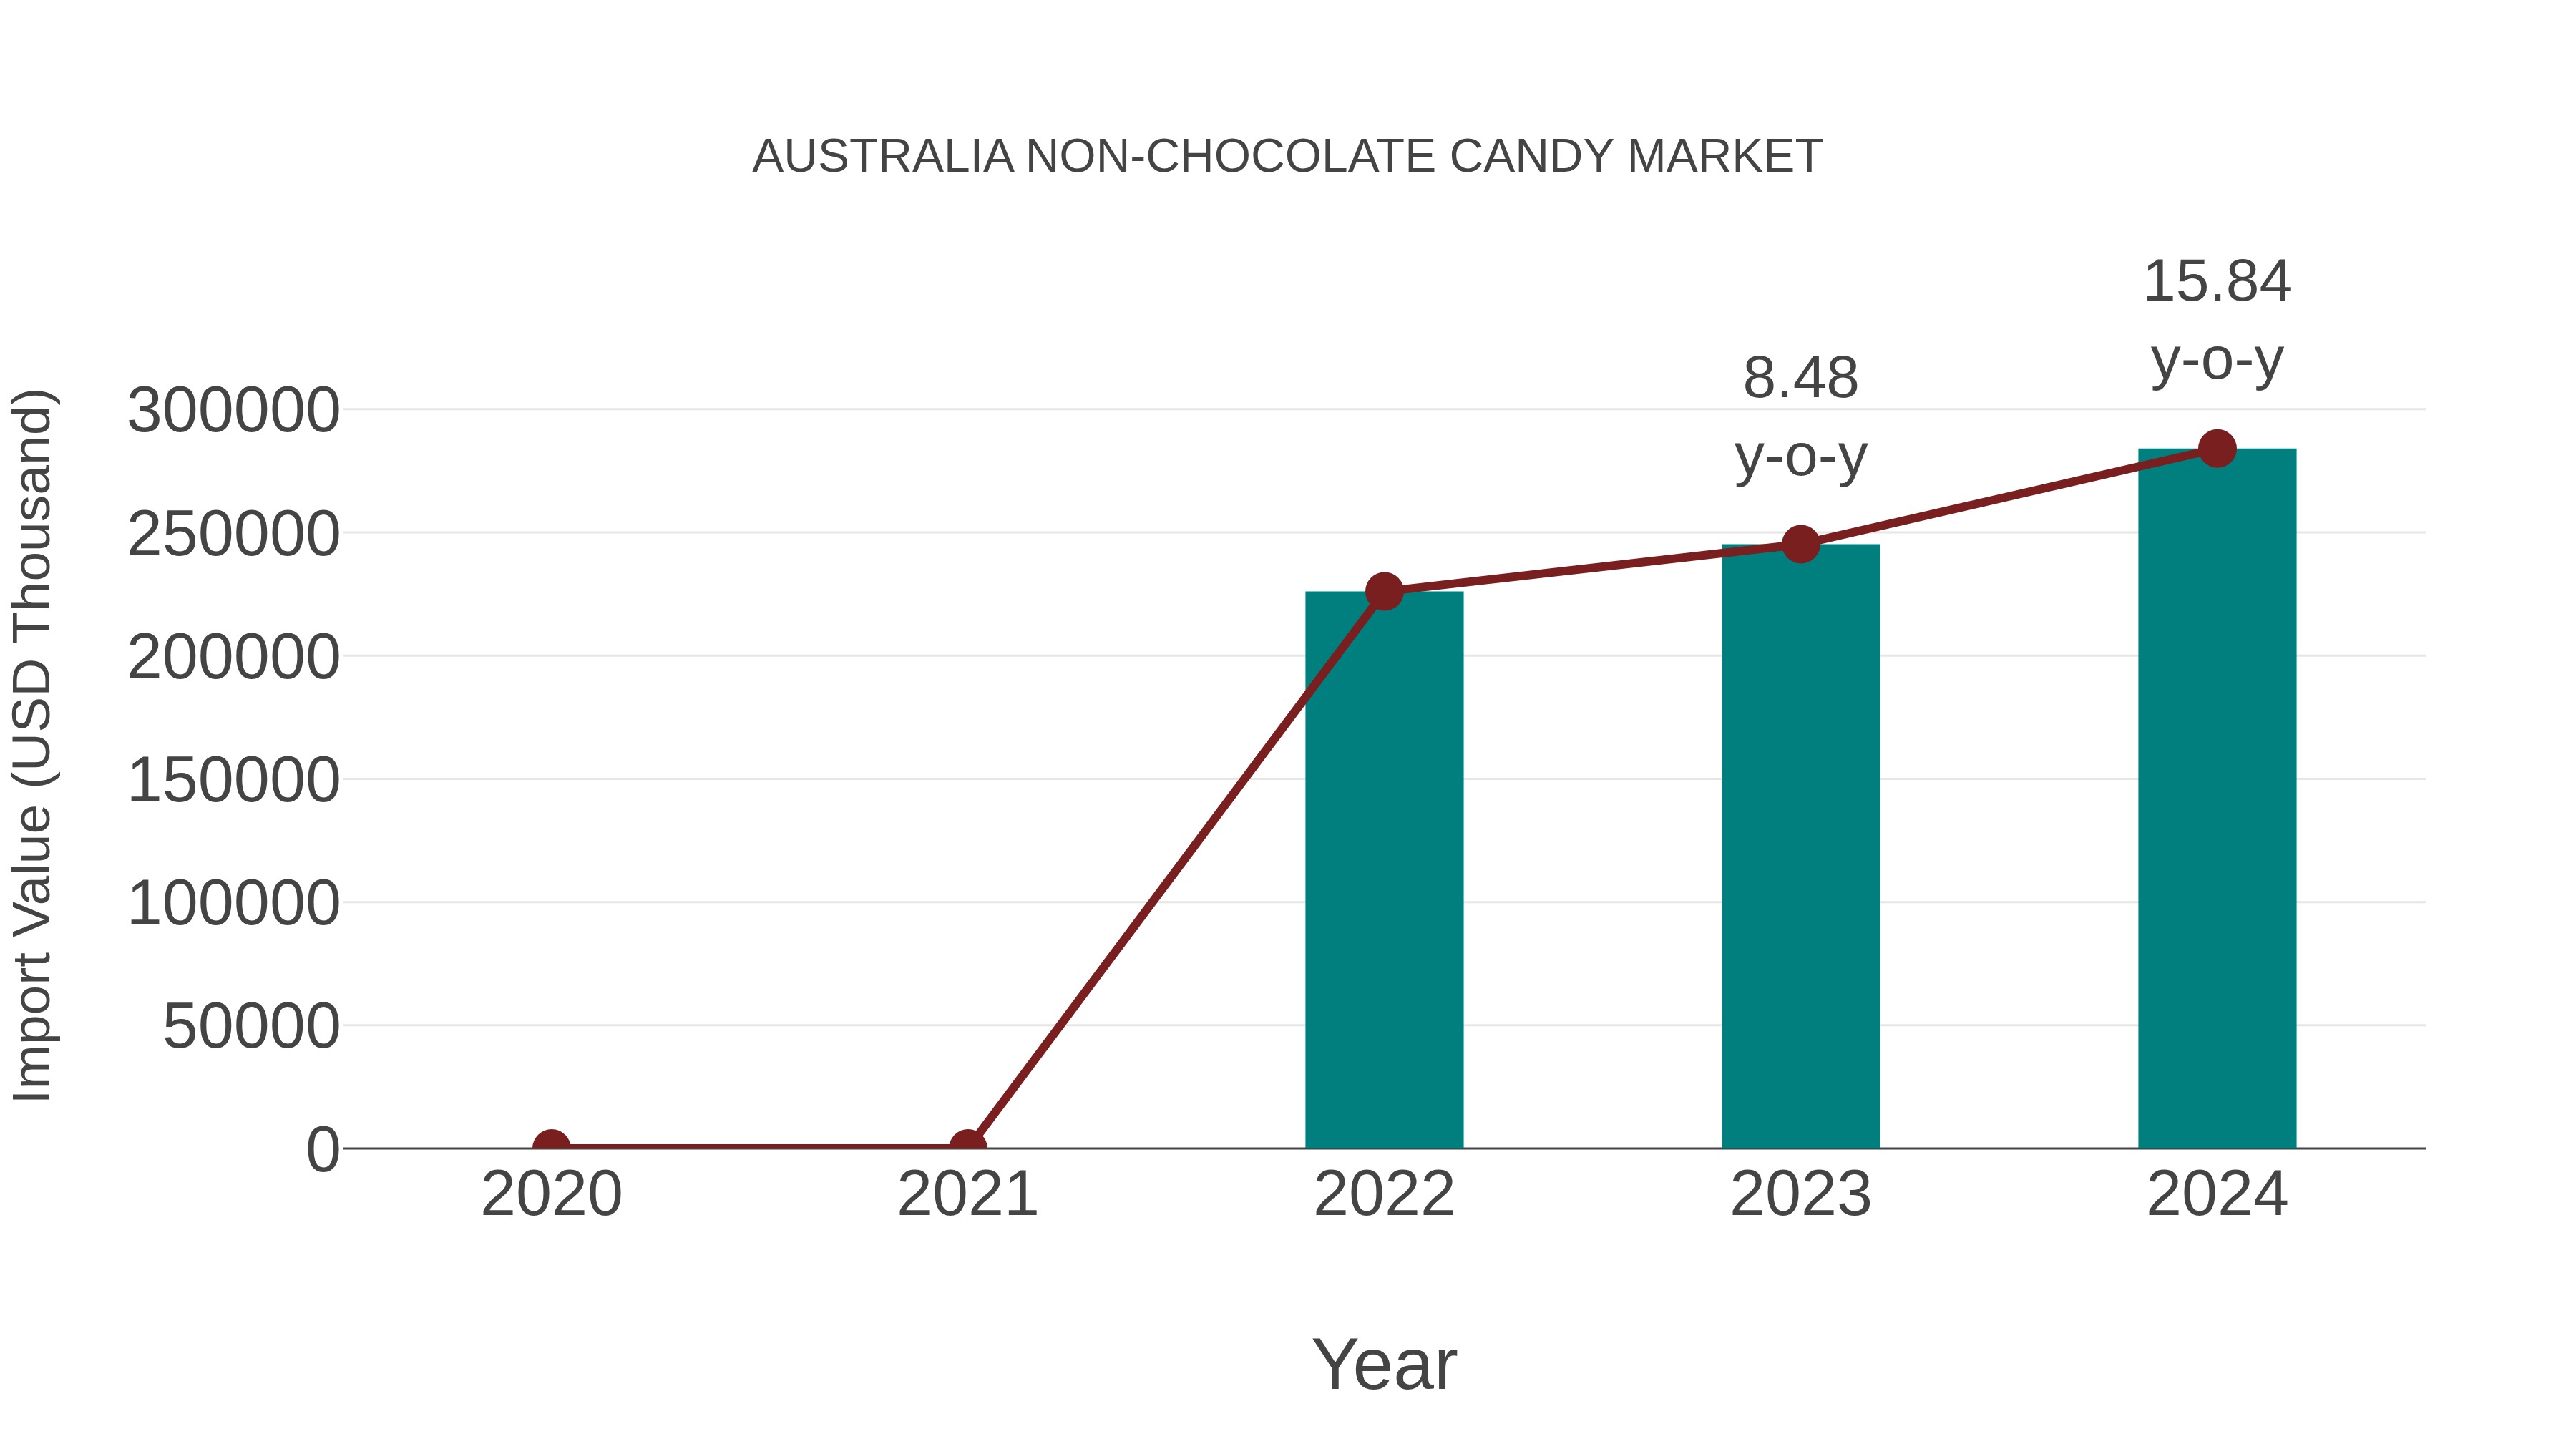
Australia Non-chocolate Candy Market: Import Trend Analysis
Australia`s import trend for non-chocolate candy in 2024 saw a growth rate of 15.84% compared to the previous year. The compound annual growth rate (CAGR) for the period 2020-2024 stood at 12.1%. This significant growth in imports can be attributed to shifting consumer preferences towards indulgent treats and the increasing variety of non-chocolate candy offerings in the market.
Australia Non Chocolate Candy Market Overview
The non-chocolate candy market in Australia is growing due to increasing consumer demand for sugar-based confectionery, gummies, and hard candies. Healthier alternatives with natural ingredients and reduced sugar content are becoming more popular. Seasonal demand and product innovation in terms of flavors and packaging are also supporting market expansion.
Drivers of the market
The non-chocolate candy market in Australia is driven by increasing demand for sugar-based and sugar-free candy alternatives. Growing availability of exotic flavors, rising preference for natural and organic ingredients, and increasing product innovation are fueling market growth. Expansion of distribution through supermarkets and online platforms is also supporting market expansion.
Challenges of the market
The non-chocolate candy market in Australia faces challenges from high production costs due to the need for flavor consistency and product stability. Regulatory requirements for food safety and labeling increase production complexity. Competition from chocolate-based products and other sweet snacks reduces market demand. High retail prices and health concerns about sugar consumption further restrict market penetration.
Investment opportunities in the Market
The non-chocolate candy market in Australia is growing due to increasing demand for sugar-free and functional candy options. Investment opportunities exist in developing low-sugar and vitamin-enriched candy, expanding distribution networks, and introducing new flavors. Growth in health-conscious consumer behavior and product innovation are driving market expansion.
Government Policy of the market
Non-chocolate candy is regulated by FSANZ for ingredient safety, labeling, and nutritional content. Import and export of candy products are controlled under food safety and trade regulations. The ACCC regulates advertising and health claims for candy products, especially those targeting children. The government supports research into sugar alternatives and healthier candy formulations. Environmental guidelines encourage the use of sustainable packaging for candy products.
Key Highlights of the Report:
- Australia Non-Chocolate Candy Market Outlook
- Market Size of Australia Non-Chocolate Candy Market, 2025
- Forecast of Australia Non-Chocolate Candy Market, 2032
- Historical Data and Forecast of Australia Non-Chocolate Candy Revenues & Volume for the Period 2022 - 2032F
- Australia Non-Chocolate Candy Market Trend Evolution
- Australia Non-Chocolate Candy Market Drivers and Challenges
- Australia Non-Chocolate Candy Price Trends
- Australia Non-Chocolate Candy Porter's Five Forces
- Australia Non-Chocolate Candy Industry Life Cycle
- Historical Data and Forecast of Australia Non-Chocolate Candy Market Revenues & Volume By Type for the Period 2022 - 2032F
- Historical Data and Forecast of Australia Non-Chocolate Candy Market Revenues & Volume By Hard type for the Period 2022 - 2032F
- Historical Data and Forecast of Australia Non-Chocolate Candy Market Revenues & Volume By Chewing type for the Period 2022 - 2032F
- Historical Data and Forecast of Australia Non-Chocolate Candy Market Revenues & Volume By Scotch type for the Period 2022 - 2032F
- Historical Data and Forecast of Australia Non-Chocolate Candy Market Revenues & Volume By Distribution channel for the Period 2022 - 2032F
- Historical Data and Forecast of Australia Non-Chocolate Candy Market Revenues & Volume By Supermarkets/Hypermarkets for the Period 2022 - 2032F
- Historical Data and Forecast of Australia Non-Chocolate Candy Market Revenues & Volume By Specialist Stores for the Period 2022 - 2032F
- Historical Data and Forecast of Australia Non-Chocolate Candy Market Revenues & Volume By Convenience Stores for the Period 2022 - 2032F
- Historical Data and Forecast of Australia Non-Chocolate Candy Market Revenues & Volume By Online Stores for the Period 2022 - 2032F
- Historical Data and Forecast of Australia Non-Chocolate Candy Market Revenues & Volume By Others for the Period 2022 - 2032F
- Australia Non-Chocolate Candy Import Export Trade Statistics
- Market Opportunity Assessment By Type
- Market Opportunity Assessment By Distribution channel
- Australia Non-Chocolate Candy Top Companies Market Share
- Australia Non-Chocolate Candy Competitive Benchmarking By Technical and Operational Parameters
- Australia Non-Chocolate Candy Company Profiles
- Australia Non-Chocolate Candy Key Strategic Recommendations
Australia Non-Chocolate Candy Market (2026-2032): FAQs
6Wresearch actively monitors the Australia Non-Chocolate Candy Market and publishes its comprehensive annual report, highlighting emerging trends, growth drivers, revenue analysis, and forecast outlook. Our insights help businesses to make data-backed strategic decisions with ongoing market dynamics. Our analysts track relevent industries related to the Australia Non-Chocolate Candy Market, allowing our clients with actionable intelligence and reliable forecasts tailored to emerging regional needs.
Yes, we provide customisation as per your requirements. To learn more, feel free to contact us on sales@6wresearch.com
1 Executive Summary |
2 Introduction |
2.1 Key Highlights of the Report |
2.2 Report Description |
2.3 Market Scope & Segmentation |
2.4 Research Methodology |
2.5 Assumptions |
3 Australia Non-Chocolate Candy Market Overview |
3.1 Australia Country Macro Economic Indicators |
3.2 Australia Non-Chocolate Candy Market Revenues & Volume, 2022 & 2032F |
3.3 Australia Non-Chocolate Candy Market - Industry Life Cycle |
3.4 Australia Non-Chocolate Candy Market - Porter's Five Forces |
3.5 Australia Non-Chocolate Candy Market Revenues & Volume Share, By Type, 2022 & 2032F |
3.6 Australia Non-Chocolate Candy Market Revenues & Volume Share, By Distribution channel, 2022 & 2032F |
4 Australia Non-Chocolate Candy Market Dynamics |
4.1 Impact Analysis |
4.2 Market Drivers |
4.2.1 Increasing consumer preference for healthier snack options |
4.2.2 Growing demand for sugar-free and natural ingredient candies |
4.2.3 Rising disposable income leading to higher spending on confectionery products |
4.3 Market Restraints |
4.3.1 Health concerns related to high sugar consumption |
4.3.2 Competition from chocolate candies and other sweet snacks in the market |
5 Australia Non-Chocolate Candy Market Trends |
6 Australia Non-Chocolate Candy Market, By Types |
6.1 Australia Non-Chocolate Candy Market, By Type |
6.1.1 Overview and Analysis |
6.1.2 Australia Non-Chocolate Candy Market Revenues & Volume, By Type, 2022 - 2032F |
6.1.3 Australia Non-Chocolate Candy Market Revenues & Volume, By Hard type, 2022 - 2032F |
6.1.4 Australia Non-Chocolate Candy Market Revenues & Volume, By Chewing type, 2022 - 2032F |
6.1.5 Australia Non-Chocolate Candy Market Revenues & Volume, By Scotch type, 2022 - 2032F |
6.2 Australia Non-Chocolate Candy Market, By Distribution channel |
6.2.1 Overview and Analysis |
6.2.2 Australia Non-Chocolate Candy Market Revenues & Volume, By Supermarkets/Hypermarkets, 2022 - 2032F |
6.2.3 Australia Non-Chocolate Candy Market Revenues & Volume, By Specialist Stores, 2022 - 2032F |
6.2.4 Australia Non-Chocolate Candy Market Revenues & Volume, By Convenience Stores, 2022 - 2032F |
6.2.5 Australia Non-Chocolate Candy Market Revenues & Volume, By Online Stores, 2022 - 2032F |
6.2.6 Australia Non-Chocolate Candy Market Revenues & Volume, By Others, 2022 - 2032F |
7 Australia Non-Chocolate Candy Market Import-Export Trade Statistics |
7.1 Australia Non-Chocolate Candy Market Export to Major Countries |
7.2 Australia Non-Chocolate Candy Market Imports from Major Countries |
8 Australia Non-Chocolate Candy Market Key Performance Indicators |
8.1 Consumer engagement through social media platforms |
8.2 Percentage of sales from new product launches |
8.3 Customer retention rate through loyalty programs |
8.4 Market penetration in regional areas |
8.5 Growth in demand for sugar-free and natural ingredient candies |
9 Australia Non-Chocolate Candy Market - Opportunity Assessment |
9.1 Australia Non-Chocolate Candy Market Opportunity Assessment, By Type, 2022 & 2032F |
9.2 Australia Non-Chocolate Candy Market Opportunity Assessment, By Distribution channel, 2022 & 2032F |
10 Australia Non-Chocolate Candy Market - Competitive Landscape |
10.1 Australia Non-Chocolate Candy Market Revenue Share, By Companies, 2025 |
10.2 Australia Non-Chocolate Candy Market Competitive Benchmarking, By Operating and Technical Parameters |
11 Company Profiles |
12 Recommendations |
13 Disclaimer |
Global Go To Market Strategy - 2030
Export potential enables firms to identify high-growth global markets with greater confidence by combining advanced trade intelligence with a structured quantitative methodology. The framework analyzes emerging demand trends and country-level import patterns while integrating macroeconomic and trade datasets such as GDP and population forecasts, bilateral import–export flows, tariff structures, elasticity differentials between developed and developing economies, geographic distance, and import demand projections. Using weighted trade values from 2020–2024 as the base period to project country-to-country export potential for 2030, these inputs are operationalized through calculated drivers such as gravity model parameters, tariff impact factors, and projected GDP per-capita growth. Through an analysis of hidden potentials, demand hotspots, and market conditions that are most favorable to success, this method enables firms to focus on target countries, maximize returns, and global expansion with data, backed by accuracy.
By factoring in the projected importer demand gap that is currently unmet and could be potential opportunity, it identifies the potential for the Exporter (Country) among 190 countries, against the general trade analysis, which identifies the biggest importer or exporter.
To discover high-growth global markets and optimize your business strategy:
Click Here
Pricing
- Single User License$ 1,995
- Department License$ 2,400
- Site License$ 3,120
- Global License$ 3,795

Leadership Perspectives from Industry Events
Search
Thought Leadership and Analyst Meet


Our Clients
6WResearch In News
- Doha a strategic location for EV manufacturing hub: IPA Qatar
- Demand for luxury TVs surging in the GCC, says Samsung
- Empowering Growth: The Thriving Journey of Bangladesh’s Cable Industry
- Demand for luxury TVs surging in the GCC, says Samsung
- Video call with a traditional healer? Once unthinkable, it’s now common in South Africa
- Intelligent Buildings To Smooth GCC’s Path To Net Zero
Latest Reports
- Taiwan Airport Wireless Infrastructure Market (2026-2032)
- Vietnam Airport Wireless Infrastructure Market (2026-2032)
- Thailand Airport Wireless Infrastructure Market (2026-2032)
- South Korea Airport Wireless Infrastructure Market (2026-2032)
- Romania Airport Wireless Infrastructure Market (2026-2032)
- Qatar Airport Wireless Infrastructure Market (2026-2032)
- Philippines Airport Wireless Infrastructure Market (2026-2032)
- Japan Airport Wireless Infrastructure Market (2026-2032)
- Taiwan Airport Winter Services Market (2026-2032)
- Vietnam Airport Winter Services Market (2026-2032)
Industry Events and Analyst Meet

HIMTEX 2026

India Refining Summit 2026

India EV Show 2026

EV tech India Expo 2026

Auto Tech Asia 2026
Whitepaper
- Middle East & Africa Commercial Security Market Click here to view more.
- Middle East & Africa Fire Safety Systems & Equipment Market Click here to view more.
- GCC Drone Market Click here to view more.
- Middle East Lighting Fixture Market Click here to view more.
- GCC Physical & Perimeter Security Market Click here to view more.