Australia Orphan Drugs Market (2026-2032) Outlook | Share, Growth, Industry, Forecast, Value, Companies, Revenue, Analysis, Trends & Size
Market Forecast By Drugs (Revlimid, Rituxan, Opdivo, Keytruda, Imbruvica, Soliris, Other Orphan Drugs), By Drug Type (Biologics, Non-Biologics), By Therapy Class (Oncology, Blood, Endocrine, Central Nervous Systems, Cardiovascular, Respiratory) And Competitive Landscape
| Product Code: ETC070134 | Publication Date: Jun 2021 | Updated Date: Jun 2026 | Product Type: Report | |
| Publisher: 6Wresearch | Author: Ravi Bhandari | No. of Pages: 70 | No. of Figures: 35 | No. of Tables: 5 |
Australia Orphan Drugs Market Size, Share & Growth Rate
The Australia Orphan Drugs Market was estimated at USD 225 Million in 2025 and is projected to reach USD 265 Million by 2032, growing at a CAGR of 2.4% from 2026 to 2032. This anticipated growth can be attributed to a rising prevalence of rare diseases coupled with increased government incentives for the development of orphan drugs. Furthermore, advancements in biotechnology and enhanced diagnostic capabilities are significantly contributing to the market's upward trajectory, addressing previously unmet medical needs.
Australia Orphan Drugs Market Year-wise Growth Rate and Key Drivers
This graph highlights how the Australia Orphan Drugs Market has steadily grown over the years, supported by major growth factors.
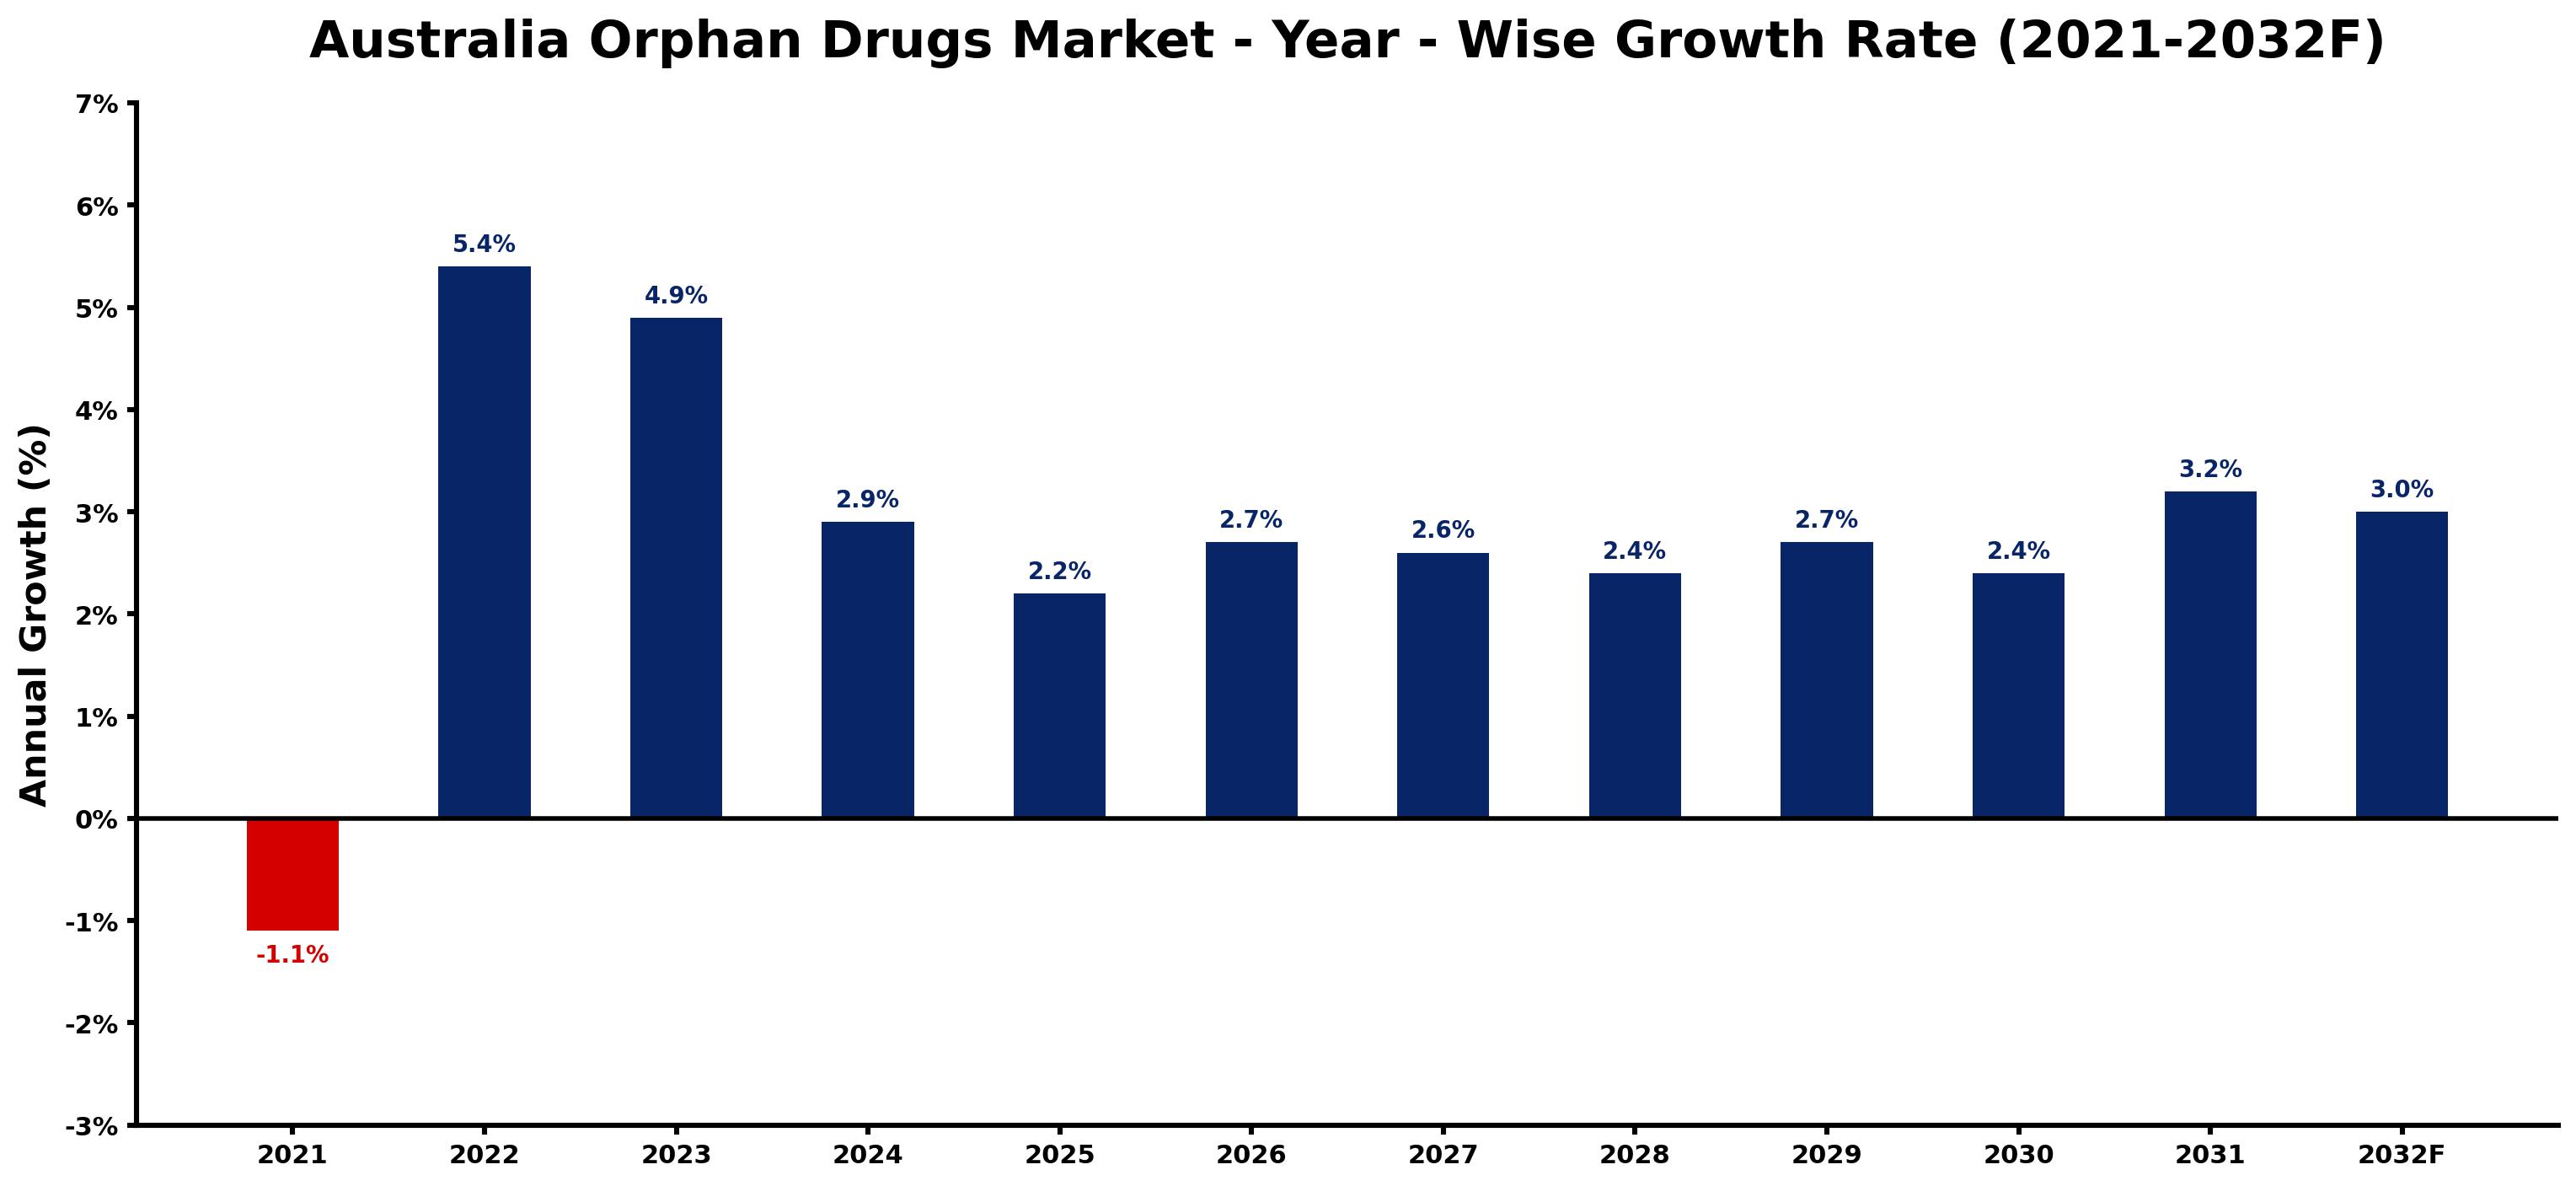
The table below presents the year‑wise growth rates along with the key drivers influencing the market
| Year | Growth Rate | Major Drivers |
| 2021 | -1.1% | Rapid growth in telecom and data center sectors |
| 2022 | 5.4% | Expansion of manufacturing activities |
| 2023 | 4.9% | Expansion of commercial construction activities |
| 2024 | 2.9% | Increasing adoption of advanced technologies |
| 2025 | 2.2% | Government infrastructure modernization initiatives |
| 2026 | 2.7% | Increasing smart city development projects |
| 2027 | 2.6% | Increasing industrial automation investments |
| 2028 | 2.4% | Increasing adoption of advanced technologies |
| 2029 | 2.7% | Growing renewable energy integration projects |
| 2030 | 2.4% | Growing urbanization and commercial development |
| 2031 | 3.2% | Growing urbanization and commercial development |
| 2032 | 3.0% | Expansion of transportation and logistics networks |
Note - Market size estimations and growth projections presented in this report are based on 6Wresearch’s advanced forecasting approach, validated with industry datasets as of June 2026.
Australia Orphan Drugs Market Synopsis
The Australia Orphan Drugs Market is currently experiencing positive momentum driven by heightened awareness of rare diseases and proactive governmental measures. This energy is translating into increased investments in research and development, as pharmaceutical companies seek to capitalize on the opportunities presented by this specialized segment.
Looking ahead, the market is poised for further expansion. Continued regulatory support, along with the ongoing commitment of biotech firms to innovate, positions Australia as a promising landscape for orphan drug development. However, the market must navigate challenges such as high development costs and regulatory hurdles that could impact its growth.
Australia Orphan Drugs Market Key Takeaways
- The Australian orphan drugs sector is backed by strong government incentives, promoting R&D for rare diseases.
- Technological advancements in biotechnology are paving the way for innovative orphan drug therapies.
- Regulatory frameworks are evolving to support faster approvals and market access for orphan drugs.
- Investment opportunities exist in emerging biotech startups focusing on rare disease treatments.
- Heightened awareness and improved diagnostics are driving patient demand for orphan medications.
Evaluation of Restraints in Australia Orphan Drugs Market
Despite its growth prospects, the Australia Orphan Drugs Market faces significant restraints. High drug development costs remain a persistent issue, limiting the ability of many pharmaceutical companies to invest in rare disease treatments. Moreover, the small patient populations associated with these conditions often lead to a challenging economic model for developers. Compounded by slow regulatory approval processes, these factors create barriers to entry that can stifle innovation and market expansion.
Australia Orphan Drugs Market Trends
Several current and emerging trends are shaping the Australia Orphan Drugs Market. The integration of artificial intelligence in clinical trials is gaining traction, enabling more efficient patient recruitment and data analysis. Additionally, collaborations between biotech firms and academic institutions are becoming commonplace, fostering a robust pipeline of innovative therapies. As patient advocacy groups grow more influential, there is a push for greater awareness and funding, further driving demand for orphan drugs.
Australia Orphan Drugs Market Opportunities
Significant investment opportunities lie in biotech startups focused on developing therapies for rare diseases. The Australian government’s initiatives, including grants and the Orphan Drug Program, enhance the market's appeal for investors. Additionally, partnerships between pharmaceutical companies for collaborative drug development are emerging as a strategic avenue for navigating the high costs associated with orphan drug research, positioning these collaborations as potential growth catalysts.
Government Initiatives in the Australia Orphan Drugs Market
The Australian government plays a vital role in the orphan drugs landscape through various supportive initiatives. The Orphan Drug Program provides essential incentives for companies engaged in developing treatments for rare diseases, including streamlined regulatory processes and financial benefits. The Therapeutic Goods Administration (TGA) has established guidelines to facilitate expedited approval pathways for orphan drugs, enhancing patient access to critical therapies and underscoring the government’s commitment to addressing unmet medical needs.
Future Insights of the Australia Orphan Drugs Market
As we look toward 2026-2032, the Australia Orphan Drugs Market is expected to evolve significantly. The combination of favorable regulatory frameworks, increasing investments in R&D, and rising patient advocacy will likely drive market growth. Enhanced focus on personalized medicine and innovative treatment modalities will further shape the future landscape, ensuring that rare disease therapies remain a focal point of the pharmaceutical industry in Australia.
Australia Orphan Drugs Market Latest Developments (May 2025 - June 2026)
Recent developments in the Australia Orphan Drugs Market indicate a growing emphasis on collaborative frameworks between academic and industry stakeholders. This partnership approach is facilitating innovation and accelerating the path to market for promising orphan therapies. Additionally, there has been a notable increase in public awareness campaigns aimed at rare diseases, further boosting engagement and interest in treatment options.
Australia Orphan Drugs Market - Key Attractiveness of the Report
- 10 Years of Market Numbers
- Historical Data Starting from 2022 to 2025
- Base Year: 2025
- Forecast Data until 2032
- Key Performance Indicators Impacting the Market
- Major Upcoming Developments and Projects
Key Highlights of the Report:
- Australia Orphan Drugs Market Outlook
- Market Size of Australia Orphan Drugs Market, 2025
- Forecast of Australia Orphan Drugs Market, 2032
- Historical Data and Forecast of Australia Orphan Drugs Revenues & Volume for the Period 2022-2032F
- Australia Orphan Drugs Market Trend Evolution
- Australia Orphan Drugs Market Drivers and Challenges
- Australia Orphan Drugs Price Trends
- Australia Orphan Drugs Porter's Five Forces
- Australia Orphan Drugs Industry Life Cycle
- Historical Data and Forecast of Australia Orphan Drugs Market Revenues & Volume By Drugs for the Period 2022-2032F
- Historical Data and Forecast of Australia Orphan Drugs Market Revenues & Volume By Revlimid for the Period 2022-2032F
- Historical Data and Forecast of Australia Orphan Drugs Market Revenues & Volume By Rituxan for the Period 2022-2032F
- Historical Data and Forecast of Australia Orphan Drugs Market Revenues & Volume By Opdivo for the Period 2022-2032F
- Historical Data and Forecast of Australia Orphan Drugs Market Revenues & Volume By Keytruda for the Period 2022-2032F
- Historical Data and Forecast of Australia Orphan Drugs Market Revenues & Volume By Imbruvica for the Period 2022-2032F
- Historical Data and Forecast of Australia Orphan Drugs Market Revenues & Volume By Soliris for the Period 2022-2032F
- Historical Data and Forecast of Australia Orphan Drugs Market Revenues & Volume By Other Orphan Drugs for the Period 2022-2032F
- Historical Data and Forecast of Australia Orphan Drugs Market Revenues & Volume By Drug Type for the Period 2022-2032F
- Historical Data and Forecast of Australia Orphan Drugs Market Revenues & Volume By Biologics for the Period 2022-2032F
- Historical Data and Forecast of Australia Orphan Drugs Market Revenues & Volume By Non-Biologics for the Period 2022-2032F
- Historical Data and Forecast of Australia Orphan Drugs Market Revenues & Volume By Therapy Class for the Period 2022-2032F
- Historical Data and Forecast of Australia Orphan Drugs Market Revenues & Volume By Oncology for the Period 2022-2032F
- Historical Data and Forecast of Australia Orphan Drugs Market Revenues & Volume By Blood for the Period 2022-2032F
- Historical Data and Forecast of Australia Orphan Drugs Market Revenues & Volume By Endocrine for the Period 2022-2032F
- Historical Data and Forecast of Australia Orphan Drugs Market Revenues & Volume By Central Nervous Systems for the Period 2022-2032F
- Historical Data and Forecast of Australia Orphan Drugs Market Revenues & Volume By Cardiovascular for the Period 2022-2032F
- Historical Data and Forecast of Australia Orphan Drugs Market Revenues & Volume By Respiratory for the Period 2022-2032F
- Australia Orphan Drugs Import Export Trade Statistics
- Market Opportunity Assessment By Drugs
- Market Opportunity Assessment By Drug Type
- Market Opportunity Assessment By Therapy Class
- Australia Orphan Drugs Top Companies Market Share
- Australia Orphan Drugs Competitive Benchmarking By Technical and Operational Parameters
- Australia Orphan Drugs Company Profiles
- Australia Orphan Drugs Key Strategic Recommendations
Australia Orphan Drugs Market - Frequently Asked Questions
Key growth factors include rising prevalence of rare diseases, increasing government incentives, and advancements in biotechnology that enable the development of innovative therapies.
The Australia Orphan Drugs Market was estimated at USD 225 Million in 2025 and is projected to reach USD 265 Million by 2032, growing at a CAGR of 2.4% from 2026 to 2032.
Investments are primarily flowing towards biotech startups focused on developing orphan therapies, as well as established pharmaceutical companies partnering with academic institutions to share resources and expertise.
The Australian government actively supports orphan drug development through programs that provide financial incentives, streamline regulatory processes, and enhance patient access to treatments.
Companies encounter high development costs, small patient populations, and slow regulatory approvals, which collectively challenge the sustainability of investments in this sector.
6Wresearch actively monitors the Australia Orphan Drugs Market and publishes its comprehensive annual report, highlighting emerging trends, growth drivers, revenue analysis, and forecast outlook. Our insights help businesses to make data-backed strategic decisions with ongoing market dynamics. Our analysts track relevent industries related to the Australia Orphan Drugs Market, allowing our clients with actionable intelligence and reliable forecasts tailored to emerging regional needs.
Yes, we provide customisation as per your requirements. To learn more, feel free to contact us on sales@6wresearch.com
1 Executive Summary |
2 Introduction |
2.1 Key Highlights of the Report |
2.2 Report Description |
2.3 Market Scope & Segmentation |
2.4 Research Methodology |
2.5 Assumptions |
3 Australia Orphan Drugs Market Overview |
3.1 Australia Country Macro Economic Indicators |
3.2 Australia Orphan Drugs Market Revenues & Volume, 2022 & 2032F |
3.3 Australia Orphan Drugs Market - Industry Life Cycle |
3.4 Australia Orphan Drugs Market - Porter's Five Forces |
3.5 Australia Orphan Drugs Market Revenues & Volume Share, By Drugs, 2022 & 2032F |
3.6 Australia Orphan Drugs Market Revenues & Volume Share, By Drug Type, 2022 & 2032F |
3.7 Australia Orphan Drugs Market Revenues & Volume Share, By Therapy Class, 2022 & 2032F |
4 Australia Orphan Drugs Market Dynamics |
4.1 Impact Analysis |
4.2 Market Drivers |
4.2.1 Increasing prevalence of rare diseases in Australia |
4.2.2 Government initiatives and policies supporting orphan drug development and access |
4.2.3 Growing healthcare expenditure and focus on personalized medicine |
4.3 Market Restraints |
4.3.1 High costs associated with orphan drugs development and pricing |
4.3.2 Limited patient population for orphan drugs |
4.3.3 Stringent regulations and lengthy approval processes for orphan drugs |
5 Australia Orphan Drugs Market Trends |
6 Australia Orphan Drugs Market, By Types |
6.1 Australia Orphan Drugs Market, By Drugs |
6.1.1 Overview and Analysis |
6.1.2 Australia Orphan Drugs Market Revenues & Volume, By Drugs, 2022-2032F |
6.1.3 Australia Orphan Drugs Market Revenues & Volume, By Revlimid, 2022-2032F |
6.1.4 Australia Orphan Drugs Market Revenues & Volume, By Rituxan, 2022-2032F |
6.1.5 Australia Orphan Drugs Market Revenues & Volume, By Opdivo, 2022-2032F |
6.1.6 Australia Orphan Drugs Market Revenues & Volume, By Keytruda, 2022-2032F |
6.1.7 Australia Orphan Drugs Market Revenues & Volume, By Imbruvica, 2022-2032F |
6.1.8 Australia Orphan Drugs Market Revenues & Volume, By Soliris, 2022-2032F |
6.2 Australia Orphan Drugs Market, By Drug Type |
6.2.1 Overview and Analysis |
6.2.2 Australia Orphan Drugs Market Revenues & Volume, By Biologics, 2022-2032F |
6.2.3 Australia Orphan Drugs Market Revenues & Volume, By Non-Biologics, 2022-2032F |
6.3 Australia Orphan Drugs Market, By Therapy Class |
6.3.1 Overview and Analysis |
6.3.2 Australia Orphan Drugs Market Revenues & Volume, By Oncology, 2022-2032F |
6.3.3 Australia Orphan Drugs Market Revenues & Volume, By Blood, 2022-2032F |
6.3.4 Australia Orphan Drugs Market Revenues & Volume, By Endocrine, 2022-2032F |
6.3.5 Australia Orphan Drugs Market Revenues & Volume, By Central Nervous Systems, 2022-2032F |
6.3.6 Australia Orphan Drugs Market Revenues & Volume, By Cardiovascular, 2022-2032F |
6.3.7 Australia Orphan Drugs Market Revenues & Volume, By Respiratory, 2022-2032F |
7 Australia Orphan Drugs Market Import-Export Trade Statistics |
7.1 Australia Orphan Drugs Market Export to Major Countries |
7.2 Australia Orphan Drugs Market Imports from Major Countries |
8 Australia Orphan Drugs Market Key Performance Indicators |
8.1 Number of orphan drugs approved for use in Australia |
8.2 Patient access and affordability of orphan drugs |
8.3 Adoption rate of precision medicine approaches in treating rare diseases |
9 Australia Orphan Drugs Market - Opportunity Assessment |
9.1 Australia Orphan Drugs Market Opportunity Assessment, By Drugs, 2022 & 2032F |
9.2 Australia Orphan Drugs Market Opportunity Assessment, By Drug Type, 2022 & 2032F |
9.3 Australia Orphan Drugs Market Opportunity Assessment, By Therapy Class, 2022 & 2032F |
10 Australia Orphan Drugs Market - Competitive Landscape |
10.1 Australia Orphan Drugs Market Revenue Share, By Companies, 2025 |
10.2 Australia Orphan Drugs Market Competitive Benchmarking, By Operating and Technical Parameters |
11 Company Profiles |
12 Recommendations |
13 Disclaimer |
Global Go To Market Strategy - 2030
Export potential enables firms to identify high-growth global markets with greater confidence by combining advanced trade intelligence with a structured quantitative methodology. The framework analyzes emerging demand trends and country-level import patterns while integrating macroeconomic and trade datasets such as GDP and population forecasts, bilateral import–export flows, tariff structures, elasticity differentials between developed and developing economies, geographic distance, and import demand projections. Using weighted trade values from 2020–2024 as the base period to project country-to-country export potential for 2030, these inputs are operationalized through calculated drivers such as gravity model parameters, tariff impact factors, and projected GDP per-capita growth. Through an analysis of hidden potentials, demand hotspots, and market conditions that are most favorable to success, this method enables firms to focus on target countries, maximize returns, and global expansion with data, backed by accuracy.
By factoring in the projected importer demand gap that is currently unmet and could be potential opportunity, it identifies the potential for the Exporter (Country) among 190 countries, against the general trade analysis, which identifies the biggest importer or exporter.
To discover high-growth global markets and optimize your business strategy:
Click Here
Pricing
- Single User License$ 1,995
- Department License$ 2,400
- Site License$ 3,120
- Global License$ 3,795

Leadership Perspectives from Industry Events
Search
Thought Leadership and Analyst Meet


Our Clients
6WResearch In News
- India Air Conditioner Market Set for Strong Rebound in 2026 After Weather-Led Correction and GST-Driven Recovery: 6Wresearch
- ADAS in India: How Automatic Emergency Braking, Blind Spot Detection & Driver Monitoring are Transforming Road Safety
- Doha a strategic location for EV manufacturing hub: IPA Qatar
- Demand for luxury TVs surging in the GCC, says Samsung
- Empowering Growth: The Thriving Journey of Bangladesh’s Cable Industry
- Demand for luxury TVs surging in the GCC, says Samsung
Latest Reports
- Nicaragua RPG Gaming Market (2026-2032)
- New Zealand RPG Gaming Market (2026-2032)
- Netherlands RPG Gaming Market (2026-2032)
- Nauru RPG Gaming Market (2026-2032)
- Namibia RPG Gaming Market (2026-2032)
- Mozambique RPG Gaming Market (2026-2032)
- Montenegro RPG Gaming Market (2026-2032)
- Mongolia RPG Gaming Market (2026-2032)
- Monaco RPG Gaming Market (2026-2032)
- Micronesia RPG Gaming Market (2026-2032)
Industry Events and Analyst Meet

EV India Expo 2026

HIMTEX 2026

India Refining Summit 2026

India EV Show 2026

EV tech India Expo 2026
Whitepaper
- Middle East & Africa Commercial Security Market Click here to view more.
- Middle East & Africa Fire Safety Systems & Equipment Market Click here to view more.
- GCC Drone Market Click here to view more.
- Middle East Lighting Fixture Market Click here to view more.
- GCC Physical & Perimeter Security Market Click here to view more.