Australia Plastisols Market (2026-2032) Outlook | Trends, Industry, Size, Analysis, Revenue, Share, Value, Forecast, Companies & Growth
Market Forecast By Application (Coatings, Moldings, Screen Printing, Adhesives & Sealants), By End Use Industry (Textile, Construction, Transportation, Metal Finishing, Defense, Others) And Competitive Landscape
| Product Code: ETC4479636 | Publication Date: Jul 2023 | Updated Date: Mar 2026 | Product Type: Report | |
| Publisher: 6Wresearch | Author: Dhaval Chaurasia | No. of Pages: 85 | No. of Figures: 45 | No. of Tables: 25 |
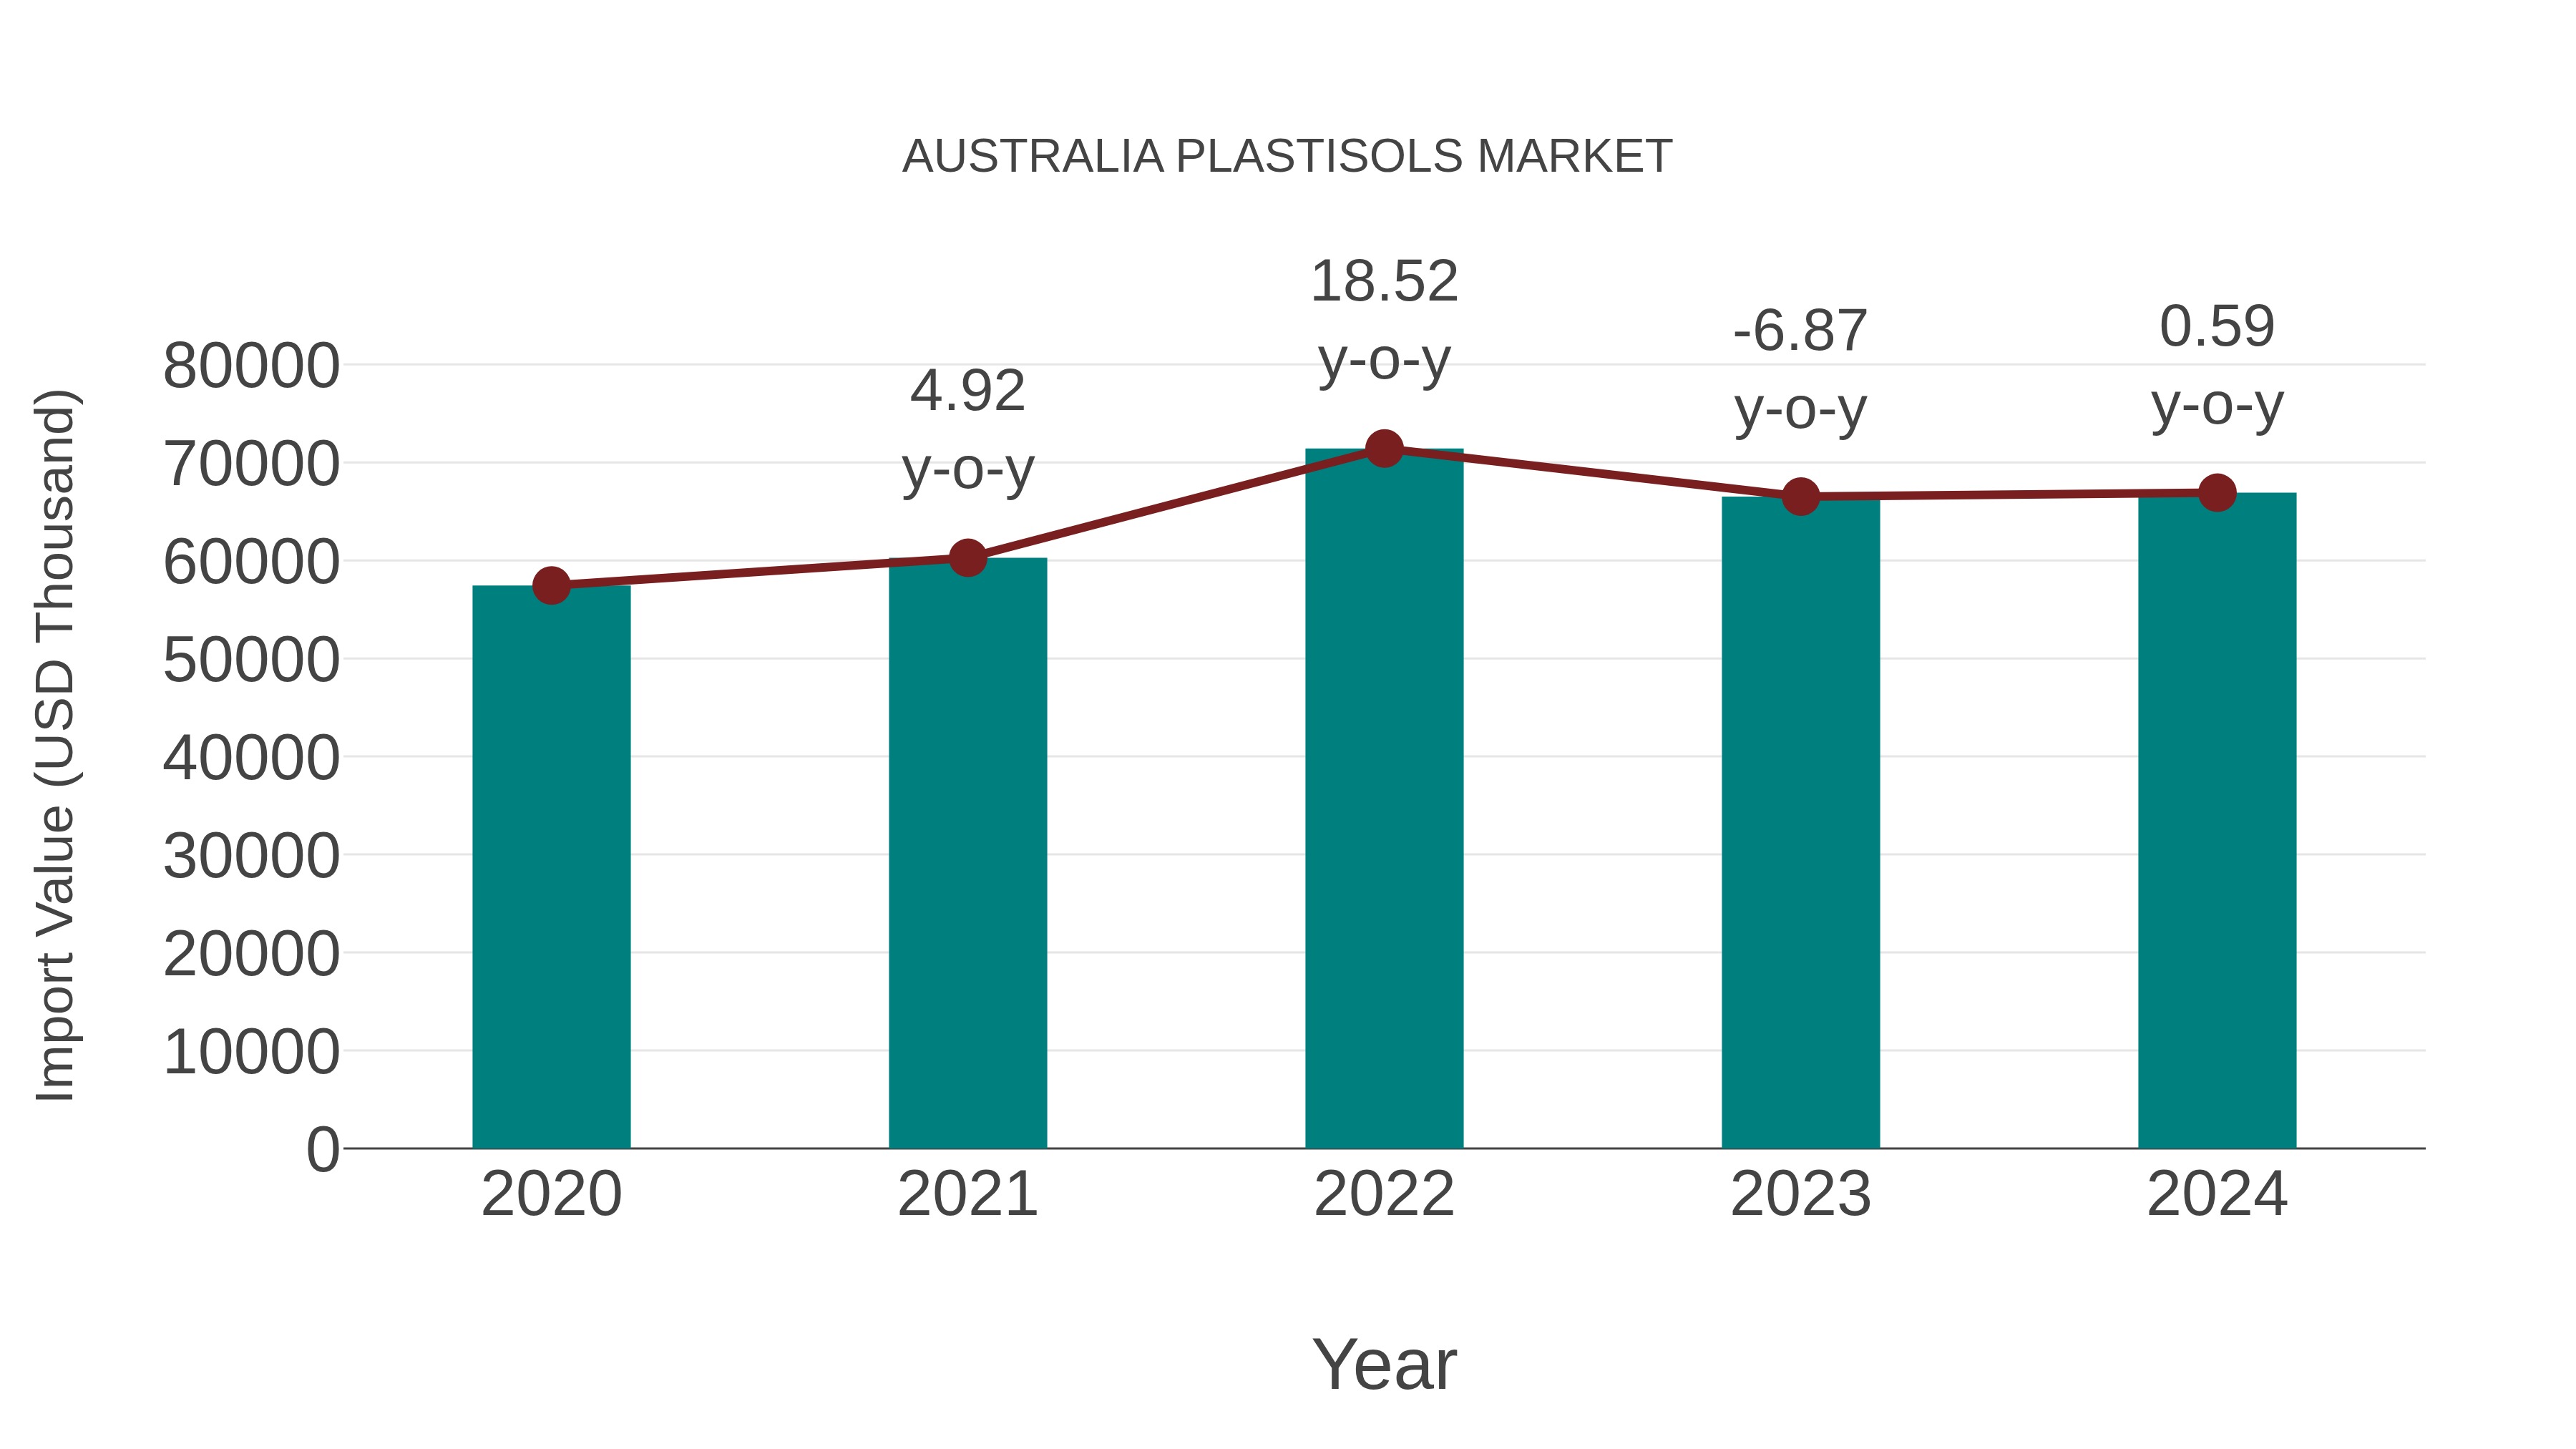
Australia Plastisols Market: Import Trend Analysis
Australia`s import trend for the plastisols market saw a growth rate of 0.59% from 2023 to 2024, with a compound annual growth rate (CAGR) of 3.89% from 2020 to 2024. This slight increase in import momentum could be attributed to evolving demand dynamics or shifts in market stability during the period.
Australia Plastisols Market Overview
Australias plastisols market is growing with increasing applications in coatings, inks, and flexible PVC manufacturing. Innovations in heat-curable liquid resins are enhancing product durability, adhesion, and environmental sustainability, making them ideal for industrial and consumer applications.
Drivers of the market
The plastisols market in Australia is growing due to increasing demand for coatings, sealants, and adhesives in automotive, construction, and textile industries. Rising adoption of plastisols for improving product durability, chemical resistance, and flexibility is driving market growth. Enhanced focus on developing low-VOC and environmentally friendly plastisols is supporting market expansion.
Challenges of the market
The plastisols market in Australia is challenged by environmental regulations related to the use of PVC and plasticizers, which limit product formulation options. High production costs and the complexity of ensuring adhesion and flexibility in various applications increase operational challenges. Competition from water-based and solvent-free coating solutions adds further pressure on market growth.
Investment opportunities in the Market
The Australia Plastisols Market presents growth opportunities due to increasing use in automotive and textile industries. Investment opportunities include developing eco-friendly plastisols, improving heat resistance, and expanding into coatings and adhesives sectors.
Government Policy of the market
Plastisols used in coatings and textile printing are regulated under the AICIS. Manufacturers and importers must register plastisol products and disclose their chemical composition. The use of hazardous chemicals in plastisols is restricted under the Hazardous Substances Information System (HSIS).
Key Highlights of the Report:
- Australia Plastisols Market Outlook
- Market Size of Australia Plastisols Market, 2025
- Forecast of Australia Plastisols Market, 2032
- Historical Data and Forecast of Australia Plastisols Revenues & Volume for the Period 2022-2032F
- Australia Plastisols Market Trend Evolution
- Australia Plastisols Market Drivers and Challenges
- Australia Plastisols Price Trends
- Australia Plastisols Porter's Five Forces
- Australia Plastisols Industry Life Cycle
- Historical Data and Forecast of Australia Plastisols Market Revenues & Volume By Application for the Period 2022-2032F
- Historical Data and Forecast of Australia Plastisols Market Revenues & Volume By Coatings for the Period 2022-2032F
- Historical Data and Forecast of Australia Plastisols Market Revenues & Volume By Moldings for the Period 2022-2032F
- Historical Data and Forecast of Australia Plastisols Market Revenues & Volume By Screen Printing for the Period 2022-2032F
- Historical Data and Forecast of Australia Plastisols Market Revenues & Volume By Adhesives & Sealants for the Period 2022-2032F
- Historical Data and Forecast of Australia Plastisols Market Revenues & Volume By End Use Industry for the Period 2022-2032F
- Historical Data and Forecast of Australia Plastisols Market Revenues & Volume By Textile for the Period 2022-2032F
- Historical Data and Forecast of Australia Plastisols Market Revenues & Volume By Construction for the Period 2022-2032F
- Historical Data and Forecast of Australia Plastisols Market Revenues & Volume By Transportation for the Period 2022-2032F
- Historical Data and Forecast of Australia Plastisols Market Revenues & Volume By Metal Finishing for the Period 2022-2032F
- Historical Data and Forecast of Australia Plastisols Market Revenues & Volume By Defense for the Period 2022-2032F
- Historical Data and Forecast of Australia Plastisols Market Revenues & Volume By Others for the Period 2022-2032F
- Australia Plastisols Import Export Trade Statistics
- Market Opportunity Assessment By Application
- Market Opportunity Assessment By End Use Industry
- Australia Plastisols Top Companies Market Share
- Australia Plastisols Competitive Benchmarking By Technical and Operational Parameters
- Australia Plastisols Company Profiles
- Australia Plastisols Key Strategic Recommendations
Australia Plastisols Market (2026-2032): FAQs
6Wresearch actively monitors the Australia Plastisols Market and publishes its comprehensive annual report, highlighting emerging trends, growth drivers, revenue analysis, and forecast outlook. Our insights help businesses to make data-backed strategic decisions with ongoing market dynamics. Our analysts track relevent industries related to the Australia Plastisols Market, allowing our clients with actionable intelligence and reliable forecasts tailored to emerging regional needs.
Yes, we provide customisation as per your requirements. To learn more, feel free to contact us on sales@6wresearch.com
1 Executive Summary |
2 Introduction |
2.1 Key Highlights of the Report |
2.2 Report Description |
2.3 Market Scope & Segmentation |
2.4 Research Methodology |
2.5 Assumptions |
3 Australia Plastisols Market Overview |
3.1 Australia Country Macro Economic Indicators |
3.2 Australia Plastisols Market Revenues & Volume, 2022 & 2032F |
3.3 Australia Plastisols Market - Industry Life Cycle |
3.4 Australia Plastisols Market - Porter's Five Forces |
3.5 Australia Plastisols Market Revenues & Volume Share, By Application, 2022 & 2032F |
3.6 Australia Plastisols Market Revenues & Volume Share, By End Use Industry, 2022 & 2032F |
4 Australia Plastisols Market Dynamics |
4.1 Impact Analysis |
4.2 Market Drivers |
4.2.1 Growing demand for plastisols in industries such as automotive, construction, and textiles |
4.2.2 Increasing focus on sustainable and eco-friendly plastisols products |
4.2.3 Technological advancements in plastisols manufacturing processes |
4.3 Market Restraints |
4.3.1 Fluctuating prices of raw materials used in plastisols production |
4.3.2 Stringent regulations related to the use of certain chemicals in plastisols formulation |
4.3.3 Competition from alternative materials in the market |
5 Australia Plastisols Market Trends |
6 Australia Plastisols Market, By Types |
6.1 Australia Plastisols Market, By Application |
6.1.1 Overview and Analysis |
6.1.2 Australia Plastisols Market Revenues & Volume, By Application, 2022-2032F |
6.1.3 Australia Plastisols Market Revenues & Volume, By Coatings, 2022-2032F |
6.1.4 Australia Plastisols Market Revenues & Volume, By Moldings, 2022-2032F |
6.1.5 Australia Plastisols Market Revenues & Volume, By Screen Printing, 2022-2032F |
6.1.6 Australia Plastisols Market Revenues & Volume, By Adhesives & Sealants, 2022-2032F |
6.2 Australia Plastisols Market, By End Use Industry |
6.2.1 Overview and Analysis |
6.2.2 Australia Plastisols Market Revenues & Volume, By Textile, 2022-2032F |
6.2.3 Australia Plastisols Market Revenues & Volume, By Construction, 2022-2032F |
6.2.4 Australia Plastisols Market Revenues & Volume, By Transportation, 2022-2032F |
6.2.5 Australia Plastisols Market Revenues & Volume, By Metal Finishing, 2022-2032F |
6.2.6 Australia Plastisols Market Revenues & Volume, By Defense, 2022-2032F |
6.2.7 Australia Plastisols Market Revenues & Volume, By Others, 2022-2032F |
7 Australia Plastisols Market Import-Export Trade Statistics |
7.1 Australia Plastisols Market Export to Major Countries |
7.2 Australia Plastisols Market Imports from Major Countries |
8 Australia Plastisols Market Key Performance Indicators |
8.1 Research and development investment in eco-friendly plastisols formulations |
8.2 Adoption rate of new plastisols technologies in key industries |
8.3 Growth in demand for high-performance plastisols applications |
8.4 Market penetration of plastisols in emerging industries |
8.5 Customer satisfaction and loyalty metrics related to plastisols products |
9 Australia Plastisols Market - Opportunity Assessment |
9.1 Australia Plastisols Market Opportunity Assessment, By Application, 2022 & 2032F |
9.2 Australia Plastisols Market Opportunity Assessment, By End Use Industry, 2022 & 2032F |
10 Australia Plastisols Market - Competitive Landscape |
10.1 Australia Plastisols Market Revenue Share, By Companies, 2025 |
10.2 Australia Plastisols Market Competitive Benchmarking, By Operating and Technical Parameters |
11 Company Profiles |
12 Recommendations |
13 Disclaimer |
Global Go To Market Strategy - 2030
Export potential enables firms to identify high-growth global markets with greater confidence by combining advanced trade intelligence with a structured quantitative methodology. The framework analyzes emerging demand trends and country-level import patterns while integrating macroeconomic and trade datasets such as GDP and population forecasts, bilateral import–export flows, tariff structures, elasticity differentials between developed and developing economies, geographic distance, and import demand projections. Using weighted trade values from 2020–2024 as the base period to project country-to-country export potential for 2030, these inputs are operationalized through calculated drivers such as gravity model parameters, tariff impact factors, and projected GDP per-capita growth. Through an analysis of hidden potentials, demand hotspots, and market conditions that are most favorable to success, this method enables firms to focus on target countries, maximize returns, and global expansion with data, backed by accuracy.
By factoring in the projected importer demand gap that is currently unmet and could be potential opportunity, it identifies the potential for the Exporter (Country) among 190 countries, against the general trade analysis, which identifies the biggest importer or exporter.
To discover high-growth global markets and optimize your business strategy:
Click Here
Pricing
- Single User License$ 1,995
- Department License$ 2,400
- Site License$ 3,120
- Global License$ 3,795

Leadership Perspectives from Industry Events
Search
Thought Leadership and Analyst Meet


Our Clients
6WResearch In News
- Doha a strategic location for EV manufacturing hub: IPA Qatar
- Demand for luxury TVs surging in the GCC, says Samsung
- Empowering Growth: The Thriving Journey of Bangladesh’s Cable Industry
- Demand for luxury TVs surging in the GCC, says Samsung
- Video call with a traditional healer? Once unthinkable, it’s now common in South Africa
- Intelligent Buildings To Smooth GCC’s Path To Net Zero
Latest Reports
- Taiwan Airport Wireless Infrastructure Market (2026-2032)
- Vietnam Airport Wireless Infrastructure Market (2026-2032)
- Thailand Airport Wireless Infrastructure Market (2026-2032)
- South Korea Airport Wireless Infrastructure Market (2026-2032)
- Romania Airport Wireless Infrastructure Market (2026-2032)
- Qatar Airport Wireless Infrastructure Market (2026-2032)
- Philippines Airport Wireless Infrastructure Market (2026-2032)
- Japan Airport Wireless Infrastructure Market (2026-2032)
- Taiwan Airport Winter Services Market (2026-2032)
- Vietnam Airport Winter Services Market (2026-2032)
Industry Events and Analyst Meet

HIMTEX 2026

India Refining Summit 2026

India EV Show 2026

EV tech India Expo 2026

Auto Tech Asia 2026
Whitepaper
- Middle East & Africa Commercial Security Market Click here to view more.
- Middle East & Africa Fire Safety Systems & Equipment Market Click here to view more.
- GCC Drone Market Click here to view more.
- Middle East Lighting Fixture Market Click here to view more.
- GCC Physical & Perimeter Security Market Click here to view more.