Australia Polyphthalamide Market (2026-2032) Outlook | Industry, Forecast, Share, Value, Trends, Size, Growth, Companies, Analysis & Revenue
Market Forecast By Type (Unfilled, Mineral Filled, Glass Fiber Filled, Carbon Fiber Filled), By Application (Automotive, Electronics & Electricals, Industrial Equipment & Apparatus, Consumer & Personal Care, Others) And Competitive Landscape
| Product Code: ETC4502376 | Publication Date: Jul 2023 | Updated Date: Mar 2026 | Product Type: Report | |
| Publisher: 6Wresearch | Author: Dhaval Chaurasia | No. of Pages: 85 | No. of Figures: 45 | No. of Tables: 25 |
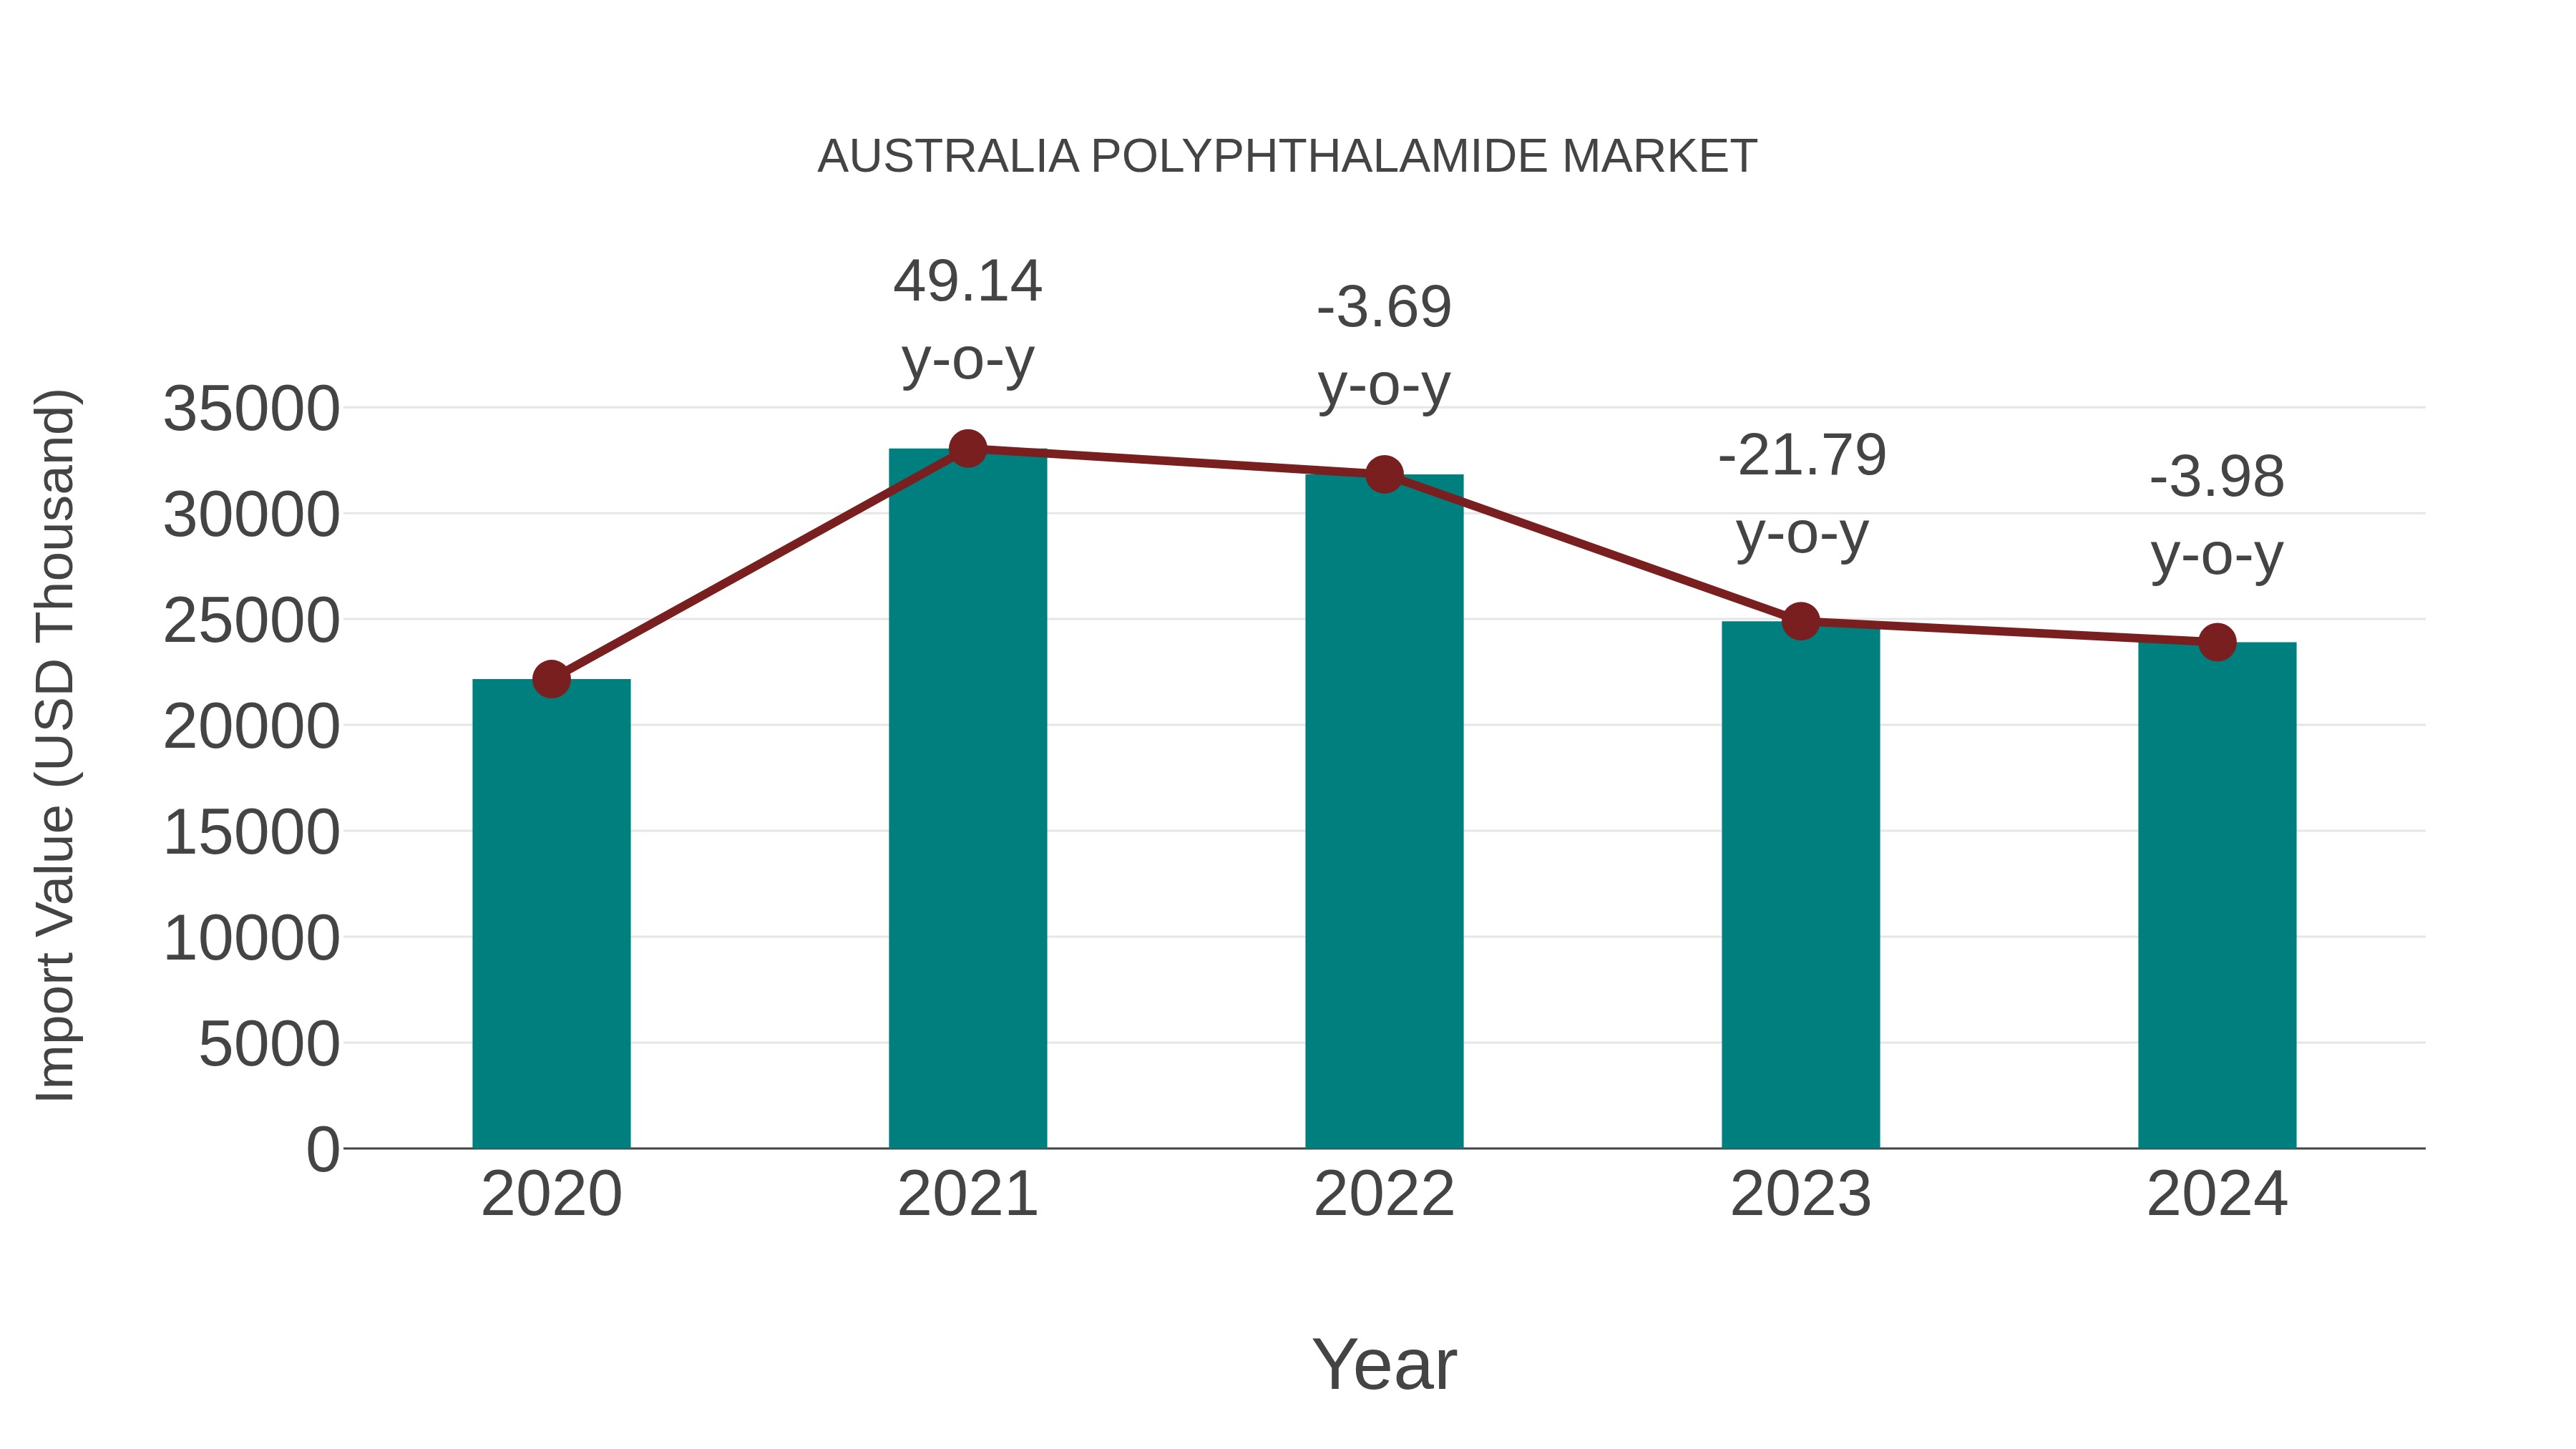
Australia Polyphthalamide Market: Import Trend Analysis
Australia`s import trend for the polyphthalamide market saw a decline from 2023 to 2024, with a growth rate of -3.98%. The compound annual growth rate (CAGR) for imports from 2020 to 2024 stood at 1.91%. This decline could be attributed to shifting demand dynamics or changes in trade policies impacting market stability.
Australia Polyphthalamide Market Overview
The polyphthalamide (PPA) market in Australia is growing due to its applications in automotive, electronics, and industrial components. This high-performance thermoplastic offers excellent thermal stability, chemical resistance, and mechanical strength, making it suitable for demanding applications such as electrical connectors and under-the-hood automotive parts. The shift toward miniaturization and high-efficiency electronic devices is further driving market demand.
Drivers of the market
The polyphthalamide (PPA) market in Australia is expanding due to increasing demand for high-performance engineering plastics in automotive, electronics, and industrial sectors. Rising adoption of PPA for improving heat resistance, mechanical strength, and dimensional stability is driving market growth. Enhanced focus on developing bio-based PPA solutions is supporting market performance.
Challenges of the market
The polyphthalamide market in Australia is constrained by high production costs and limited domestic manufacturing capacity. Dependence on imported raw materials increases market vulnerability. Competition from alternative high-performance polymers adds pricing pressure.
Investment opportunities in the Market
The Australia Polyphthalamide Market offers strong investment potential due to increasing demand for high-performance engineering plastics. Investment opportunities include developing heat-resistant polyphthalamides, improving impact strength, and expanding into automotive and electronics sectors.
Government Policy of the market
Polyphthalamide (PPA) used in automotive and electronics applications is regulated under the Australian Industrial Chemicals Introduction Scheme (AICIS), which requires manufacturers and importers to register chemical compositions and meet safety standards. Occupational safety during handling and processing is governed by the Work Health and Safety Act 2011. Environmental disposal of waste materials and recycling guidelines fall under the Environmental Protection Act 1997.
Key Highlights of the Report:
- Australia Polyphthalamide Market Outlook
- Market Size of Australia Polyphthalamide Market, 2025
- Forecast of Australia Polyphthalamide Market, 2032
- Historical Data and Forecast of Australia Polyphthalamide Revenues & Volume for the Period 2022-2032F
- Australia Polyphthalamide Market Trend Evolution
- Australia Polyphthalamide Market Drivers and Challenges
- Australia Polyphthalamide Price Trends
- Australia Polyphthalamide Porter's Five Forces
- Australia Polyphthalamide Industry Life Cycle
- Historical Data and Forecast of Australia Polyphthalamide Market Revenues & Volume By Type for the Period 2022-2032F
- Historical Data and Forecast of Australia Polyphthalamide Market Revenues & Volume By Unfilled for the Period 2022-2032F
- Historical Data and Forecast of Australia Polyphthalamide Market Revenues & Volume By Mineral Filled for the Period 2022-2032F
- Historical Data and Forecast of Australia Polyphthalamide Market Revenues & Volume By Glass Fiber Filled for the Period 2022-2032F
- Historical Data and Forecast of Australia Polyphthalamide Market Revenues & Volume By Carbon Fiber Filled for the Period 2022-2032F
- Historical Data and Forecast of Australia Polyphthalamide Market Revenues & Volume By Application for the Period 2022-2032F
- Historical Data and Forecast of Australia Polyphthalamide Market Revenues & Volume By Automotive for the Period 2022-2032F
- Historical Data and Forecast of Australia Polyphthalamide Market Revenues & Volume By Electronics & Electricals for the Period 2022-2032F
- Historical Data and Forecast of Australia Polyphthalamide Market Revenues & Volume By Industrial Equipment & Apparatus for the Period 2022-2032F
- Historical Data and Forecast of Australia Polyphthalamide Market Revenues & Volume By Consumer & Personal Care for the Period 2022-2032F
- Historical Data and Forecast of Australia Polyphthalamide Market Revenues & Volume By Others for the Period 2022-2032F
- Australia Polyphthalamide Import Export Trade Statistics
- Market Opportunity Assessment By Type
- Market Opportunity Assessment By Application
- Australia Polyphthalamide Top Companies Market Share
- Australia Polyphthalamide Competitive Benchmarking By Technical and Operational Parameters
- Australia Polyphthalamide Company Profiles
- Australia Polyphthalamide Key Strategic Recommendations
Australia Polyphthalamide Market (2026-2032): FAQs
6Wresearch actively monitors the Australia Polyphthalamide Market and publishes its comprehensive annual report, highlighting emerging trends, growth drivers, revenue analysis, and forecast outlook. Our insights help businesses to make data-backed strategic decisions with ongoing market dynamics. Our analysts track relevent industries related to the Australia Polyphthalamide Market, allowing our clients with actionable intelligence and reliable forecasts tailored to emerging regional needs.
Yes, we provide customisation as per your requirements. To learn more, feel free to contact us on sales@6wresearch.com
1 Executive Summary |
2 Introduction |
2.1 Key Highlights of the Report |
2.2 Report Description |
2.3 Market Scope & Segmentation |
2.4 Research Methodology |
2.5 Assumptions |
3 Australia Polyphthalamide Market Overview |
3.1 Australia Country Macro Economic Indicators |
3.2 Australia Polyphthalamide Market Revenues & Volume, 2022 & 2032F |
3.3 Australia Polyphthalamide Market - Industry Life Cycle |
3.4 Australia Polyphthalamide Market - Porter's Five Forces |
3.5 Australia Polyphthalamide Market Revenues & Volume Share, By Type, 2022 & 2032F |
3.6 Australia Polyphthalamide Market Revenues & Volume Share, By Application, 2022 & 2032F |
4 Australia Polyphthalamide Market Dynamics |
4.1 Impact Analysis |
4.2 Market Drivers |
4.2.1 Increasing demand from automotive and electronics industries |
4.2.2 Growing focus on lightweight and high-performance materials in various applications |
4.2.3 Rising investments in research and development for enhancing polyphthalamide properties |
4.3 Market Restraints |
4.3.1 Fluctuating raw material prices |
4.3.2 Stringent regulations regarding the use of certain chemicals in polyphthalamide production |
4.3.3 Intense competition from other high-performance polymers |
5 Australia Polyphthalamide Market Trends |
6 Australia Polyphthalamide Market, By Types |
6.1 Australia Polyphthalamide Market, By Type |
6.1.1 Overview and Analysis |
6.1.2 Australia Polyphthalamide Market Revenues & Volume, By Type, 2022-2032F |
6.1.3 Australia Polyphthalamide Market Revenues & Volume, By Unfilled, 2022-2032F |
6.1.4 Australia Polyphthalamide Market Revenues & Volume, By Mineral Filled, 2022-2032F |
6.1.5 Australia Polyphthalamide Market Revenues & Volume, By Glass Fiber Filled, 2022-2032F |
6.1.6 Australia Polyphthalamide Market Revenues & Volume, By Carbon Fiber Filled, 2022-2032F |
6.2 Australia Polyphthalamide Market, By Application |
6.2.1 Overview and Analysis |
6.2.2 Australia Polyphthalamide Market Revenues & Volume, By Automotive, 2022-2032F |
6.2.3 Australia Polyphthalamide Market Revenues & Volume, By Electronics & Electricals, 2022-2032F |
6.2.4 Australia Polyphthalamide Market Revenues & Volume, By Industrial Equipment & Apparatus, 2022-2032F |
6.2.5 Australia Polyphthalamide Market Revenues & Volume, By Consumer & Personal Care, 2022-2032F |
6.2.6 Australia Polyphthalamide Market Revenues & Volume, By Others, 2022-2032F |
7 Australia Polyphthalamide Market Import-Export Trade Statistics |
7.1 Australia Polyphthalamide Market Export to Major Countries |
7.2 Australia Polyphthalamide Market Imports from Major Countries |
8 Australia Polyphthalamide Market Key Performance Indicators |
8.1 Percentage increase in the adoption of polyphthalamide in new applications |
8.2 Number of patents filed for innovations in polyphthalamide technology |
8.3 Percentage growth in demand for polyphthalamide compounds in key end-use industries |
9 Australia Polyphthalamide Market - Opportunity Assessment |
9.1 Australia Polyphthalamide Market Opportunity Assessment, By Type, 2022 & 2032F |
9.2 Australia Polyphthalamide Market Opportunity Assessment, By Application, 2022 & 2032F |
10 Australia Polyphthalamide Market - Competitive Landscape |
10.1 Australia Polyphthalamide Market Revenue Share, By Companies, 2025 |
10.2 Australia Polyphthalamide Market Competitive Benchmarking, By Operating and Technical Parameters |
11 Company Profiles |
12 Recommendations |
13 Disclaimer |
Export potential assessment - trade Analytics for 2030
Export potential enables firms to identify high-growth global markets with greater confidence by combining advanced trade intelligence with a structured quantitative methodology. The framework analyzes emerging demand trends and country-level import patterns while integrating macroeconomic and trade datasets such as GDP and population forecasts, bilateral import–export flows, tariff structures, elasticity differentials between developed and developing economies, geographic distance, and import demand projections. Using weighted trade values from 2020–2024 as the base period to project country-to-country export potential for 2030, these inputs are operationalized through calculated drivers such as gravity model parameters, tariff impact factors, and projected GDP per-capita growth. Through an analysis of hidden potentials, demand hotspots, and market conditions that are most favorable to success, this method enables firms to focus on target countries, maximize returns, and global expansion with data, backed by accuracy.
By factoring in the projected importer demand gap that is currently unmet and could be potential opportunity, it identifies the potential for the Exporter (Country) among 190 countries, against the general trade analysis, which identifies the biggest importer or exporter.
To discover high-growth global markets and optimize your business strategy:
Click Here
Pricing
- Single User License$ 1,995
- Department License$ 2,400
- Site License$ 3,120
- Global License$ 3,795

Search
Thought Leadership and Analyst Meet


Our Clients
Latest Reports
- Philippines Polyhydroxybutyrate-co-Hydroxyvalerate Market (2026-2032) | Trends, Insights, Challenges, Restraints, Competition, Size, Value, Forecast, Pricing, Share, Outlook, Revenue, Investment Opportunities, Strategy, Drivers, Demand, Growth, segmentation, Analysis, Companies
- Peru Polyhydroxybutyrate-co-Hydroxyvalerate Market (2026-2032) | Growth, Demand, Challenges, Share, Trends, Analysis, Pricing, Investment Opportunities, Drivers, Value, Forecast, Competition, Size, Companies, Insights, Outlook, Restraints, segmentation, Revenue, Strategy
- Pakistan Polyhydroxybutyrate-co-Hydroxyvalerate Market (2026-2032) | Restraints, segmentation, Pricing, Forecast, Share, Strategy, Competition, Trends, Insights, Drivers, Challenges, Growth, Revenue, Outlook, Value, Investment Opportunities, Companies, Size, Analysis, Demand
- Oman Polyhydroxybutyrate-co-Hydroxyvalerate Market (2026-2032) | Drivers, segmentation, Insights, Competition, Pricing, Outlook, Size, Revenue, Challenges, Forecast, Analysis, Growth, Value, Share, Trends, Investment Opportunities, Strategy, Restraints, Companies, Demand
- Nigeria Polyhydroxybutyrate-co-Hydroxyvalerate Market (2026-2032) | Value, Investment Opportunities, Analysis, Revenue, Restraints, Pricing, Outlook, Competition, Demand, Growth, Forecast, Companies, Trends, Challenges, segmentation, Drivers, Insights, Share, Size, Strategy
- Nepal Polyhydroxybutyrate-co-Hydroxyvalerate Market (2026-2032) | Insights, Analysis, Drivers, Share, Revenue, Demand, segmentation, Investment Opportunities, Competition, Forecast, Growth, Pricing, Companies, Strategy, Trends, Restraints, Challenges, Outlook, Size, Value
- Myanmar Polyhydroxybutyrate-co-Hydroxyvalerate Market (2026-2032) | Outlook, Revenue, Strategy, Restraints, Drivers, segmentation, Share, Forecast, Competition, Insights, Growth, Pricing, Size, Demand, Value, Companies, Trends, Challenges, Investment Opportunities, Analysis
- Morocco Polyhydroxybutyrate-co-Hydroxyvalerate Market (2026-2032) | Outlook, Investment Opportunities, Restraints, Strategy, Forecast, Challenges, Drivers, Growth, Companies, segmentation, Trends, Size, Competition, Revenue, Demand, Insights, Share, Analysis, Value, Pricing
- Mexico Polyhydroxybutyrate-co-Hydroxyvalerate Market (2026-2032) | Size, Drivers, Outlook, Share, Strategy, Growth, Pricing, Challenges, Companies, Demand, Value, Investment Opportunities, Restraints, Trends, Forecast, segmentation, Analysis, Insights, Competition, Revenue
- Malaysia Polyhydroxybutyrate-co-Hydroxyvalerate Market (2026-2032) | Share, segmentation, Size, Companies, Analysis, Insights, Forecast, Value, Revenue, Drivers, Restraints, Challenges, Investment Opportunities, Trends, Competition, Strategy, Demand, Growth, Outlook, Pricing
Industry Events and Analyst Meet

HIMTEX 2026

India Refining Summit 2026

India EV Show 2026

EV tech India Expo 2026

Auto Tech Asia 2026
Whitepaper
- Middle East & Africa Commercial Security Market Click here to view more.
- Middle East & Africa Fire Safety Systems & Equipment Market Click here to view more.
- GCC Drone Market Click here to view more.
- Middle East Lighting Fixture Market Click here to view more.
- GCC Physical & Perimeter Security Market Click here to view more.
6WResearch In News
- Doha a strategic location for EV manufacturing hub: IPA Qatar
- Demand for luxury TVs surging in the GCC, says Samsung
- Empowering Growth: The Thriving Journey of Bangladesh’s Cable Industry
- Demand for luxury TVs surging in the GCC, says Samsung
- Video call with a traditional healer? Once unthinkable, it’s now common in South Africa
- Intelligent Buildings To Smooth GCC’s Path To Net Zero