Australia Printed Electronics Market (2026-2032) Outlook | Size, Value, Forecast, Companies, Revenue, Analysis, Trends, Industry, Share & Growth
Market Forecast By Material (Ink, Substrate), By Technology (Screen, Inkjet, Flexographic, Gravure), By Device (Displays, Photovoltaic, Lighting, RFID, Others) And Competitive Landscape
| Product Code: ETC255095 | Publication Date: Aug 2022 | Updated Date: Jul 2026 | Product Type: Market Research Report | |
| Publisher: 6Wresearch | Author: Ravi Bhandari | No. of Pages: 75 | No. of Figures: 35 | No. of Tables: 20 |
Australia Printed Electronics Market Size, Share & Growth Rate
The Australia Printed Electronics Market was estimated at USD 80 Million in 2025 and is projected to reach USD 93 Million by 2032, growing at a CAGR of 2.2% from 2026 to 2032. This growth trajectory is primarily driven by the increasing demand for flexible and lightweight electronic components across various applications, particularly in smart packaging and wearable technologies. Furthermore, advancements in conductive inks and substrates are fostering innovative solutions tailored for IoT-enabled devices, which align with Australia's digital transformation goals.
Australia Printed Electronics Market Year-wise Growth Rate and Key Drivers
This graph highlights how the Australia Printed Electronics Market has steadily grown over the years, supported by major growth factors.
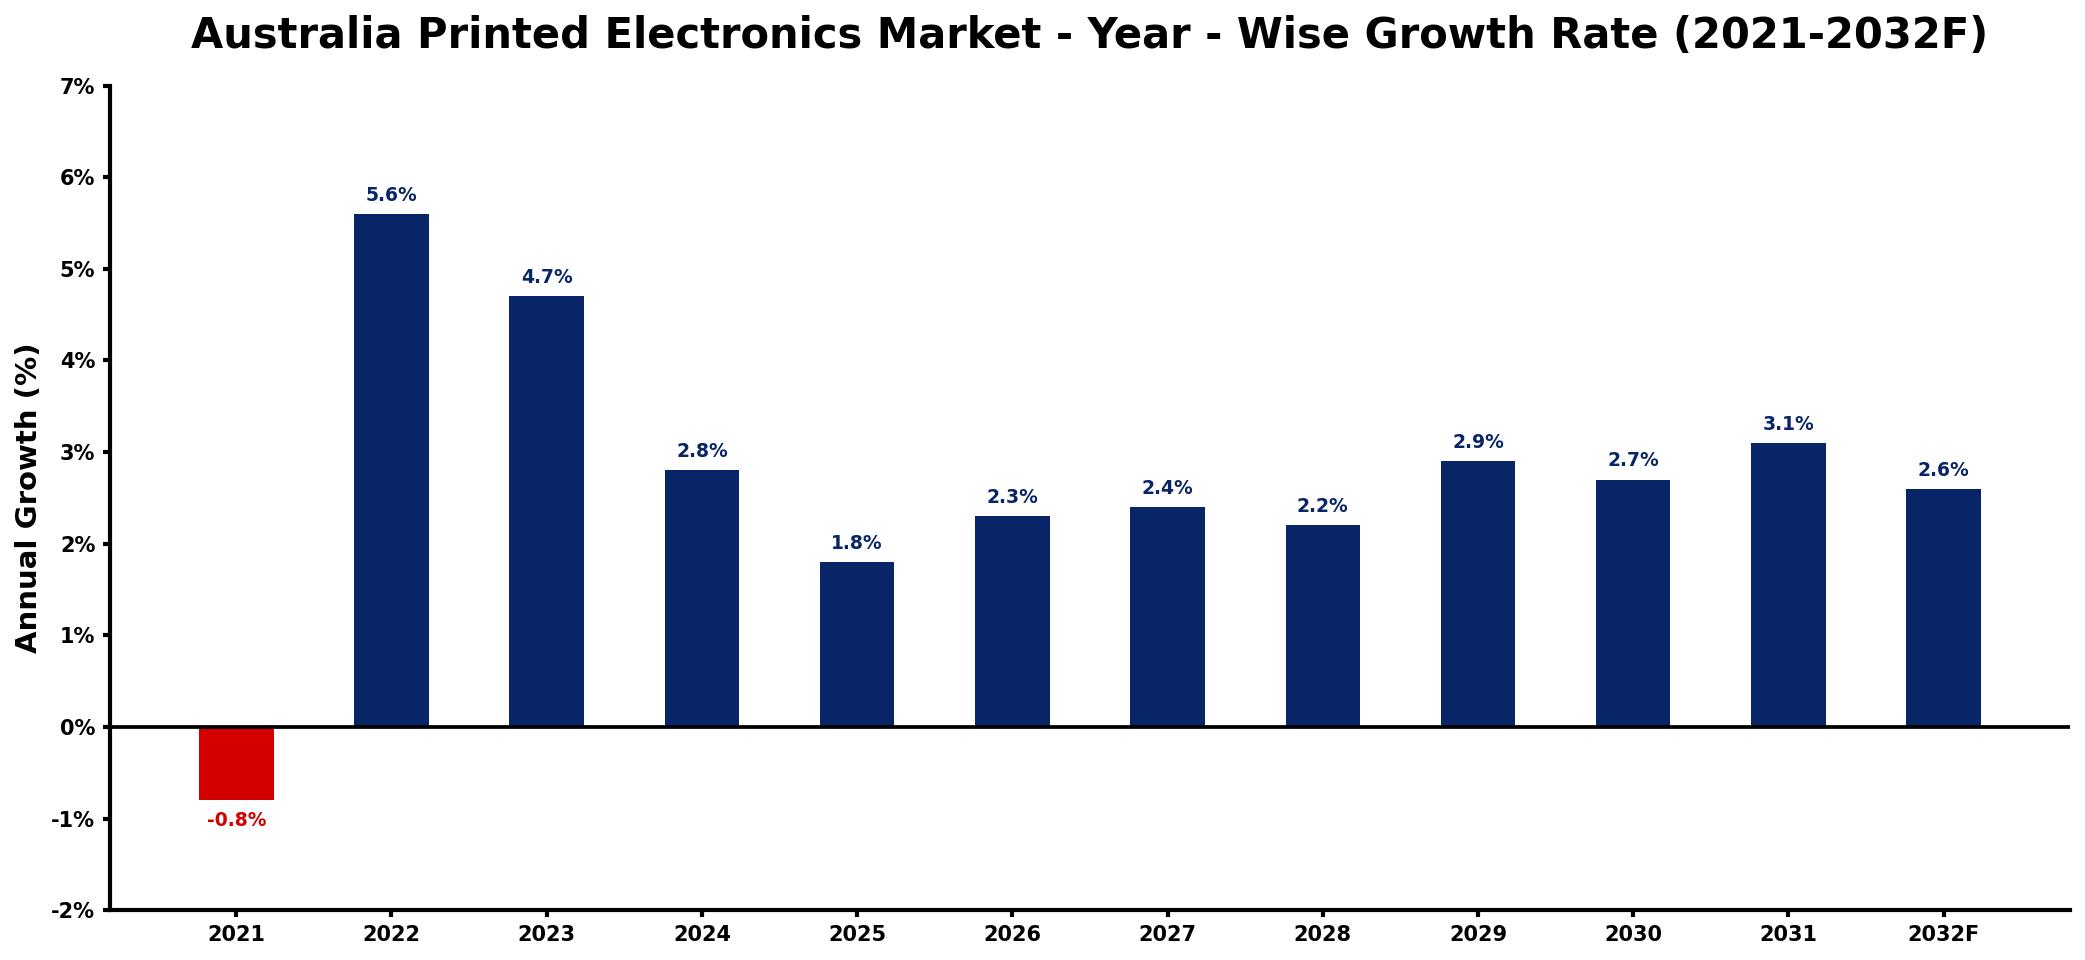
The table below presents the year‑wise growth rates along with the key drivers influencing the market
| Year | Growth Rate | Major Drivers |
| 2021 | -0.8% | decrease in consumer investment trends |
| 2022 | 5.6% | rise in smart packaging applications |
| 2023 | 4.7% | growth in renewable energy sectors |
| 2024 | 2.8% | expansion of wearable technology market |
| 2025 | 1.8% | increased demand for sustainable solutions |
| 2026 | 2.3% | advancements in manufacturing techniques |
| 2027 | 2.4% | development of innovative healthcare solutions |
| 2028 | 2.2% | surge in IoT integration projects |
| 2029 | 2.9% | increased overall sector activity |
| 2030 | 2.7% | increased focus on smart textiles |
| 2031 | 3.1% | strengthening underlying market demand |
| 2032 | 2.6% | increased domestic production output |
Note: Market size estimations and growth projections presented in this report are based on 6Wresearch's proprietary forecasting methodology, utilizing the latest available industry data, government publications, and primary research inputs.
Australia Printed Electronics Market Synopsis
The strongest force shaping the Australian printed electronics market is the surge in applications across industries such as healthcare and consumer electronics. As companies aim to enhance product functionality and user experience, the integration of printed electronics has become essential for maintaining competitive advantage.
The growing emphasis on sustainability also plays a critical role in shaping market dynamics. With environmental initiatives encouraging the use of sustainable materials and processes, printed electronics are positioned to meet the demands for environmentally friendly solutions in electronic manufacturing.
Australia Printed Electronics Market Key Takeaways
- Innovations in conductive inks and lightweight materials are driving growth across diverse applications.
- Increased demand for smart packaging and wearable technology enhances market potential.
- Government regulations ensure quality standards, shaping the landscape for printed electronics.
- Environmental sustainability initiatives are fostering the development of eco-friendly printed electronics.
- Investment opportunities are expanding as industries seek to integrate printed electronics into their offerings.
Evaluation of Restraints in Australia Printed Electronics Market
Despite its promising growth, the Australian printed electronics market faces several constraints. High initial investment costs are a significant barrier, particularly for smaller firms that may struggle to secure the necessary funding for research and development. Moreover, the limited local expertise in advanced printed electronics technologies poses a challenge, making it difficult for companies to fully harness the potential of this market. Integrating printed electronics into established manufacturing processes also remains a complex task, hindering widespread adoption.
Australia Printed Electronics Market Trends
Several current and emerging trends are shaping the demand for printed electronics in Australia. The rise of Internet of Things (IoT) devices is prompting innovation in printed sensors and displays, enhancing interconnectivity and smart functionality. Additionally, there is a noticeable shift toward personalized and health-oriented wearable technology, driving the need for flexible printed circuits that can seamlessly integrate with clothing and accessories. Furthermore, advances in manufacturing techniques are enabling low-cost mass production of printed electronic components, which will likely stimulate further market growth.
Australia Printed Electronics Market Opportunities
Opportunities for growth within the Australian printed electronics market are particularly strong in sectors such as healthcare, automotive, and consumer electronics. Investors can focus on developing innovative conductive inks and sustainable printing technologies that meet both functional and environmental standards. Collaborations across industries can also unlock new avenues for market expansion, particularly as companies seek to enhance product performance through smart packaging solutions and intelligent displays.
Government Initiatives in the Australia Printed Electronics Market
Government policies in Australia are actively supporting the printed electronics market through regulations aimed at ensuring quality and safety in flexible electronic components. Performance standards are enforced for critical applications, including sensors and RFID tags, promoting confidence among manufacturers and consumers. Additionally, environmental initiatives encourage the exploration and use of sustainable materials, aimed at reducing electronic waste and fostering greener production practices.
Future Insights of the Australia Printed Electronics Market
Looking ahead to the period from 2026 to 2032, the Australian printed electronics market is expected to evolve significantly. The growing integration of IoT and digital transformation initiatives will enhance the demand for innovative electronic solutions, driving investment in research and development. As market players adapt to emerging technologies and consumer preferences, the landscape is likely to witness increased collaboration and partnerships across various sectors. This forward momentum, combined with ongoing regulatory support, positions the market for robust growth in the coming years.
Australia Printed Electronics Market Latest Developments (2025 - 2026)
Recent developments in the Australian printed electronics market reflect a shift towards innovative solutions and sustainable practices. Companies are actively exploring new manufacturing techniques that enhance the efficiency and cost-effectiveness of printed electronic components. Additionally, increased collaboration between academia and industry is leading to breakthroughs in conductive materials and printing processes. These advancements are positioning Australia to be a key player in the global printed electronics landscape.
Australia Printed Electronics Market - Key Attractiveness of the Report
- 10 Years of Market Numbers
- Historical Data Starting from 2022 to 2025
- Base Year: 2025
- Forecast Data until 2032
- Key Performance Indicators Impacting the Market
- Major Upcoming Developments and Projects
Key Highlights of the Report:
- Australia Printed Electronics Market Outlook
- Market Size of Australia Printed Electronics Market, 2025
- Forecast of Australia Printed Electronics Market, 2032
- Historical Data and Forecast of Australia Printed Electronics Revenues & Volume for the Period 2022-2032F
- Australia Printed Electronics Market Trend Evolution
- Australia Printed Electronics Market Drivers and Challenges
- Australia Printed Electronics Price Trends
- Australia Printed Electronics Porter's Five Forces
- Australia Printed Electronics Industry Life Cycle
- Historical Data and Forecast of Australia Printed Electronics Market Revenues & Volume By Material for the Period 2022-2032F
- Historical Data and Forecast of Australia Printed Electronics Market Revenues & Volume By Ink for the Period 2022-2032F
- Historical Data and Forecast of Australia Printed Electronics Market Revenues & Volume By Substrate for the Period 2022-2032F
- Historical Data and Forecast of Australia Printed Electronics Market Revenues & Volume By Technology for the Period 2022-2032F
- Historical Data and Forecast of Australia Printed Electronics Market Revenues & Volume By Screen for the Period 2022-2032F
- Historical Data and Forecast of Australia Printed Electronics Market Revenues & Volume By Inkjet for the Period 2022-2032F
- Historical Data and Forecast of Australia Printed Electronics Market Revenues & Volume By Flexographic for the Period 2022-2032F
- Historical Data and Forecast of Australia Printed Electronics Market Revenues & Volume By Gravure for the Period 2022-2032F
- Historical Data and Forecast of Australia Printed Electronics Market Revenues & Volume By Device for the Period 2022-2032F
- Historical Data and Forecast of Australia Printed Electronics Market Revenues & Volume By Displays for the Period 2022-2032F
- Historical Data and Forecast of Australia Printed Electronics Market Revenues & Volume By Photovoltaic for the Period 2022-2032F
- Historical Data and Forecast of Australia Printed Electronics Market Revenues & Volume By Lighting for the Period 2022-2032F
- Historical Data and Forecast of Australia Printed Electronics Market Revenues & Volume By RFID for the Period 2022-2032F
- Historical Data and Forecast of Australia Printed Electronics Market Revenues & Volume By Others for the Period 2022-2032F
- Australia Printed Electronics Import Export Trade Statistics
- Market Opportunity Assessment By Material
- Market Opportunity Assessment By Technology
- Market Opportunity Assessment By Device
- Australia Printed Electronics Top Companies Market Share
- Australia Printed Electronics Competitive Benchmarking By Technical and Operational Parameters
- Australia Printed Electronics Company Profiles
- Australia Printed Electronics Key Strategic Recommendations
Frequently Asked Questions About the Market Study (FAQs):
The Australia Printed Electronics Market was estimated at USD 80 Million in 2025 and is projected to reach USD 93 Million by 2032, growing at a CAGR of 2.2% from 2026 to 2032.
Smart packaging is driving demand for printed electronics by requiring advanced sensors and displays that can enhance product interactivity and tracking capabilities.
Environmental initiatives encourage the adoption of sustainable materials and practices in printed electronics, ultimately reducing electronic waste and promoting a greener manufacturing process.
Sectors such as healthcare, automotive, and consumer electronics are projected to benefit significantly, as innovations in printed electronics can enhance product functionality and efficiency.
Emerging trends include the development of smart textiles and wearables, which leverage flexible printed electronics for improved user experience and interactivity.
6Wresearch actively monitors the Australia Printed Electronics Market and publishes its comprehensive annual report, highlighting emerging trends, growth drivers, revenue analysis, and forecast outlook. Our insights help businesses to make data-backed strategic decisions with ongoing market dynamics. Our analysts track relevent industries related to the Australia Printed Electronics Market, allowing our clients with actionable intelligence and reliable forecasts tailored to emerging regional needs.
Yes, we provide customisation as per your requirements. To learn more, feel free to contact us on sales@6wresearch.com
1 Executive Summary |
2 Introduction |
2.1 Key Highlights of the Report |
2.2 Report Description |
2.3 Market Scope & Segmentation |
2.4 Research Methodology |
2.5 Assumptions |
3 Australia Printed Electronics Market Overview |
3.1 Australia Country Macro Economic Indicators |
3.2 Australia Printed Electronics Market Revenues & Volume, 2022 & 2032F |
3.3 Australia Printed Electronics Market - Industry Life Cycle |
3.4 Australia Printed Electronics Market - Porter's Five Forces |
3.5 Australia Printed Electronics Market Revenues & Volume Share, By Material, 2022 & 2032F |
3.6 Australia Printed Electronics Market Revenues & Volume Share, By Technology, 2022 & 2032F |
3.7 Australia Printed Electronics Market Revenues & Volume Share, By Device, 2022 & 2032F |
4 Australia Printed Electronics Market Dynamics |
4.1 Impact Analysis |
4.2 Market Drivers |
4.2.1 Increasing demand for flexible electronics in sectors like healthcare, automotive, and consumer electronics. |
4.2.2 Technological advancements leading to the development of innovative printed electronic products. |
4.2.3 Government initiatives and investments in research and development for printed electronics. |
4.3 Market Restraints |
4.3.1 High initial setup costs and investment required for the development and production of printed electronics. |
4.3.2 Limited awareness and adoption of printed electronics among end-users. |
4.3.3 Challenges related to the scalability and reliability of printed electronic products. |
5 Australia Printed Electronics Market Trends |
6 Australia Printed Electronics Market, By Types |
6.1 Australia Printed Electronics Market, By Material |
6.1.1 Overview and Analysis |
6.1.2 Australia Printed Electronics Market Revenues & Volume, By Material, 2022-2032F |
6.1.3 Australia Printed Electronics Market Revenues & Volume, By Ink, 2022-2032F |
6.1.4 Australia Printed Electronics Market Revenues & Volume, By Substrate, 2022-2032F |
6.2 Australia Printed Electronics Market, By Technology |
6.2.1 Overview and Analysis |
6.2.2 Australia Printed Electronics Market Revenues & Volume, By Screen, 2022-2032F |
6.2.3 Australia Printed Electronics Market Revenues & Volume, By Inkjet, 2022-2032F |
6.2.4 Australia Printed Electronics Market Revenues & Volume, By Flexographic, 2022-2032F |
6.2.5 Australia Printed Electronics Market Revenues & Volume, By Gravure, 2022-2032F |
6.3 Australia Printed Electronics Market, By Device |
6.3.1 Overview and Analysis |
6.3.2 Australia Printed Electronics Market Revenues & Volume, By Displays, 2022-2032F |
6.3.3 Australia Printed Electronics Market Revenues & Volume, By Photovoltaic, 2022-2032F |
6.3.4 Australia Printed Electronics Market Revenues & Volume, By Lighting, 2022-2032F |
6.3.5 Australia Printed Electronics Market Revenues & Volume, By RFID, 2022-2032F |
6.3.6 Australia Printed Electronics Market Revenues & Volume, By Others, 2022-2032F |
7 Australia Printed Electronics Market Import-Export Trade Statistics |
7.1 Australia Printed Electronics Market Export to Major Countries |
7.2 Australia Printed Electronics Market Imports from Major Countries |
8 Australia Printed Electronics Market Key Performance Indicators |
8.1 Number of research collaborations between industry players and academic institutions in the field of printed electronics. |
8.2 Percentage increase in patent filings related to printed electronics technology. |
8.3 Growth in the number of startups and companies specializing in printed electronics technology. |
8.4 Rate of adoption of printed electronics in new application areas. |
9 Australia Printed Electronics Market - Opportunity Assessment |
9.1 Australia Printed Electronics Market Opportunity Assessment, By Material, 2022 & 2032F |
9.2 Australia Printed Electronics Market Opportunity Assessment, By Technology, 2022 & 2032F |
9.3 Australia Printed Electronics Market Opportunity Assessment, By Device, 2022 & 2032F |
10 Australia Printed Electronics Market - Competitive Landscape |
10.1 Australia Printed Electronics Market Revenue Share, By Companies, 2025 |
10.2 Australia Printed Electronics Market Competitive Benchmarking, By Operating and Technical Parameters |
11 Company Profiles |
12 Recommendations |
13 Disclaimer |
Global Go To Market Strategy - 2030
Export potential enables firms to identify high-growth global markets with greater confidence by combining advanced trade intelligence with a structured quantitative methodology. The framework analyzes emerging demand trends and country-level import patterns while integrating macroeconomic and trade datasets such as GDP and population forecasts, bilateral import–export flows, tariff structures, elasticity differentials between developed and developing economies, geographic distance, and import demand projections. Using weighted trade values from 2020–2024 as the base period to project country-to-country export potential for 2030, these inputs are operationalized through calculated drivers such as gravity model parameters, tariff impact factors, and projected GDP per-capita growth. Through an analysis of hidden potentials, demand hotspots, and market conditions that are most favorable to success, this method enables firms to focus on target countries, maximize returns, and global expansion with data, backed by accuracy.
By factoring in the projected importer demand gap that is currently unmet and could be potential opportunity, it identifies the potential for the Exporter (Country) among 190 countries, against the general trade analysis, which identifies the biggest importer or exporter.
To discover high-growth global markets and optimize your business strategy:
Click Here
Pricing
- Single User License$ 1,995
- Department License$ 2,400
- Site License$ 3,120
- Global License$ 3,795

Leadership Perspectives from Industry Events
Search
Thought Leadership and Analyst Meet


Our Clients
6WResearch In News
- India Air Conditioner Market Set for Strong Rebound in 2026 After Weather-Led Correction and GST-Driven Recovery: 6Wresearch
- ADAS in India: How Automatic Emergency Braking, Blind Spot Detection & Driver Monitoring are Transforming Road Safety
- Doha a strategic location for EV manufacturing hub: IPA Qatar
- Demand for luxury TVs surging in the GCC, says Samsung
- Empowering Growth: The Thriving Journey of Bangladesh’s Cable Industry
- Demand for luxury TVs surging in the GCC, says Samsung
Latest Reports
- Nicaragua RPG Gaming Market (2026-2032)
- New Zealand RPG Gaming Market (2026-2032)
- Netherlands RPG Gaming Market (2026-2032)
- Nauru RPG Gaming Market (2026-2032)
- Namibia RPG Gaming Market (2026-2032)
- Mozambique RPG Gaming Market (2026-2032)
- Montenegro RPG Gaming Market (2026-2032)
- Mongolia RPG Gaming Market (2026-2032)
- Monaco RPG Gaming Market (2026-2032)
- Micronesia RPG Gaming Market (2026-2032)
Industry Events and Analyst Meet

EV India Expo 2026

HIMTEX 2026

India Refining Summit 2026

India EV Show 2026

EV tech India Expo 2026
Whitepaper
- Middle East & Africa Commercial Security Market Click here to view more.
- Middle East & Africa Fire Safety Systems & Equipment Market Click here to view more.
- GCC Drone Market Click here to view more.
- Middle East Lighting Fixture Market Click here to view more.
- GCC Physical & Perimeter Security Market Click here to view more.