Australia Stannates Market (2026-2032) | Share, Outlook, Value, Segmentation, Growth, Trends, Analysis, Industry, Companies, Competitive Landscape, Forecast, Size & Revenue
Market Forecast By Type (Sn-42, Sn-36.5), By Application (Electroplating, Accessory Ingredient, Ceramic) And Competitive Landscape
| Product Code: ETC6191871 | Publication Date: Sep 2024 | Updated Date: Mar 2026 | Product Type: Market Research Report | |
| Publisher: 6Wresearch | Author: Shubham Deep | No. of Pages: 75 | No. of Figures: 35 | No. of Tables: 20 |
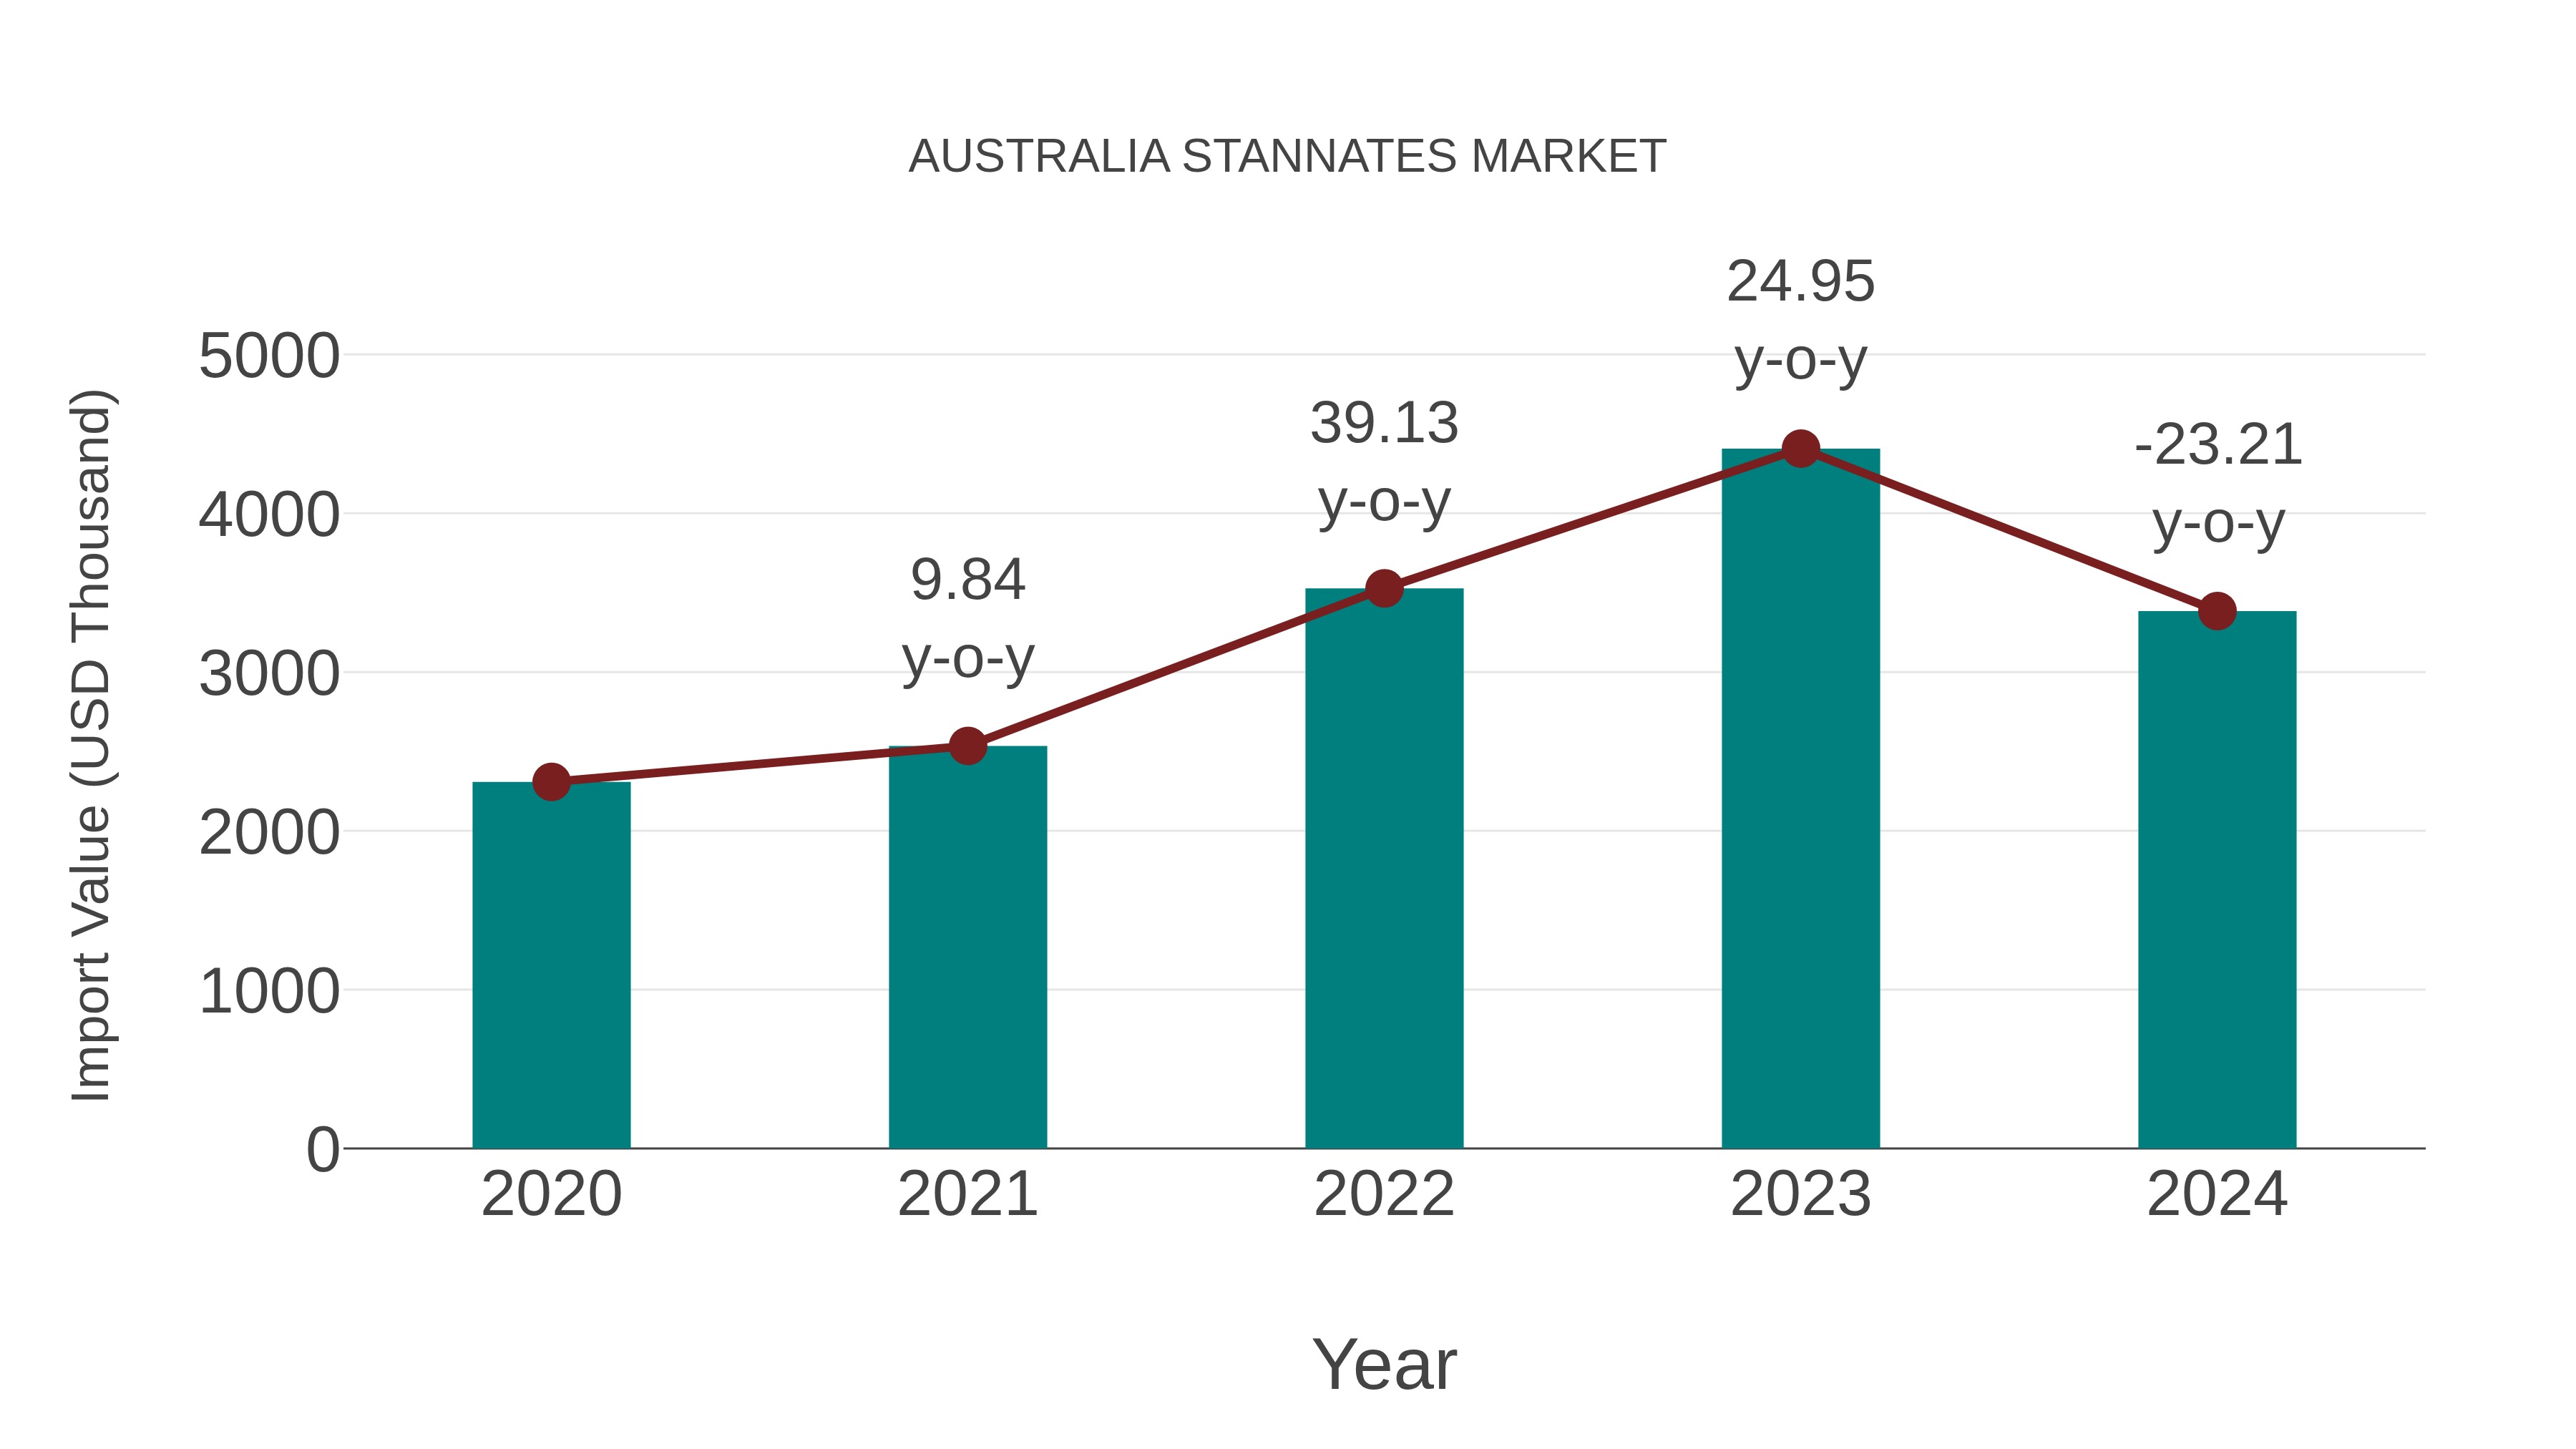
Australia Stannates Market: Import Trend Analysis
Australia`s import trend for the stannates market experienced a decline from 2023 to 2024, with a growth rate of -23.21%. However, the compound annual growth rate (CAGR) for the period 2020-2024 stood at a healthy 10.04%. This negative momentum in 2024 could be attributed to shifting demand dynamics or changes in trade policies impacting market stability.
Australia Stannates Market Overview
Australia`s stannates market caters primarily to electronics, ceramics, and electroplating industries. Stannates are used as stabilizers in PVC, flame retardants, and catalysts. The market is influenced by regulatory standards around chemical safety and the demand for advanced materials in semiconductor production. Local supply dynamics and global tin prices impact pricing and availability.
Drivers of the market
The stannates market in Australia is relatively niche but is gaining traction due to applications in chemical catalysts, stabilizers, and specialty coatings. Environmental regulations are influencing the development of eco-friendly stannate compounds with lower toxicity profiles. Growth is also linked to their use in emerging industries like battery manufacturing and electronics, where tin-based compounds offer desirable properties.
Challenges of the market
The Stannates Market in Australia, used mainly in chemical and industrial applications, is challenged by strict environmental regulations governing the use and disposal of tin-based compounds. Volatility in the global tin market affects raw material pricing and availability. Limited local production capacity means dependency on imports, which can increase lead times and costs. Additionally, the niche nature of the market limits economies of scale.
Investment opportunities in the Market
Stannates, used primarily in electroplating and ceramics, are gaining attention with increasing demand for specialty chemicals. Investors can explore value-added production and export-oriented supply chains. Collaborations with mining and metallurgical companies can ensure raw material access and sustainability compliance.
Government Policy of the market
The use of stannates in industrial applications is regulated through the Australian Industrial Chemicals Introduction Scheme (AICIS). The government monitors chemical imports and enforces labeling, safety data sheet requirements, and hazard classifications. Environmental policies also affect how stannates are disposed of or used in products, ensuring compliance with national chemical safety standards.
Key Highlights of the Report:
- Australia Stannates Market Outlook
- Market Size of Australia Stannates Market, 2025
- Forecast of Australia Stannates Market, 2032
- Historical Data and Forecast of Australia Stannates Revenues & Volume for the Period 2022 - 2032F
- Australia Stannates Market Trend Evolution
- Australia Stannates Market Drivers and Challenges
- Australia Stannates Price Trends
- Australia Stannates Porter's Five Forces
- Australia Stannates Industry Life Cycle
- Historical Data and Forecast of Australia Stannates Market Revenues & Volume By Type for the Period 2022 - 2032F
- Historical Data and Forecast of Australia Stannates Market Revenues & Volume By Sn-42 for the Period 2022 - 2032F
- Historical Data and Forecast of Australia Stannates Market Revenues & Volume By Sn-36.5 for the Period 2022 - 2032F
- Historical Data and Forecast of Australia Stannates Market Revenues & Volume By Application for the Period 2022 - 2032F
- Historical Data and Forecast of Australia Stannates Market Revenues & Volume By Electroplating for the Period 2022 - 2032F
- Historical Data and Forecast of Australia Stannates Market Revenues & Volume By Accessory Ingredient for the Period 2022 - 2032F
- Historical Data and Forecast of Australia Stannates Market Revenues & Volume By Ceramic for the Period 2022 - 2032F
- Australia Stannates Import Export Trade Statistics
- Market Opportunity Assessment By Type
- Market Opportunity Assessment By Application
- Australia Stannates Top Companies Market Share
- Australia Stannates Competitive Benchmarking By Technical and Operational Parameters
- Australia Stannates Company Profiles
- Australia Stannates Key Strategic Recommendations
Australia Stannates Market (2026-2032): FAQs
6Wresearch actively monitors the Australia Stannates Market and publishes its comprehensive annual report, highlighting emerging trends, growth drivers, revenue analysis, and forecast outlook. Our insights help businesses to make data-backed strategic decisions with ongoing market dynamics. Our analysts track relevent industries related to the Australia Stannates Market, allowing our clients with actionable intelligence and reliable forecasts tailored to emerging regional needs.
Yes, we provide customisation as per your requirements. To learn more, feel free to contact us on sales@6wresearch.com
1 Executive Summary |
2 Introduction |
2.1 Key Highlights of the Report |
2.2 Report Description |
2.3 Market Scope & Segmentation |
2.4 Research Methodology |
2.5 Assumptions |
3 Australia Stannates Market Overview |
3.1 Australia Country Macro Economic Indicators |
3.2 Australia Stannates Market Revenues & Volume, 2022 & 2032F |
3.3 Australia Stannates Market - Industry Life Cycle |
3.4 Australia Stannates Market - Porter's Five Forces |
3.5 Australia Stannates Market Revenues & Volume Share, By Type, 2022 & 2032F |
3.6 Australia Stannates Market Revenues & Volume Share, By Application, 2022 & 2032F |
4 Australia Stannates Market Dynamics |
4.1 Impact Analysis |
4.2 Market Drivers |
4.2.1 Increasing demand for electronics and electrical products, which use stannates in manufacturing. |
4.2.2 Growing investments in research and development for innovative stannate-based applications. |
4.2.3 Favorable government regulations promoting the use of stannates in various industries. |
4.3 Market Restraints |
4.3.1 Fluctuating raw material prices impacting the production cost of stannates. |
4.3.2 Intense competition from alternative materials affecting market penetration. |
4.3.3 Lack of awareness about the benefits and applications of stannates among end-users. |
5 Australia Stannates Market Trends |
6 Australia Stannates Market, By Types |
6.1 Australia Stannates Market, By Type |
6.1.1 Overview and Analysis |
6.1.2 Australia Stannates Market Revenues & Volume, By Type, 2022 - 2032F |
6.1.3 Australia Stannates Market Revenues & Volume, By Sn-42, 2022 - 2032F |
6.1.4 Australia Stannates Market Revenues & Volume, By Sn-36.5, 2022 - 2032F |
6.2 Australia Stannates Market, By Application |
6.2.1 Overview and Analysis |
6.2.2 Australia Stannates Market Revenues & Volume, By Electroplating, 2022 - 2032F |
6.2.3 Australia Stannates Market Revenues & Volume, By Accessory Ingredient, 2022 - 2032F |
6.2.4 Australia Stannates Market Revenues & Volume, By Ceramic, 2022 - 2032F |
7 Australia Stannates Market Import-Export Trade Statistics |
7.1 Australia Stannates Market Export to Major Countries |
7.2 Australia Stannates Market Imports from Major Countries |
8 Australia Stannates Market Key Performance Indicators |
8.1 Research and development expenditure focused on stannate technology advancements. |
8.2 Adoption rate of stannates in new industries or applications. |
8.3 Number of patents filed for stannate-related innovations. |
8.4 Environmental impact assessment measures undertaken by stannate manufacturers. |
9 Australia Stannates Market - Opportunity Assessment |
9.1 Australia Stannates Market Opportunity Assessment, By Type, 2022 & 2032F |
9.2 Australia Stannates Market Opportunity Assessment, By Application, 2022 & 2032F |
10 Australia Stannates Market - Competitive Landscape |
10.1 Australia Stannates Market Revenue Share, By Companies, 2025 |
10.2 Australia Stannates Market Competitive Benchmarking, By Operating and Technical Parameters |
11 Company Profiles |
12 Recommendations |
13 Disclaimer |
Export potential assessment - trade Analytics for 2030
Export potential enables firms to identify high-growth global markets with greater confidence by combining advanced trade intelligence with a structured quantitative methodology. The framework analyzes emerging demand trends and country-level import patterns while integrating macroeconomic and trade datasets such as GDP and population forecasts, bilateral import–export flows, tariff structures, elasticity differentials between developed and developing economies, geographic distance, and import demand projections. Using weighted trade values from 2020–2024 as the base period to project country-to-country export potential for 2030, these inputs are operationalized through calculated drivers such as gravity model parameters, tariff impact factors, and projected GDP per-capita growth. Through an analysis of hidden potentials, demand hotspots, and market conditions that are most favorable to success, this method enables firms to focus on target countries, maximize returns, and global expansion with data, backed by accuracy.
By factoring in the projected importer demand gap that is currently unmet and could be potential opportunity, it identifies the potential for the Exporter (Country) among 190 countries, against the general trade analysis, which identifies the biggest importer or exporter.
To discover high-growth global markets and optimize your business strategy:
Click Here
Pricing
- Single User License$ 1,995
- Department License$ 2,400
- Site License$ 3,120
- Global License$ 3,795

Search
Thought Leadership and Analyst Meet


Our Clients
Latest Reports
- Philippines Polyhydroxybutyrate-co-Hydroxyvalerate Market (2026-2032) | Trends, Insights, Challenges, Restraints, Competition, Size, Value, Forecast, Pricing, Share, Outlook, Revenue, Investment Opportunities, Strategy, Drivers, Demand, Growth, segmentation, Analysis, Companies
- Peru Polyhydroxybutyrate-co-Hydroxyvalerate Market (2026-2032) | Growth, Demand, Challenges, Share, Trends, Analysis, Pricing, Investment Opportunities, Drivers, Value, Forecast, Competition, Size, Companies, Insights, Outlook, Restraints, segmentation, Revenue, Strategy
- Pakistan Polyhydroxybutyrate-co-Hydroxyvalerate Market (2026-2032) | Restraints, segmentation, Pricing, Forecast, Share, Strategy, Competition, Trends, Insights, Drivers, Challenges, Growth, Revenue, Outlook, Value, Investment Opportunities, Companies, Size, Analysis, Demand
- Oman Polyhydroxybutyrate-co-Hydroxyvalerate Market (2026-2032) | Drivers, segmentation, Insights, Competition, Pricing, Outlook, Size, Revenue, Challenges, Forecast, Analysis, Growth, Value, Share, Trends, Investment Opportunities, Strategy, Restraints, Companies, Demand
- Nigeria Polyhydroxybutyrate-co-Hydroxyvalerate Market (2026-2032) | Value, Investment Opportunities, Analysis, Revenue, Restraints, Pricing, Outlook, Competition, Demand, Growth, Forecast, Companies, Trends, Challenges, segmentation, Drivers, Insights, Share, Size, Strategy
- Nepal Polyhydroxybutyrate-co-Hydroxyvalerate Market (2026-2032) | Insights, Analysis, Drivers, Share, Revenue, Demand, segmentation, Investment Opportunities, Competition, Forecast, Growth, Pricing, Companies, Strategy, Trends, Restraints, Challenges, Outlook, Size, Value
- Myanmar Polyhydroxybutyrate-co-Hydroxyvalerate Market (2026-2032) | Outlook, Revenue, Strategy, Restraints, Drivers, segmentation, Share, Forecast, Competition, Insights, Growth, Pricing, Size, Demand, Value, Companies, Trends, Challenges, Investment Opportunities, Analysis
- Morocco Polyhydroxybutyrate-co-Hydroxyvalerate Market (2026-2032) | Outlook, Investment Opportunities, Restraints, Strategy, Forecast, Challenges, Drivers, Growth, Companies, segmentation, Trends, Size, Competition, Revenue, Demand, Insights, Share, Analysis, Value, Pricing
- Mexico Polyhydroxybutyrate-co-Hydroxyvalerate Market (2026-2032) | Size, Drivers, Outlook, Share, Strategy, Growth, Pricing, Challenges, Companies, Demand, Value, Investment Opportunities, Restraints, Trends, Forecast, segmentation, Analysis, Insights, Competition, Revenue
- Malaysia Polyhydroxybutyrate-co-Hydroxyvalerate Market (2026-2032) | Share, segmentation, Size, Companies, Analysis, Insights, Forecast, Value, Revenue, Drivers, Restraints, Challenges, Investment Opportunities, Trends, Competition, Strategy, Demand, Growth, Outlook, Pricing
Industry Events and Analyst Meet

HIMTEX 2026

India Refining Summit 2026

India EV Show 2026

EV tech India Expo 2026

Auto Tech Asia 2026
Whitepaper
- Middle East & Africa Commercial Security Market Click here to view more.
- Middle East & Africa Fire Safety Systems & Equipment Market Click here to view more.
- GCC Drone Market Click here to view more.
- Middle East Lighting Fixture Market Click here to view more.
- GCC Physical & Perimeter Security Market Click here to view more.
6WResearch In News
- Doha a strategic location for EV manufacturing hub: IPA Qatar
- Demand for luxury TVs surging in the GCC, says Samsung
- Empowering Growth: The Thriving Journey of Bangladesh’s Cable Industry
- Demand for luxury TVs surging in the GCC, says Samsung
- Video call with a traditional healer? Once unthinkable, it’s now common in South Africa
- Intelligent Buildings To Smooth GCC’s Path To Net Zero