Australia Storage Dewar and Dry Shipper Market (2026-2032) | Growth, Competitive Landscape, Companies, Forecast, Trends, Value, Size & Revenue, Share, Segmentation, Outlook, Industry, Analysis
Market Forecast By Product (Bench Top, Free Standing), By Liquid N2 Storage Capacity (1-20 Liters, 21-40 Liters, 40-60 Liters), By Material (Stainless Steel, Aluminum, Enameled Steel, Application), By Food & Beverages (Pharmaceuticals, Healthcare, Others), By Distribution Channel (B2B, Distributors & Dealers) And Competitive Landscape
| Product Code: ETC6192005 | Publication Date: Sep 2024 | Updated Date: Mar 2026 | Product Type: Market Research Report | |
| Publisher: 6Wresearch | Author: Dhaval Chaurasia | No. of Pages: 75 | No. of Figures: 35 | No. of Tables: 20 |
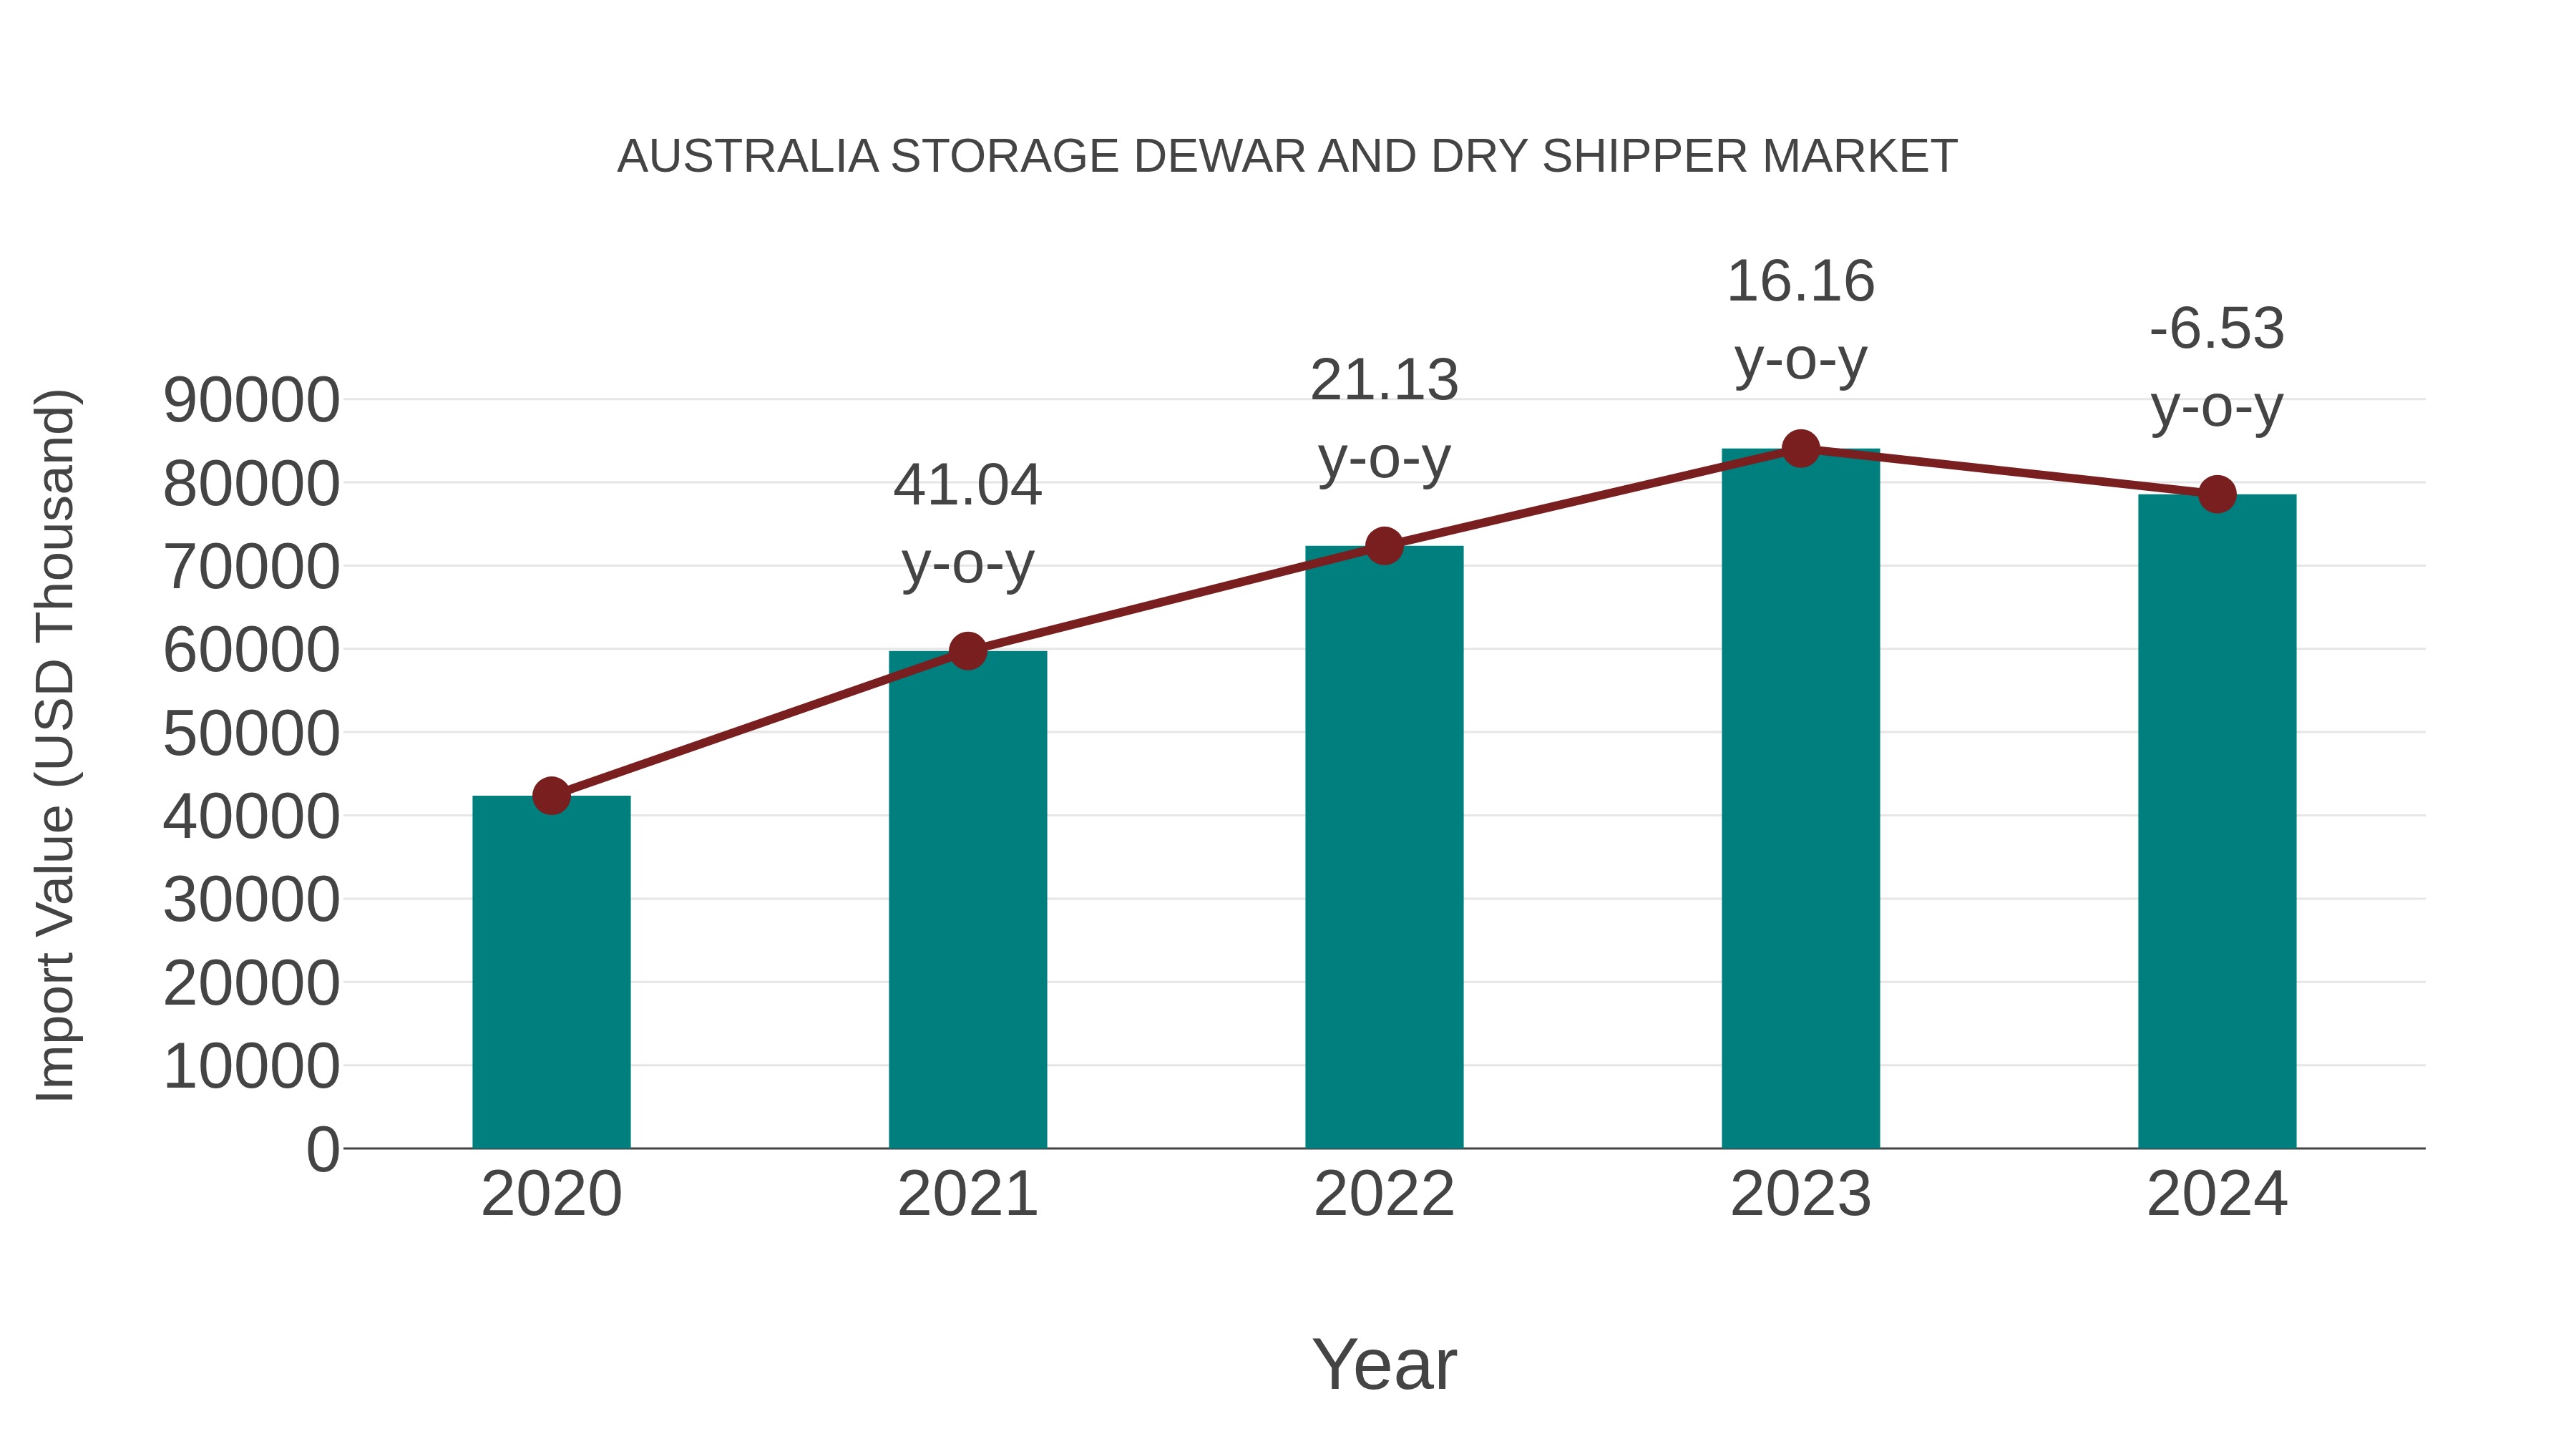
Australia Storage Dewar and Dry Shipper Market: Import Trend Analysis
Australia`s import trend for storage dewar and dry shipper equipment experienced a decline from 2023 to 2024, with a growth rate of -6.53%. However, the compound annual growth rate (CAGR) for the period 2020-2024 stood at a healthy 16.7%. This decline in import momentum in 2024 could be attributed to shifting demand patterns or changes in trade policies impacting the market stability during that period.
Australia Storage Dewar And Dry Shipper Market Overview
The storage Dewar and dry shipper market in Australia supports sectors such as biotechnology, pharmaceuticals, and cryogenic logistics. These containers are essential for transporting biological samples, vaccines, and cell cultures. Increased R&D activity and demand for secure cold chain transport are driving market expansion.
Trends of the market
This niche market is experiencing growth in scientific and healthcare sectors, driven by increased demand for cryogenic transport and storage of biological samples. The rise in biobanking, stem cell research, and vaccine storage is contributing to the adoption of Dewars and dry shippers, with a focus on safety and regulatory compliance.
Challenges of the market
This market faces issues related to the high cost and fragility of Dewar and dry shipper systems. Stringent regulatory requirements for transporting biological samples and hazardous materials further complicate market logistics and operations.
Investment opportunities in the Market
The Dewar and dry shipper market in Australia benefits from growing demand in biotech, pharmaceuticals, and reproductive health sectors. Investment opportunities exist in cold chain logistics, customized shipper manufacturing, and reusable container technologies. Local production facilities and partnerships with medical institutions and research labs can support rapid market expansion.
Government Policy of the market
These storage systems, essential for cryogenic transport of biological materials, fall under strict biosecurity, health, and transport safety regulations. The TGA oversees their use in medical logistics, while the Department of Health and the Office of the Gene Technology Regulator (OGTR) influence usage in clinical trials and biomedical research. Policies supporting cold chain infrastructure for vaccines and genetic material transport further support this market.
Key Highlights of the Report:
- Australia Storage Dewar and Dry Shipper Market Outlook
- Market Size of Australia Storage Dewar and Dry Shipper Market, 2025
- Forecast of Australia Storage Dewar and Dry Shipper Market, 2032
- Historical Data and Forecast of Australia Storage Dewar and Dry Shipper Revenues & Volume for the Period 2022 - 2032F
- Australia Storage Dewar and Dry Shipper Market Trend Evolution
- Australia Storage Dewar and Dry Shipper Market Drivers and Challenges
- Australia Storage Dewar and Dry Shipper Price Trends
- Australia Storage Dewar and Dry Shipper Porter's Five Forces
- Australia Storage Dewar and Dry Shipper Industry Life Cycle
- Historical Data and Forecast of Australia Storage Dewar and Dry Shipper Market Revenues & Volume By Product for the Period 2022 - 2032F
- Historical Data and Forecast of Australia Storage Dewar and Dry Shipper Market Revenues & Volume By Bench Top for the Period 2022 - 2032F
- Historical Data and Forecast of Australia Storage Dewar and Dry Shipper Market Revenues & Volume By Free Standing for the Period 2022 - 2032F
- Historical Data and Forecast of Australia Storage Dewar and Dry Shipper Market Revenues & Volume By Liquid N2 Storage Capacity for the Period 2022 - 2032F
- Historical Data and Forecast of Australia Storage Dewar and Dry Shipper Market Revenues & Volume By 1-20 Liters for the Period 2022 - 2032F
- Historical Data and Forecast of Australia Storage Dewar and Dry Shipper Market Revenues & Volume By 21-40 Liters for the Period 2022 - 2032F
- Historical Data and Forecast of Australia Storage Dewar and Dry Shipper Market Revenues & Volume By 40-60 Liters for the Period 2022 - 2032F
- Historical Data and Forecast of Australia Storage Dewar and Dry Shipper Market Revenues & Volume By Material for the Period 2022 - 2032F
- Historical Data and Forecast of Australia Storage Dewar and Dry Shipper Market Revenues & Volume By Stainless Steel for the Period 2022 - 2032F
- Historical Data and Forecast of Australia Storage Dewar and Dry Shipper Market Revenues & Volume By Aluminum for the Period 2022 - 2032F
- Historical Data and Forecast of Australia Storage Dewar and Dry Shipper Market Revenues & Volume By Enameled Steel for the Period 2022 - 2032F
- Historical Data and Forecast of Australia Storage Dewar and Dry Shipper Market Revenues & Volume By Application for the Period 2022 - 2032F
- Historical Data and Forecast of Australia Storage Dewar and Dry Shipper Market Revenues & Volume By Food & Beverages for the Period 2022 - 2032F
- Historical Data and Forecast of Australia Storage Dewar and Dry Shipper Market Revenues & Volume By Pharmaceuticals for the Period 2022 - 2032F
- Historical Data and Forecast of Australia Storage Dewar and Dry Shipper Market Revenues & Volume By Healthcare for the Period 2022 - 2032F
- Historical Data and Forecast of Australia Storage Dewar and Dry Shipper Market Revenues & Volume By Others for the Period 2022 - 2032F
- Historical Data and Forecast of Australia Storage Dewar and Dry Shipper Market Revenues & Volume By Distribution Channel for the Period 2022 - 2032F
- Historical Data and Forecast of Australia Storage Dewar and Dry Shipper Market Revenues & Volume By B2B for the Period 2022 - 2032F
- Historical Data and Forecast of Australia Storage Dewar and Dry Shipper Market Revenues & Volume By Distributors & Dealers for the Period 2022 - 2032F
- Australia Storage Dewar and Dry Shipper Import Export Trade Statistics
- Market Opportunity Assessment By Product
- Market Opportunity Assessment By Liquid N2 Storage Capacity
- Market Opportunity Assessment By Material
- Market Opportunity Assessment By Food & Beverages
- Market Opportunity Assessment By Distribution Channel
- Australia Storage Dewar and Dry Shipper Top Companies Market Share
- Australia Storage Dewar and Dry Shipper Competitive Benchmarking By Technical and Operational Parameters
- Australia Storage Dewar and Dry Shipper Company Profiles
- Australia Storage Dewar and Dry Shipper Key Strategic Recommendations
Australia Storage Dewar and Dry Shipper Market (2026-2032): FAQs
6Wresearch actively monitors the Australia Storage Dewar and Dry Shipper Market and publishes its comprehensive annual report, highlighting emerging trends, growth drivers, revenue analysis, and forecast outlook. Our insights help businesses to make data-backed strategic decisions with ongoing market dynamics. Our analysts track relevent industries related to the Australia Storage Dewar and Dry Shipper Market, allowing our clients with actionable intelligence and reliable forecasts tailored to emerging regional needs.
Yes, we provide customisation as per your requirements. To learn more, feel free to contact us on sales@6wresearch.com
1 Executive Summary |
2 Introduction |
2.1 Key Highlights of the Report |
2.2 Report Description |
2.3 Market Scope & Segmentation |
2.4 Research Methodology |
2.5 Assumptions |
3 Australia Storage Dewar and Dry Shipper Market Overview |
3.1 Australia Country Macro Economic Indicators |
3.2 Australia Storage Dewar and Dry Shipper Market Revenues & Volume, 2022 & 2032F |
3.3 Australia Storage Dewar and Dry Shipper Market - Industry Life Cycle |
3.4 Australia Storage Dewar and Dry Shipper Market - Porter's Five Forces |
3.5 Australia Storage Dewar and Dry Shipper Market Revenues & Volume Share, By Product, 2022 & 2032F |
3.6 Australia Storage Dewar and Dry Shipper Market Revenues & Volume Share, By Liquid N2 Storage Capacity, 2022 & 2032F |
3.7 Australia Storage Dewar and Dry Shipper Market Revenues & Volume Share, By Material, 2022 & 2032F |
3.8 Australia Storage Dewar and Dry Shipper Market Revenues & Volume Share, By Food & Beverages, 2022 & 2032F |
3.9 Australia Storage Dewar and Dry Shipper Market Revenues & Volume Share, By Distribution Channel, 2022 & 2032F |
4 Australia Storage Dewar and Dry Shipper Market Dynamics |
4.1 Impact Analysis |
4.2 Market Drivers |
4.2.1 Increasing demand for cryopreservation in research and healthcare sectors |
4.2.2 Growth in the biotechnology and pharmaceutical industries in Australia |
4.2.3 Technological advancements leading to improved efficiency and performance of storage dewars and dry shippers |
4.3 Market Restraints |
4.3.1 Stringent regulatory requirements for handling and transporting biological samples |
4.3.2 High initial investment costs associated with purchasing storage dewars and dry shippers |
4.3.3 Competition from alternative storage technologies such as liquid nitrogen freezers |
5 Australia Storage Dewar and Dry Shipper Market Trends |
6 Australia Storage Dewar and Dry Shipper Market, By Types |
6.1 Australia Storage Dewar and Dry Shipper Market, By Product |
6.1.1 Overview and Analysis |
6.1.2 Australia Storage Dewar and Dry Shipper Market Revenues & Volume, By Product, 2022 - 2032F |
6.1.3 Australia Storage Dewar and Dry Shipper Market Revenues & Volume, By Bench Top, 2022 - 2032F |
6.1.4 Australia Storage Dewar and Dry Shipper Market Revenues & Volume, By Free Standing, 2022 - 2032F |
6.2 Australia Storage Dewar and Dry Shipper Market, By Liquid N2 Storage Capacity |
6.2.1 Overview and Analysis |
6.2.2 Australia Storage Dewar and Dry Shipper Market Revenues & Volume, By 1-20 Liters, 2022 - 2032F |
6.2.3 Australia Storage Dewar and Dry Shipper Market Revenues & Volume, By 21-40 Liters, 2022 - 2032F |
6.2.4 Australia Storage Dewar and Dry Shipper Market Revenues & Volume, By 40-60 Liters, 2022 - 2032F |
6.3 Australia Storage Dewar and Dry Shipper Market, By Material |
6.3.1 Overview and Analysis |
6.3.2 Australia Storage Dewar and Dry Shipper Market Revenues & Volume, By Stainless Steel, 2022 - 2032F |
6.3.3 Australia Storage Dewar and Dry Shipper Market Revenues & Volume, By Aluminum, 2022 - 2032F |
6.3.4 Australia Storage Dewar and Dry Shipper Market Revenues & Volume, By Enameled Steel, 2022 - 2032F |
6.3.5 Australia Storage Dewar and Dry Shipper Market Revenues & Volume, By Application, 2022 - 2032F |
6.4 Australia Storage Dewar and Dry Shipper Market, By Food & Beverages |
6.4.1 Overview and Analysis |
6.4.2 Australia Storage Dewar and Dry Shipper Market Revenues & Volume, By Pharmaceuticals, 2022 - 2032F |
6.4.3 Australia Storage Dewar and Dry Shipper Market Revenues & Volume, By Healthcare, 2022 - 2032F |
6.4.4 Australia Storage Dewar and Dry Shipper Market Revenues & Volume, By Others, 2022 - 2032F |
6.5 Australia Storage Dewar and Dry Shipper Market, By Distribution Channel |
6.5.1 Overview and Analysis |
6.5.2 Australia Storage Dewar and Dry Shipper Market Revenues & Volume, By B2B, 2022 - 2032F |
6.5.3 Australia Storage Dewar and Dry Shipper Market Revenues & Volume, By Distributors & Dealers, 2022 - 2032F |
7 Australia Storage Dewar and Dry Shipper Market Import-Export Trade Statistics |
7.1 Australia Storage Dewar and Dry Shipper Market Export to Major Countries |
7.2 Australia Storage Dewar and Dry Shipper Market Imports from Major Countries |
8 Australia Storage Dewar and Dry Shipper Market Key Performance Indicators |
8.1 Adoption rate of cryopreservation techniques in research and healthcare institutions |
8.2 Number of new product launches and technological innovations in the storage dewar and dry shipper market |
8.3 Utilization rate of storage dewars and dry shippers in key industries such as biotechnology and pharmaceuticals |
9 Australia Storage Dewar and Dry Shipper Market - Opportunity Assessment |
9.1 Australia Storage Dewar and Dry Shipper Market Opportunity Assessment, By Product, 2022 & 2032F |
9.2 Australia Storage Dewar and Dry Shipper Market Opportunity Assessment, By Liquid N2 Storage Capacity, 2022 & 2032F |
9.3 Australia Storage Dewar and Dry Shipper Market Opportunity Assessment, By Material, 2022 & 2032F |
9.4 Australia Storage Dewar and Dry Shipper Market Opportunity Assessment, By Food & Beverages, 2022 & 2032F |
9.5 Australia Storage Dewar and Dry Shipper Market Opportunity Assessment, By Distribution Channel, 2022 & 2032F |
10 Australia Storage Dewar and Dry Shipper Market - Competitive Landscape |
10.1 Australia Storage Dewar and Dry Shipper Market Revenue Share, By Companies, 2025 |
10.2 Australia Storage Dewar and Dry Shipper Market Competitive Benchmarking, By Operating and Technical Parameters |
11 Company Profiles |
12 Recommendations |
13 Disclaimer |
Global Go To Market Strategy - 2030
Export potential enables firms to identify high-growth global markets with greater confidence by combining advanced trade intelligence with a structured quantitative methodology. The framework analyzes emerging demand trends and country-level import patterns while integrating macroeconomic and trade datasets such as GDP and population forecasts, bilateral import–export flows, tariff structures, elasticity differentials between developed and developing economies, geographic distance, and import demand projections. Using weighted trade values from 2020–2024 as the base period to project country-to-country export potential for 2030, these inputs are operationalized through calculated drivers such as gravity model parameters, tariff impact factors, and projected GDP per-capita growth. Through an analysis of hidden potentials, demand hotspots, and market conditions that are most favorable to success, this method enables firms to focus on target countries, maximize returns, and global expansion with data, backed by accuracy.
By factoring in the projected importer demand gap that is currently unmet and could be potential opportunity, it identifies the potential for the Exporter (Country) among 190 countries, against the general trade analysis, which identifies the biggest importer or exporter.
To discover high-growth global markets and optimize your business strategy:
Click Here
Pricing
- Single User License$ 1,995
- Department License$ 2,400
- Site License$ 3,120
- Global License$ 3,795

Leadership Perspectives from Industry Events
Search
Thought Leadership and Analyst Meet


Our Clients
6WResearch In News
- India Export Attractiveness Tracker 2026
- India Air Conditioner Market Set for Strong Rebound in 2026 After Weather-Led Correction and GST-Driven Recovery: 6Wresearch
- ADAS in India: How Automatic Emergency Braking, Blind Spot Detection & Driver Monitoring are Transforming Road Safety
- Doha a strategic location for EV manufacturing hub: IPA Qatar
- Demand for luxury TVs surging in the GCC, says Samsung
- Empowering Growth: The Thriving Journey of Bangladesh’s Cable Industry
Latest Reports
- Nicaragua RPG Gaming Market (2026-2032)
- New Zealand RPG Gaming Market (2026-2032)
- Netherlands RPG Gaming Market (2026-2032)
- Nauru RPG Gaming Market (2026-2032)
- Namibia RPG Gaming Market (2026-2032)
- Mozambique RPG Gaming Market (2026-2032)
- Montenegro RPG Gaming Market (2026-2032)
- Mongolia RPG Gaming Market (2026-2032)
- Monaco RPG Gaming Market (2026-2032)
- Micronesia RPG Gaming Market (2026-2032)
Industry Events and Analyst Meet

EV India Expo 2026

HIMTEX 2026

India Refining Summit 2026

India EV Show 2026

EV tech India Expo 2026
Whitepaper
- Middle East & Africa Commercial Security Market Click here to view more.
- Middle East & Africa Fire Safety Systems & Equipment Market Click here to view more.
- GCC Drone Market Click here to view more.
- Middle East Lighting Fixture Market Click here to view more.
- GCC Physical & Perimeter Security Market Click here to view more.