Austria Acrylonitrile Market (2026-2032) | Size, Forecast, Industry, Growth, Trends, Value, Segmentation, Share, Outlook, Analysis, Revenue & Companies
Market Forecast By Application (Acrylic Fiber, Adiponitrile, Styrene Acrylonitrile, Acrylonitrile Butadiene Styrene, Acrylamide, Carbon Fiber, Nitrile Rubber, Others) And Competitive Landscape
| Product Code: ETC4783610 | Publication Date: Nov 2023 | Updated Date: Apr 2026 | Product Type: Market Research Report | |
| Publisher: 6Wresearch | Author: Shubham Padhi | No. of Pages: 60 | No. of Figures: 30 | No. of Tables: 5 |
Austria Acrylonitrile Market Size (2020-2030)
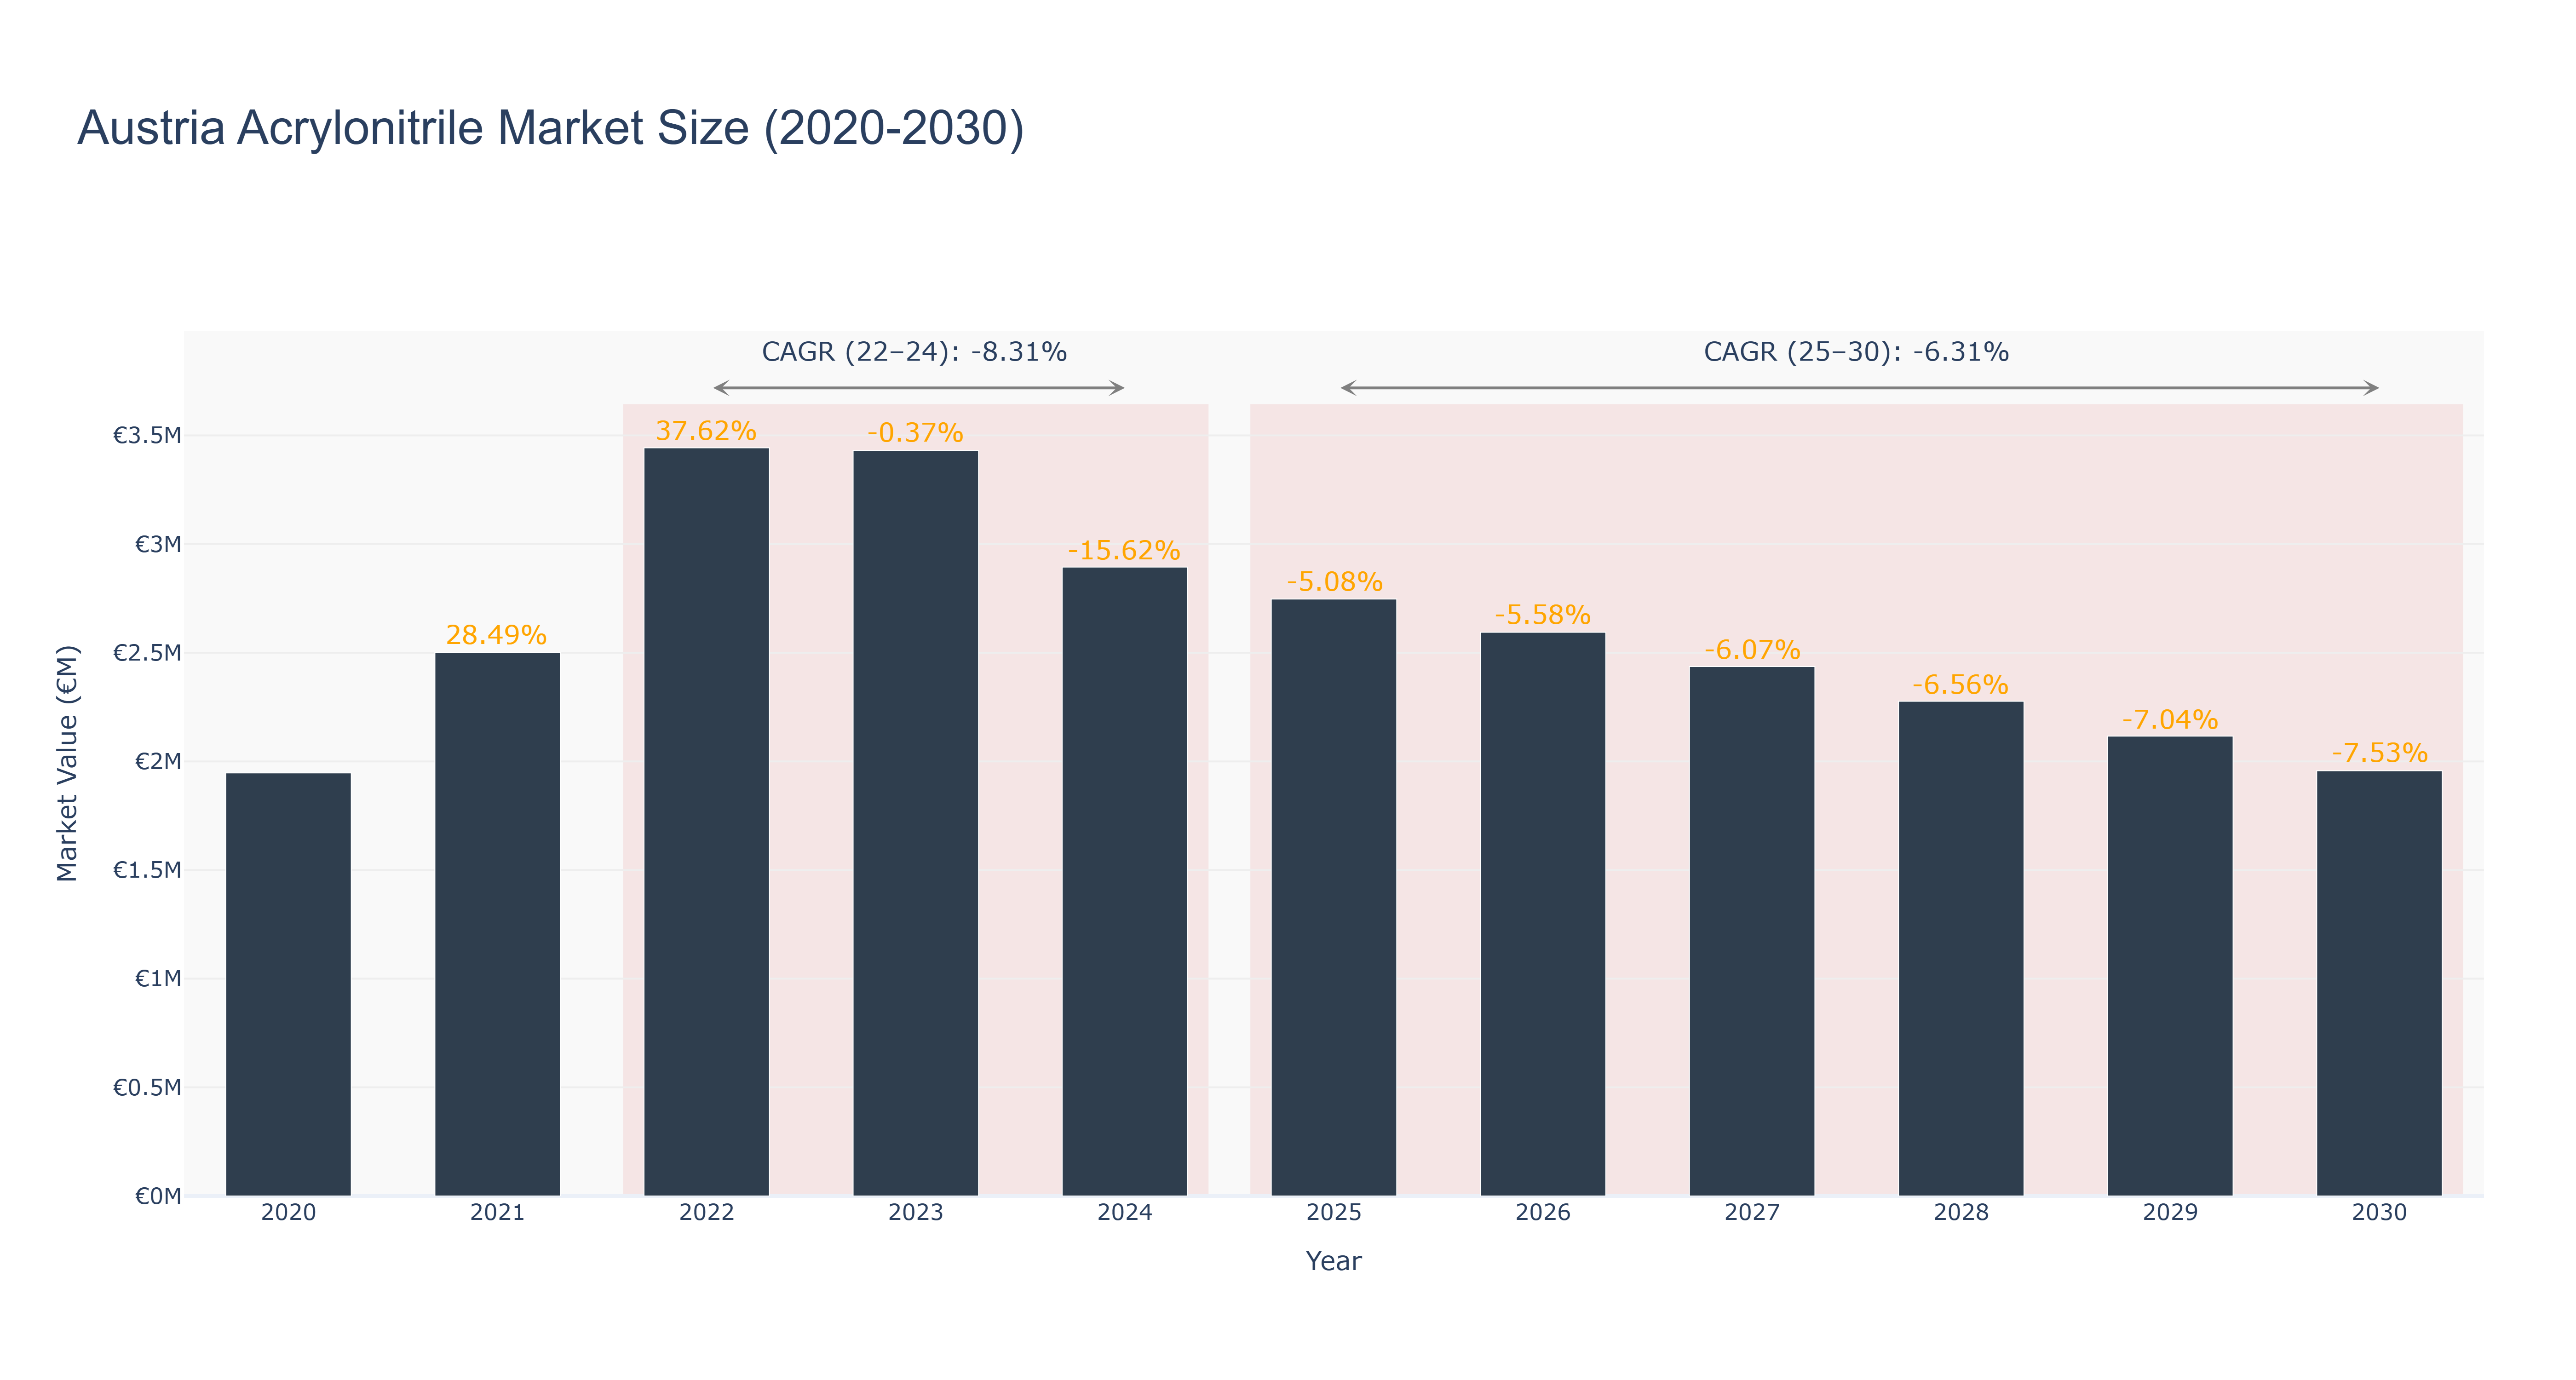
Austria's Acrylonitrile market witnessed a peak in 2022 with a market size of €3.44 million, followed by a decline to €2.59 million in 2026. The market is forecasted to continue shrinking, reaching €1.96 million by 2030, with a CAGR of -6.31% from 2025 to 2030. The decline in market size can be attributed to various factors such as changing consumer preferences, economic uncertainties, and technological advancements impacting the industry. Despite the current downturn, upcoming projects in sustainable production methods and enhanced supply chain management are expected to revitalize the market in the near future. Industry drivers like environmental regulations and demand for eco-friendly products will play a crucial role in shaping the future trajectory of the Austria Acrylonitrile market.
Austria Acrylonitrile Market: Production & Trade Performance (2019-2025)
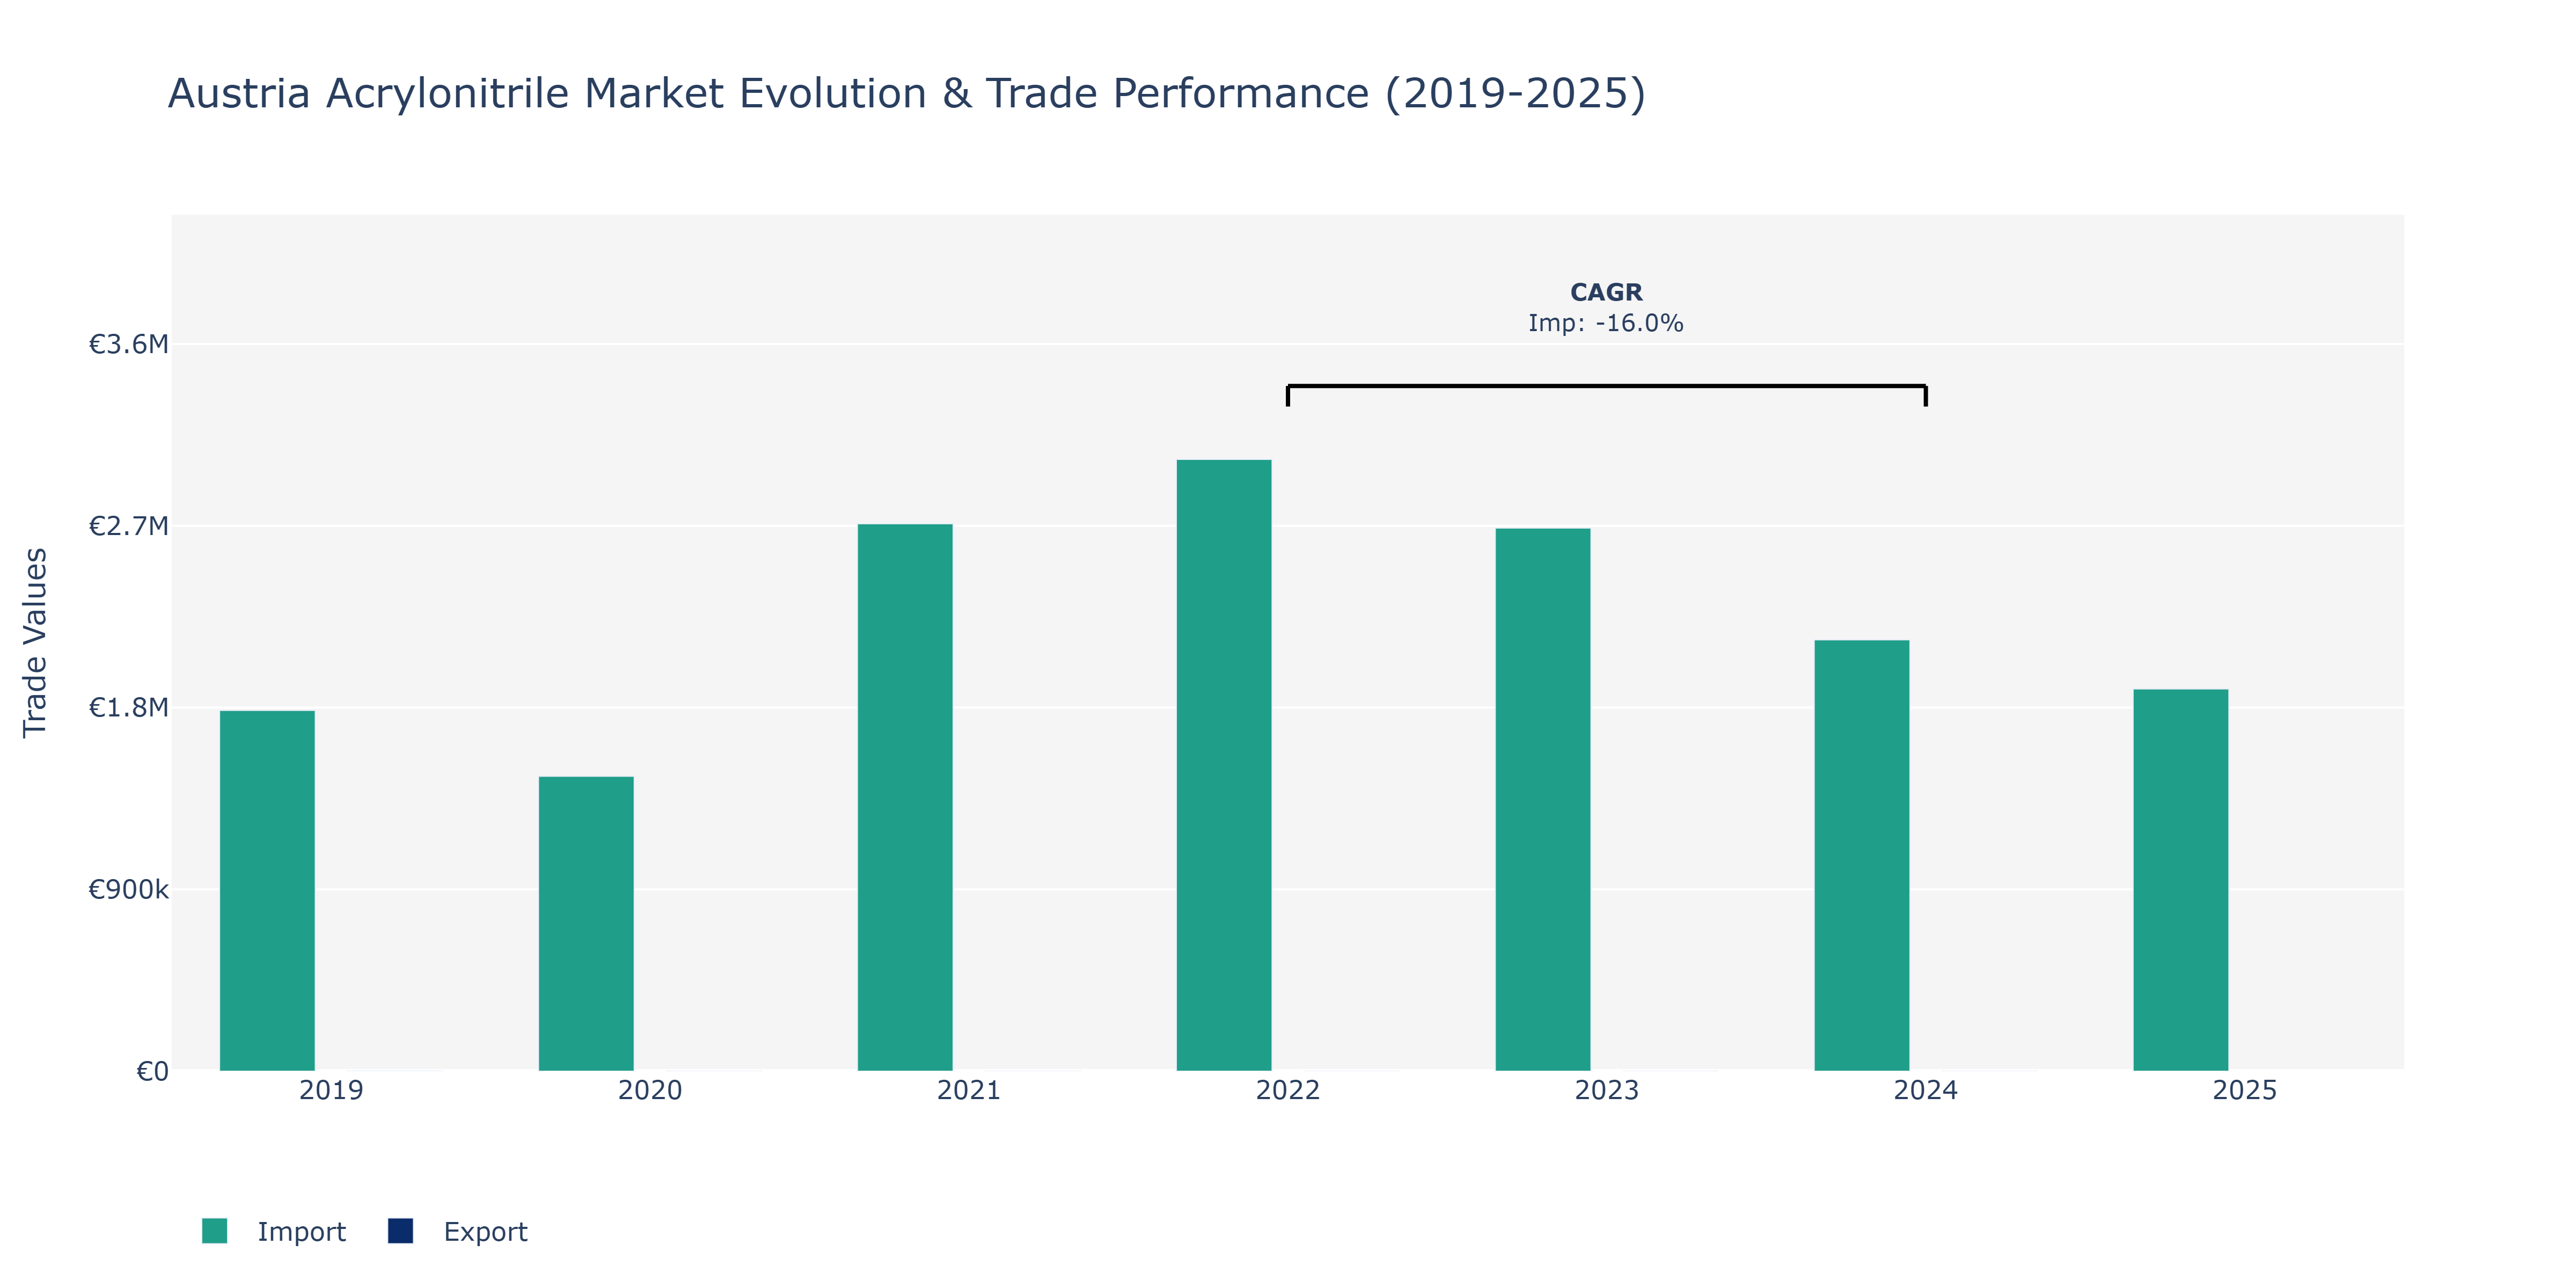
In the Austria Acrylonitrile Market, exports experienced a notable downward trend from 2019 to 2023, dropping from €660.0 million to €38.0 million. This decline can be attributed to various factors such as changes in global demand, competitive pricing strategies by other market players, or shifts in consumer preferences towards alternative products. On the other hand, imports fluctuated over the years, with a peak in 2021 at €2.71 billion, followed by a decrease in 2022 to €3.03 billion. The sudden decline in imports in 2022, coupled with a negative import CAGR of -16.03% from 2022 to 2024, may indicate changing market dynamics, supply chain disruptions, or regulatory changes impacting trade volumes. The market's performance in 2025 saw imports at around €1.89 billion, suggesting a potential stabilization in the import levels. To adapt to these market shifts, companies operating in the Austria Acrylonitrile Market may need to focus on enhancing operational efficiency, diversifying supply chains, and closely monitoring global trade policies to navigate uncertainties effectively.
Key Highlights of the Report:
- Austria Acrylonitrile Market Outlook
- Market Size of Austria Acrylonitrile Market, 2025
- Forecast of Austria Acrylonitrile Market, 2032
- Historical Data and Forecast of Austria Acrylonitrile Revenues & Volume for the Period 2022-2032F
- Austria Acrylonitrile Market Trend Evolution
- Austria Acrylonitrile Market Drivers and Challenges
- Austria Acrylonitrile Price Trends
- Austria Acrylonitrile Porter`s Five Forces
- Austria Acrylonitrile Industry Life Cycle
- Historical Data and Forecast of Austria Acrylonitrile Market Revenues & Volume By Application for the Period 2022-2032F
- Historical Data and Forecast of Austria Acrylonitrile Market Revenues & Volume By Acrylic Fiber for the Period 2022-2032F
- Historical Data and Forecast of Austria Acrylonitrile Market Revenues & Volume By Adiponitrile for the Period 2022-2032F
- Historical Data and Forecast of Austria Acrylonitrile Market Revenues & Volume By Styrene Acrylonitrile for the Period 2022-2032F
- Historical Data and Forecast of Austria Acrylonitrile Market Revenues & Volume By Acrylonitrile Butadiene Styrene for the Period 2022-2032F
- Historical Data and Forecast of Austria Acrylonitrile Market Revenues & Volume By Acrylamide for the Period 2022-2032F
- Historical Data and Forecast of Austria Acrylonitrile Market Revenues & Volume By Carbon Fiber for the Period 2022-2032F
- Historical Data and Forecast of Austria Acrylonitrile Market Revenues & Volume By Nitrile Rubber for the Period 2022-2032F
- Historical Data and Forecast of Austria Acrylic Fiber Acrylonitrile Market Revenues & Volume By Others for the Period 2022-2032F
- Austria Acrylonitrile Import Export Trade Statistics
- Market Opportunity Assessment By Application
- Austria Acrylonitrile Top Companies Market Share
- Austria Acrylonitrile Competitive Benchmarking By Technical and Operational Parameters
- Austria Acrylonitrile Company Profiles
- Austria Acrylonitrile Key Strategic Recommendations
Frequently Asked Questions About the Market Study (FAQs):
6Wresearch actively monitors the Austria Acrylonitrile Market and publishes its comprehensive annual report, highlighting emerging trends, growth drivers, revenue analysis, and forecast outlook. Our insights help businesses to make data-backed strategic decisions with ongoing market dynamics. Our analysts track relevent industries related to the Austria Acrylonitrile Market, allowing our clients with actionable intelligence and reliable forecasts tailored to emerging regional needs.
Yes, we provide customisation as per your requirements. To learn more, feel free to contact us on sales@6wresearch.com
1 Executive Summary |
2 Introduction |
2.1 Key Highlights of the Report |
2.2 Report Description |
2.3 Market Scope & Segmentation |
2.4 Research Methodology |
2.5 Assumptions |
3 Austria Acrylonitrile Market Overview |
3.1 Austria Country Macro Economic Indicators |
3.2 Austria Acrylonitrile Market Revenues & Volume, 2022 & 2032F |
3.3 Austria Acrylonitrile Market - Industry Life Cycle |
3.4 Austria Acrylonitrile Market - Porter's Five Forces |
3.5 Austria Acrylonitrile Market Revenues & Volume Share, By Application, 2022 & 2032F |
4 Austria Acrylonitrile Market Dynamics |
4.1 Impact Analysis |
4.2 Market Drivers |
4.2.1 Growth in demand from end-use industries such as automotive, textiles, and electronics |
4.2.2 Increasing investments in research and development to improve product quality and efficiency |
4.2.3 Favorable government regulations promoting the use of acrylonitrile in various applications |
4.3 Market Restraints |
4.3.1 Fluctuating raw material prices, such as propylene and ammonia, impacting production costs |
4.3.2 Environmental concerns and regulations related to the production and disposal of acrylonitrile |
4.3.3 Intense competition from alternative materials like polyester and polypropylene |
5 Austria Acrylonitrile Market Trends |
6 Austria Acrylonitrile Market Segmentations |
6.1 Austria Acrylonitrile Market, By Application |
6.1.1 Overview and Analysis |
6.1.2 Austria Acrylonitrile Market Revenues & Volume, By Acrylic Fiber, 2022-2032F |
6.1.3 Austria Acrylonitrile Market Revenues & Volume, By Adiponitrile, 2022-2032F |
6.1.4 Austria Acrylonitrile Market Revenues & Volume, By Styrene Acrylonitrile, 2022-2032F |
6.1.5 Austria Acrylonitrile Market Revenues & Volume, By Acrylonitrile Butadiene Styrene, 2022-2032F |
6.1.6 Austria Acrylonitrile Market Revenues & Volume, By Acrylamide, 2022-2032F |
6.1.7 Austria Acrylonitrile Market Revenues & Volume, By Carbon Fiber, 2022-2032F |
6.1.9 Austria Acrylonitrile Market Revenues & Volume, By Others, 2022-2032F |
6.1.10 Austria Acrylonitrile Market Revenues & Volume, By Others, 2022-2032F |
7 Austria Acrylonitrile Market Import-Export Trade Statistics |
7.1 Austria Acrylonitrile Market Export to Major Countries |
7.2 Austria Acrylonitrile Market Imports from Major Countries |
8 Austria Acrylonitrile Market Key Performance Indicators |
8.1 Capacity utilization rate of acrylonitrile production facilities in Austria |
8.2 Research and development expenditure as a percentage of total revenue for acrylonitrile manufacturers |
8.3 Adoption rate of innovative acrylonitrile-based products in key end-use industries |
9 Austria Acrylonitrile Market - Opportunity Assessment |
9.1 Austria Acrylonitrile Market Opportunity Assessment, By Application, 2022 & 2032F |
10 Austria Acrylonitrile Market - Competitive Landscape |
10.1 Austria Acrylonitrile Market Revenue Share, By Companies, 2025 |
10.2 Austria Acrylonitrile Market Competitive Benchmarking, By Operating and Technical Parameters |
11 Company Profiles |
12 Recommendations | 13 Disclaimer |
Export potential assessment - trade Analytics for 2030
Export potential enables firms to identify high-growth global markets with greater confidence by combining advanced trade intelligence with a structured quantitative methodology. The framework analyzes emerging demand trends and country-level import patterns while integrating macroeconomic and trade datasets such as GDP and population forecasts, bilateral import–export flows, tariff structures, elasticity differentials between developed and developing economies, geographic distance, and import demand projections. Using weighted trade values from 2020–2024 as the base period to project country-to-country export potential for 2030, these inputs are operationalized through calculated drivers such as gravity model parameters, tariff impact factors, and projected GDP per-capita growth. Through an analysis of hidden potentials, demand hotspots, and market conditions that are most favorable to success, this method enables firms to focus on target countries, maximize returns, and global expansion with data, backed by accuracy.
By factoring in the projected importer demand gap that is currently unmet and could be potential opportunity, it identifies the potential for the Exporter (Country) among 190 countries, against the general trade analysis, which identifies the biggest importer or exporter.
To discover high-growth global markets and optimize your business strategy:
Click Here
Pricing
- Single User License$ 1,995
- Department License$ 2,400
- Site License$ 3,120
- Global License$ 3,795

Search
Thought Leadership and Analyst Meet


Our Clients
Latest Reports
- Syria Air Conditioner Market (2026-2032) | Outlook, Competition, Drivers, Trends, Demand, Competitive, Strategic Insights, Companies, Challenges, Strategy, Consumer Insights, Analysis, Opportunities, Growth, Size, Share, Industry, Revenue, Segments, Value, Segmentation, Supply, Forecast, Restraints,
- Philippines Polyhydroxybutyrate-co-Hydroxyvalerate Market (2026-2032) | Trends, Insights, Challenges, Restraints, Competition, Size, Value, Forecast, Pricing, Share, Outlook, Revenue, Investment Opportunities, Strategy, Drivers, Demand, Growth, segmentation, Analysis, Companies
- Peru Polyhydroxybutyrate-co-Hydroxyvalerate Market (2026-2032) | Growth, Demand, Challenges, Share, Trends, Analysis, Pricing, Investment Opportunities, Drivers, Value, Forecast, Competition, Size, Companies, Insights, Outlook, Restraints, segmentation, Revenue, Strategy
- Pakistan Polyhydroxybutyrate-co-Hydroxyvalerate Market (2026-2032) | Restraints, segmentation, Pricing, Forecast, Share, Strategy, Competition, Trends, Insights, Drivers, Challenges, Growth, Revenue, Outlook, Value, Investment Opportunities, Companies, Size, Analysis, Demand
- Oman Polyhydroxybutyrate-co-Hydroxyvalerate Market (2026-2032) | Drivers, segmentation, Insights, Competition, Pricing, Outlook, Size, Revenue, Challenges, Forecast, Analysis, Growth, Value, Share, Trends, Investment Opportunities, Strategy, Restraints, Companies, Demand
- Nigeria Polyhydroxybutyrate-co-Hydroxyvalerate Market (2026-2032) | Value, Investment Opportunities, Analysis, Revenue, Restraints, Pricing, Outlook, Competition, Demand, Growth, Forecast, Companies, Trends, Challenges, segmentation, Drivers, Insights, Share, Size, Strategy
- Nepal Polyhydroxybutyrate-co-Hydroxyvalerate Market (2026-2032) | Insights, Analysis, Drivers, Share, Revenue, Demand, segmentation, Investment Opportunities, Competition, Forecast, Growth, Pricing, Companies, Strategy, Trends, Restraints, Challenges, Outlook, Size, Value
- Myanmar Polyhydroxybutyrate-co-Hydroxyvalerate Market (2026-2032) | Outlook, Revenue, Strategy, Restraints, Drivers, segmentation, Share, Forecast, Competition, Insights, Growth, Pricing, Size, Demand, Value, Companies, Trends, Challenges, Investment Opportunities, Analysis
- Morocco Polyhydroxybutyrate-co-Hydroxyvalerate Market (2026-2032) | Outlook, Investment Opportunities, Restraints, Strategy, Forecast, Challenges, Drivers, Growth, Companies, segmentation, Trends, Size, Competition, Revenue, Demand, Insights, Share, Analysis, Value, Pricing
- Mexico Polyhydroxybutyrate-co-Hydroxyvalerate Market (2026-2032) | Size, Drivers, Outlook, Share, Strategy, Growth, Pricing, Challenges, Companies, Demand, Value, Investment Opportunities, Restraints, Trends, Forecast, segmentation, Analysis, Insights, Competition, Revenue
Industry Events and Analyst Meet

HIMTEX 2026

India Refining Summit 2026

India EV Show 2026

EV tech India Expo 2026

Auto Tech Asia 2026
Whitepaper
- Middle East & Africa Commercial Security Market Click here to view more.
- Middle East & Africa Fire Safety Systems & Equipment Market Click here to view more.
- GCC Drone Market Click here to view more.
- Middle East Lighting Fixture Market Click here to view more.
- GCC Physical & Perimeter Security Market Click here to view more.
6WResearch In News
- Doha a strategic location for EV manufacturing hub: IPA Qatar
- Demand for luxury TVs surging in the GCC, says Samsung
- Empowering Growth: The Thriving Journey of Bangladesh’s Cable Industry
- Demand for luxury TVs surging in the GCC, says Samsung
- Video call with a traditional healer? Once unthinkable, it’s now common in South Africa
- Intelligent Buildings To Smooth GCC’s Path To Net Zero