Austria Butanediol Market (2026-2032) | Companies, Segmentation, Outlook, Share, Growth, Trends, Value, Competitive Landscape, Size & Revenue, Analysis, Industry, Forecast
Market Forecast By Type (Industrial Grade, Cosmetic Grade), By Application (PBT, THF, GBL, Polyurethane) And Competitive Landscape
| Product Code: ETC6197831 | Publication Date: Sep 2024 | Updated Date: Apr 2026 | Product Type: Market Research Report | |
| Publisher: 6Wresearch | Author: Summon Dutta | No. of Pages: 75 | No. of Figures: 35 | No. of Tables: 20 |
Austria Butanediol Market Size (2020-2030)
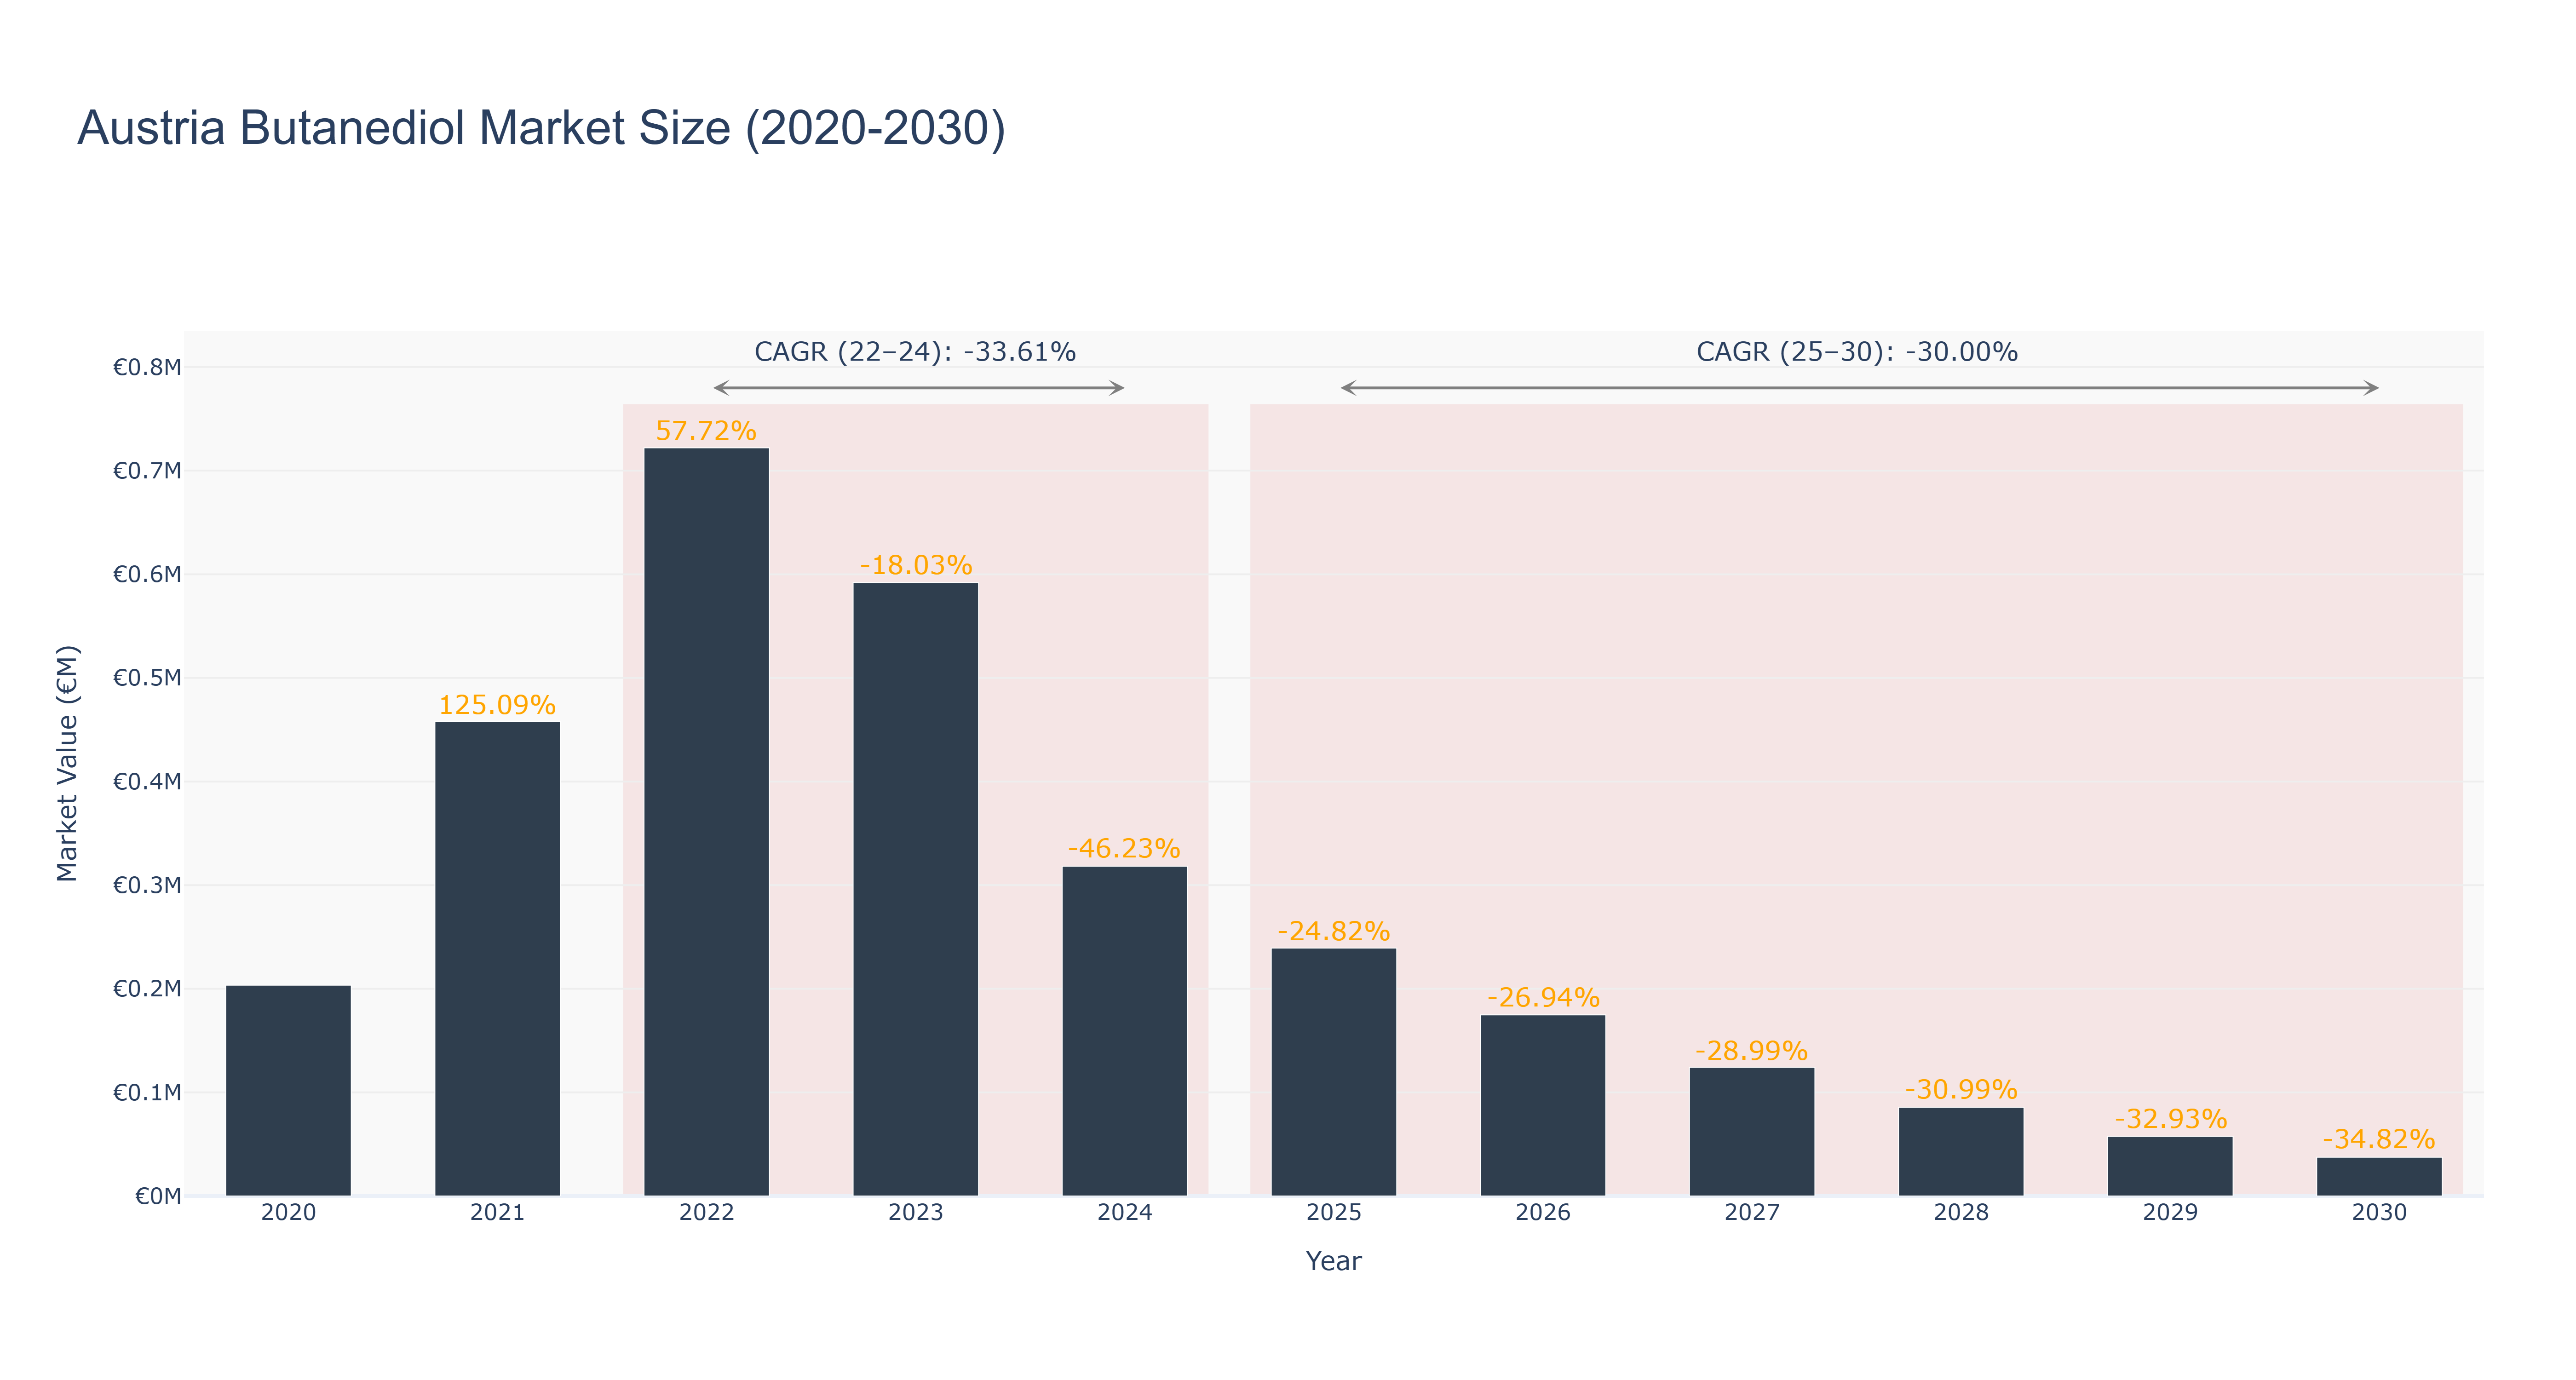
The Austria Butanediol Market experienced a peak market size of €0.72 million in 2022, followed by a decline to €0.32 million in 2024. The market is forecasted to further decrease to €0.04 million by 2030, with a CAGR of -30.0% from 2025 to 2030. The significant decrease in market size can be attributed to factors like changing consumer preferences, market saturation, and economic conditions. Despite the current downturn, the market is expected to witness new investments in sustainable production processes and innovative product development in the coming years. These initiatives aim to revitalize market growth and cater to evolving industry demands. Overall, the Austria Butanediol Market faces challenges but also opportunities for rejuvenation through strategic industry drivers and upcoming projects.
Austria Butanediol Market: Production & Trade Performance (2019-2025)
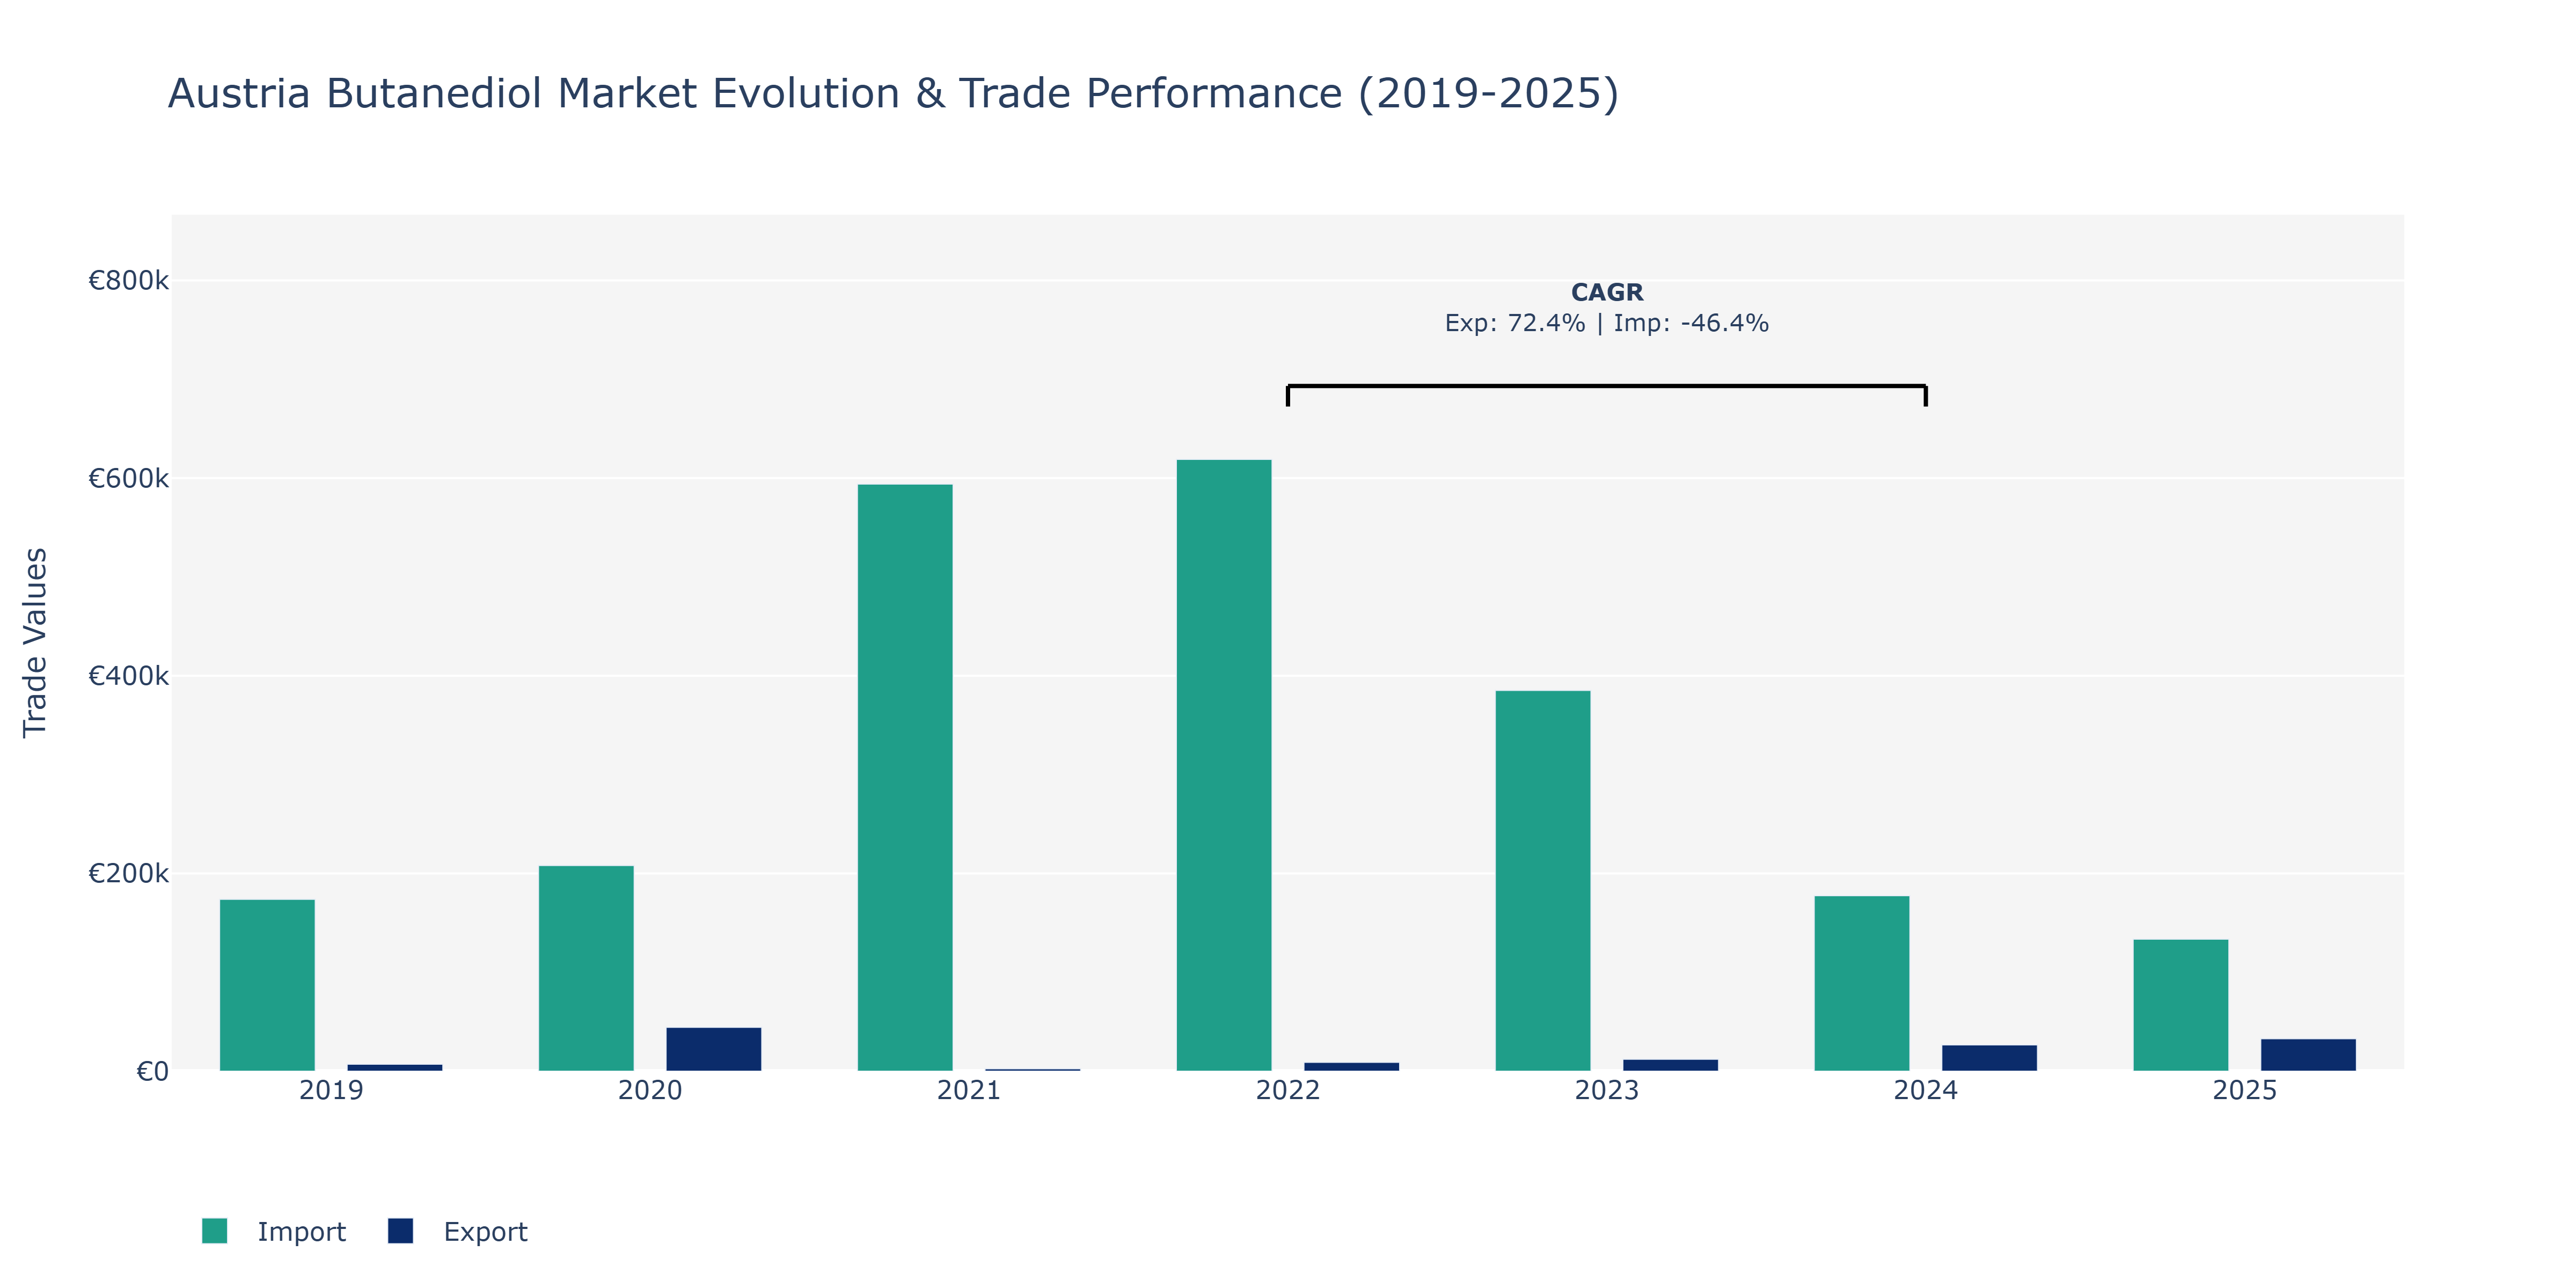
The Austria Butanediol Market witnessed fluctuations in both exports and imports over the years. In 2019, exports were at €7.04 thousand and imports at €173.82 thousand. A significant surge was observed in 2020, with exports reaching €44.39 thousand and imports at €208.01 thousand. However, 2021 saw a notable decline, with exports dropping to €2.4 thousand while imports spiked to €593.97 thousand. The following years showed recovery in exports, particularly in 2025 where exports peaked at €32.84 thousand, while imports decreased to €133.52 thousand. The market experienced a notable increase in exports from 2022 to 2024, with a compound annual growth rate of 72.4%. Conversely, imports declined by -46.43% during the same period. These fluctuations can be attributed to global economic conditions, trade policies, and evolving consumer demands within the chemicals industry. The market's recovery in exports could be linked to strategic alliances with key trading partners and the implementation of efficient supply chain management practices. On the other hand, the decrease in imports may have been influenced by shifts in sourcing strategies and efforts to promote domestic production of butanediol.
Key Highlights of the Report:
- Austria Butanediol Market Outlook
- Market Size of Austria Butanediol Market, 2025
- Forecast of Austria Butanediol Market, 2032
- Historical Data and Forecast of Austria Butanediol Revenues & Volume for the Period 2022-2032F
- Austria Butanediol Market Trend Evolution
- Austria Butanediol Market Drivers and Challenges
- Austria Butanediol Price Trends
- Austria Butanediol Porter's Five Forces
- Austria Butanediol Industry Life Cycle
- Historical Data and Forecast of Austria Butanediol Market Revenues & Volume By Type for the Period 2022-2032F
- Historical Data and Forecast of Austria Butanediol Market Revenues & Volume By Industrial Grade for the Period 2022-2032F
- Historical Data and Forecast of Austria Butanediol Market Revenues & Volume By Cosmetic Grade for the Period 2022-2032F
- Historical Data and Forecast of Austria Butanediol Market Revenues & Volume By Application for the Period 2022-2032F
- Historical Data and Forecast of Austria Butanediol Market Revenues & Volume By PBT for the Period 2022-2032F
- Historical Data and Forecast of Austria Butanediol Market Revenues & Volume By THF for the Period 2022-2032F
- Historical Data and Forecast of Austria Butanediol Market Revenues & Volume By GBL for the Period 2022-2032F
- Historical Data and Forecast of Austria Butanediol Market Revenues & Volume By Polyurethane for the Period 2022-2032F
- Austria Butanediol Import Export Trade Statistics
- Market Opportunity Assessment By Type
- Market Opportunity Assessment By Application
- Austria Butanediol Top Companies Market Share
- Austria Butanediol Competitive Benchmarking By Technical and Operational Parameters
- Austria Butanediol Company Profiles
- Austria Butanediol Key Strategic Recommendations
Frequently Asked Questions About the Market Study (FAQs):
6Wresearch actively monitors the Austria Butanediol Market and publishes its comprehensive annual report, highlighting emerging trends, growth drivers, revenue analysis, and forecast outlook. Our insights help businesses to make data-backed strategic decisions with ongoing market dynamics. Our analysts track relevent industries related to the Austria Butanediol Market, allowing our clients with actionable intelligence and reliable forecasts tailored to emerging regional needs.
Yes, we provide customisation as per your requirements. To learn more, feel free to contact us on sales@6wresearch.com
1 Executive Summary |
2 Introduction |
2.1 Key Highlights of the Report |
2.2 Report Description |
2.3 Market Scope & Segmentation |
2.4 Research Methodology |
2.5 Assumptions |
3 Austria Butanediol Market Overview |
3.1 Austria Country Macro Economic Indicators |
3.2 Austria Butanediol Market Revenues & Volume, 2022 & 2032F |
3.3 Austria Butanediol Market - Industry Life Cycle |
3.4 Austria Butanediol Market - Porter's Five Forces |
3.5 Austria Butanediol Market Revenues & Volume Share, By Type, 2022 & 2032F |
3.6 Austria Butanediol Market Revenues & Volume Share, By Application, 2022 & 2032F |
4 Austria Butanediol Market Dynamics |
4.1 Impact Analysis |
4.2 Market Drivers |
4.2.1 Increasing demand for eco-friendly and sustainable products in various industries such as automotive, construction, and pharmaceuticals. |
4.2.2 Growing awareness about the benefits of using butanediol in manufacturing processes, such as its versatility and cost-effectiveness. |
4.2.3 Favorable government regulations promoting the use of bio-based chemicals and materials in Austria. |
4.3 Market Restraints |
4.3.1 Volatility in raw material prices, which can impact the production cost of butanediol. |
4.3.2 Competition from alternative chemicals or materials that may offer similar properties or benefits. |
4.3.3 Regulatory challenges related to the approval and certification of butanediol for use in certain applications. |
5 Austria Butanediol Market Trends |
6 Austria Butanediol Market, By Types |
6.1 Austria Butanediol Market, By Type |
6.1.1 Overview and Analysis |
6.1.2 Austria Butanediol Market Revenues & Volume, By Type, 2022-2032F |
6.1.3 Austria Butanediol Market Revenues & Volume, By Industrial Grade, 2022-2032F |
6.1.4 Austria Butanediol Market Revenues & Volume, By Cosmetic Grade, 2022-2032F |
6.2 Austria Butanediol Market, By Application |
6.2.1 Overview and Analysis |
6.2.2 Austria Butanediol Market Revenues & Volume, By PBT, 2022-2032F |
6.2.3 Austria Butanediol Market Revenues & Volume, By THF, 2022-2032F |
6.2.4 Austria Butanediol Market Revenues & Volume, By GBL, 2022-2032F |
6.2.5 Austria Butanediol Market Revenues & Volume, By Polyurethane, 2022-2032F |
7 Austria Butanediol Market Import-Export Trade Statistics |
7.1 Austria Butanediol Market Export to Major Countries |
7.2 Austria Butanediol Market Imports from Major Countries |
8 Austria Butanediol Market Key Performance Indicators |
8.1 Adoption rate of butanediol in key industries in Austria. |
8.2 Investment in research and development for new applications of butanediol. |
8.3 Number of partnerships and collaborations between butanediol manufacturers and key industry players in Austria. |
9 Austria Butanediol Market - Opportunity Assessment |
9.1 Austria Butanediol Market Opportunity Assessment, By Type, 2022 & 2032F |
9.2 Austria Butanediol Market Opportunity Assessment, By Application, 2022 & 2032F |
10 Austria Butanediol Market - Competitive Landscape |
10.1 Austria Butanediol Market Revenue Share, By Companies, 2025 |
10.2 Austria Butanediol Market Competitive Benchmarking, By Operating and Technical Parameters |
11 Company Profiles |
12 Recommendations |
13 Disclaimer |
Export potential assessment - trade Analytics for 2030
Export potential enables firms to identify high-growth global markets with greater confidence by combining advanced trade intelligence with a structured quantitative methodology. The framework analyzes emerging demand trends and country-level import patterns while integrating macroeconomic and trade datasets such as GDP and population forecasts, bilateral import–export flows, tariff structures, elasticity differentials between developed and developing economies, geographic distance, and import demand projections. Using weighted trade values from 2020–2024 as the base period to project country-to-country export potential for 2030, these inputs are operationalized through calculated drivers such as gravity model parameters, tariff impact factors, and projected GDP per-capita growth. Through an analysis of hidden potentials, demand hotspots, and market conditions that are most favorable to success, this method enables firms to focus on target countries, maximize returns, and global expansion with data, backed by accuracy.
By factoring in the projected importer demand gap that is currently unmet and could be potential opportunity, it identifies the potential for the Exporter (Country) among 190 countries, against the general trade analysis, which identifies the biggest importer or exporter.
To discover high-growth global markets and optimize your business strategy:
Click Here
Pricing
- Single User License$ 1,995
- Department License$ 2,400
- Site License$ 3,120
- Global License$ 3,795

Search
Thought Leadership and Analyst Meet


Our Clients
Latest Reports
- Philippines Polyhydroxybutyrate-co-Hydroxyvalerate Market (2026-2032) | Trends, Insights, Challenges, Restraints, Competition, Size, Value, Forecast, Pricing, Share, Outlook, Revenue, Investment Opportunities, Strategy, Drivers, Demand, Growth, segmentation, Analysis, Companies
- Peru Polyhydroxybutyrate-co-Hydroxyvalerate Market (2026-2032) | Growth, Demand, Challenges, Share, Trends, Analysis, Pricing, Investment Opportunities, Drivers, Value, Forecast, Competition, Size, Companies, Insights, Outlook, Restraints, segmentation, Revenue, Strategy
- Pakistan Polyhydroxybutyrate-co-Hydroxyvalerate Market (2026-2032) | Restraints, segmentation, Pricing, Forecast, Share, Strategy, Competition, Trends, Insights, Drivers, Challenges, Growth, Revenue, Outlook, Value, Investment Opportunities, Companies, Size, Analysis, Demand
- Oman Polyhydroxybutyrate-co-Hydroxyvalerate Market (2026-2032) | Drivers, segmentation, Insights, Competition, Pricing, Outlook, Size, Revenue, Challenges, Forecast, Analysis, Growth, Value, Share, Trends, Investment Opportunities, Strategy, Restraints, Companies, Demand
- Nigeria Polyhydroxybutyrate-co-Hydroxyvalerate Market (2026-2032) | Value, Investment Opportunities, Analysis, Revenue, Restraints, Pricing, Outlook, Competition, Demand, Growth, Forecast, Companies, Trends, Challenges, segmentation, Drivers, Insights, Share, Size, Strategy
- Nepal Polyhydroxybutyrate-co-Hydroxyvalerate Market (2026-2032) | Insights, Analysis, Drivers, Share, Revenue, Demand, segmentation, Investment Opportunities, Competition, Forecast, Growth, Pricing, Companies, Strategy, Trends, Restraints, Challenges, Outlook, Size, Value
- Myanmar Polyhydroxybutyrate-co-Hydroxyvalerate Market (2026-2032) | Outlook, Revenue, Strategy, Restraints, Drivers, segmentation, Share, Forecast, Competition, Insights, Growth, Pricing, Size, Demand, Value, Companies, Trends, Challenges, Investment Opportunities, Analysis
- Morocco Polyhydroxybutyrate-co-Hydroxyvalerate Market (2026-2032) | Outlook, Investment Opportunities, Restraints, Strategy, Forecast, Challenges, Drivers, Growth, Companies, segmentation, Trends, Size, Competition, Revenue, Demand, Insights, Share, Analysis, Value, Pricing
- Mexico Polyhydroxybutyrate-co-Hydroxyvalerate Market (2026-2032) | Size, Drivers, Outlook, Share, Strategy, Growth, Pricing, Challenges, Companies, Demand, Value, Investment Opportunities, Restraints, Trends, Forecast, segmentation, Analysis, Insights, Competition, Revenue
- Malaysia Polyhydroxybutyrate-co-Hydroxyvalerate Market (2026-2032) | Share, segmentation, Size, Companies, Analysis, Insights, Forecast, Value, Revenue, Drivers, Restraints, Challenges, Investment Opportunities, Trends, Competition, Strategy, Demand, Growth, Outlook, Pricing
Industry Events and Analyst Meet

HIMTEX 2026

India Refining Summit 2026

India EV Show 2026

EV tech India Expo 2026

Auto Tech Asia 2026
Whitepaper
- Middle East & Africa Commercial Security Market Click here to view more.
- Middle East & Africa Fire Safety Systems & Equipment Market Click here to view more.
- GCC Drone Market Click here to view more.
- Middle East Lighting Fixture Market Click here to view more.
- GCC Physical & Perimeter Security Market Click here to view more.
6WResearch In News
- Doha a strategic location for EV manufacturing hub: IPA Qatar
- Demand for luxury TVs surging in the GCC, says Samsung
- Empowering Growth: The Thriving Journey of Bangladesh’s Cable Industry
- Demand for luxury TVs surging in the GCC, says Samsung
- Video call with a traditional healer? Once unthinkable, it’s now common in South Africa
- Intelligent Buildings To Smooth GCC’s Path To Net Zero