Austria Electrolytic Manganese Dioxide Market (2026-2032) | Companies, Forecast, Industry, Analysis, Trends, Segmentation, Outlook, Revenue, Growth, Value, Size & Share
Market Forecast By Application (Batteries, Water Treatment, Others) And Competitive Landscape
| Product Code: ETC4864208 | Publication Date: Nov 2023 | Updated Date: Apr 2026 | Product Type: Market Research Report | |
| Publisher: 6Wresearch | Author: Shubham Padhi | No. of Pages: 60 | No. of Figures: 30 | No. of Tables: 5 |
Austria Electrolytic Manganese Dioxide Market Size (2020-2030)
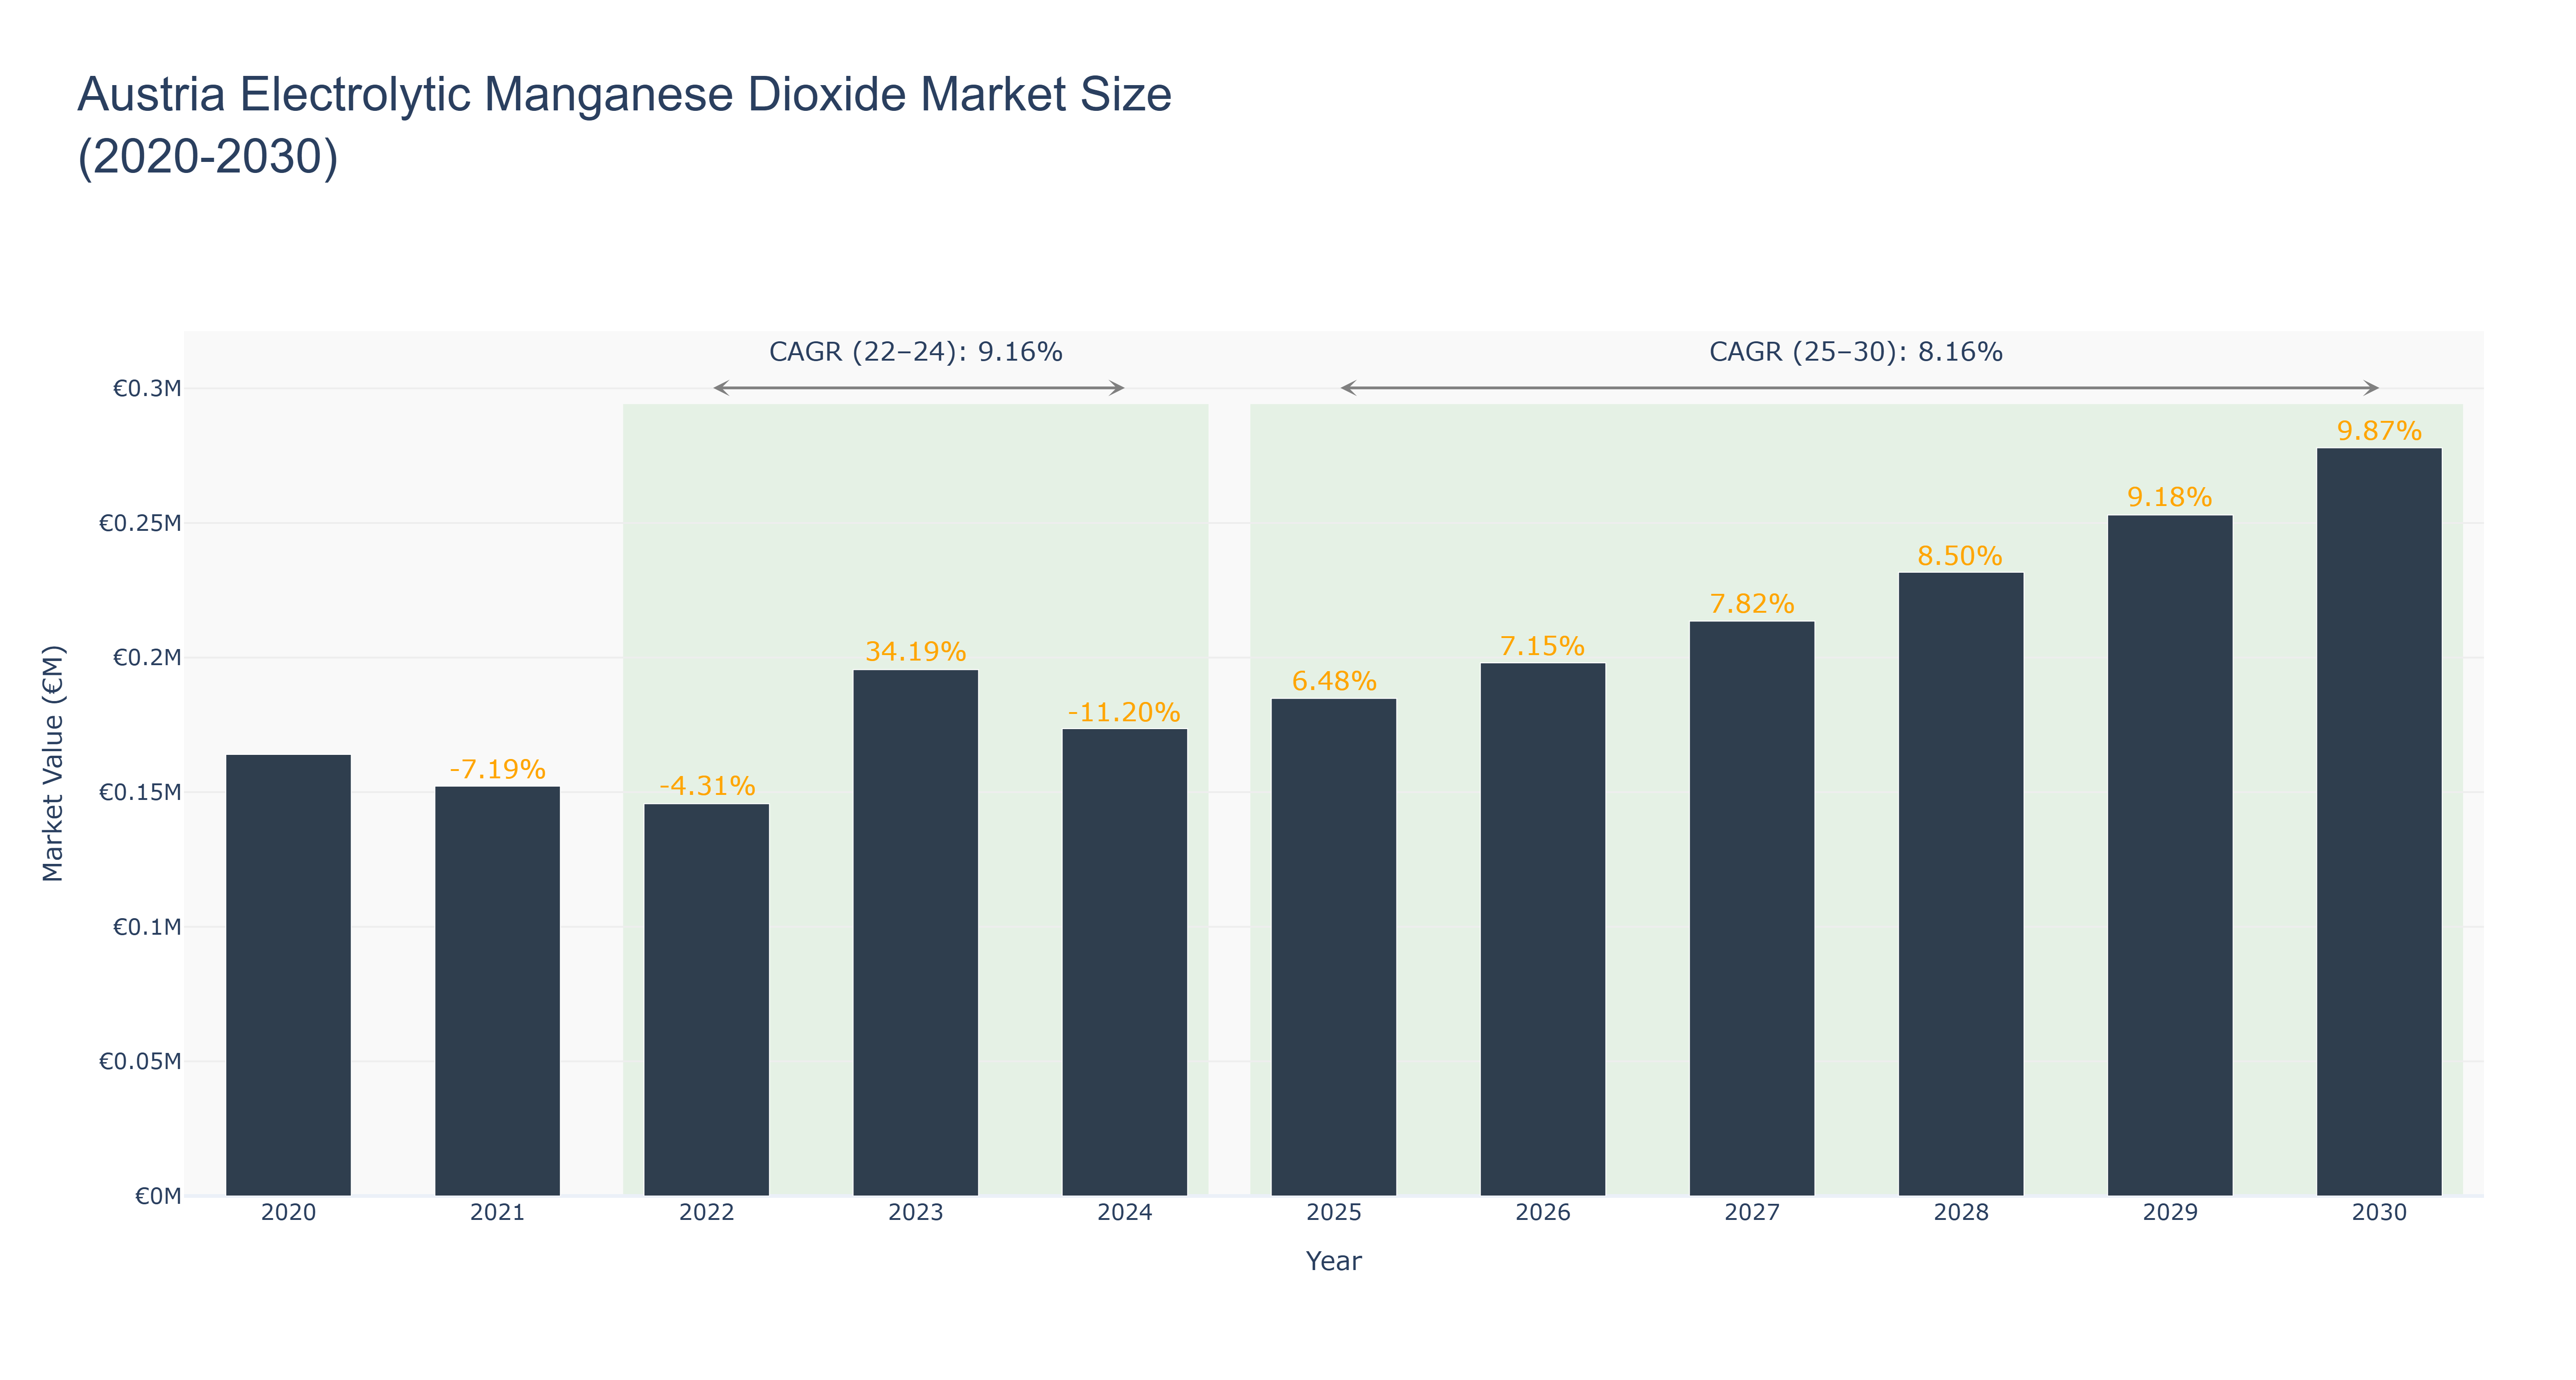
The Austria Electrolytic Manganese Dioxide Market experienced a peak size of €0.28 million in 2030, showcasing a steady growth trajectory. From 2020 to 2024, the market size fluctuated, starting at €0.16 million and reaching €0.17 million in 2024, with a dip in between due to a -11.20% growth rate. Forecasted growth from 2025 to 2030 is promising, with an expected market size of €0.25 million in 2029, showcasing a Compound Annual Growth Rate (CAGR) of 8.16%. The market's recent growth can be attributed to increasing demand for electrolytic manganese dioxide in various industries, driving production and consumption. Looking ahead, upcoming projects in Austria are set to further boost market growth, with new technological advancements and investments on the horizon, indicating a positive outlook for the Electrolytic Manganese Dioxide Market in the country.
Austria Electrolytic Manganese Dioxide Market: Production & Trade Performance (2019-2025)
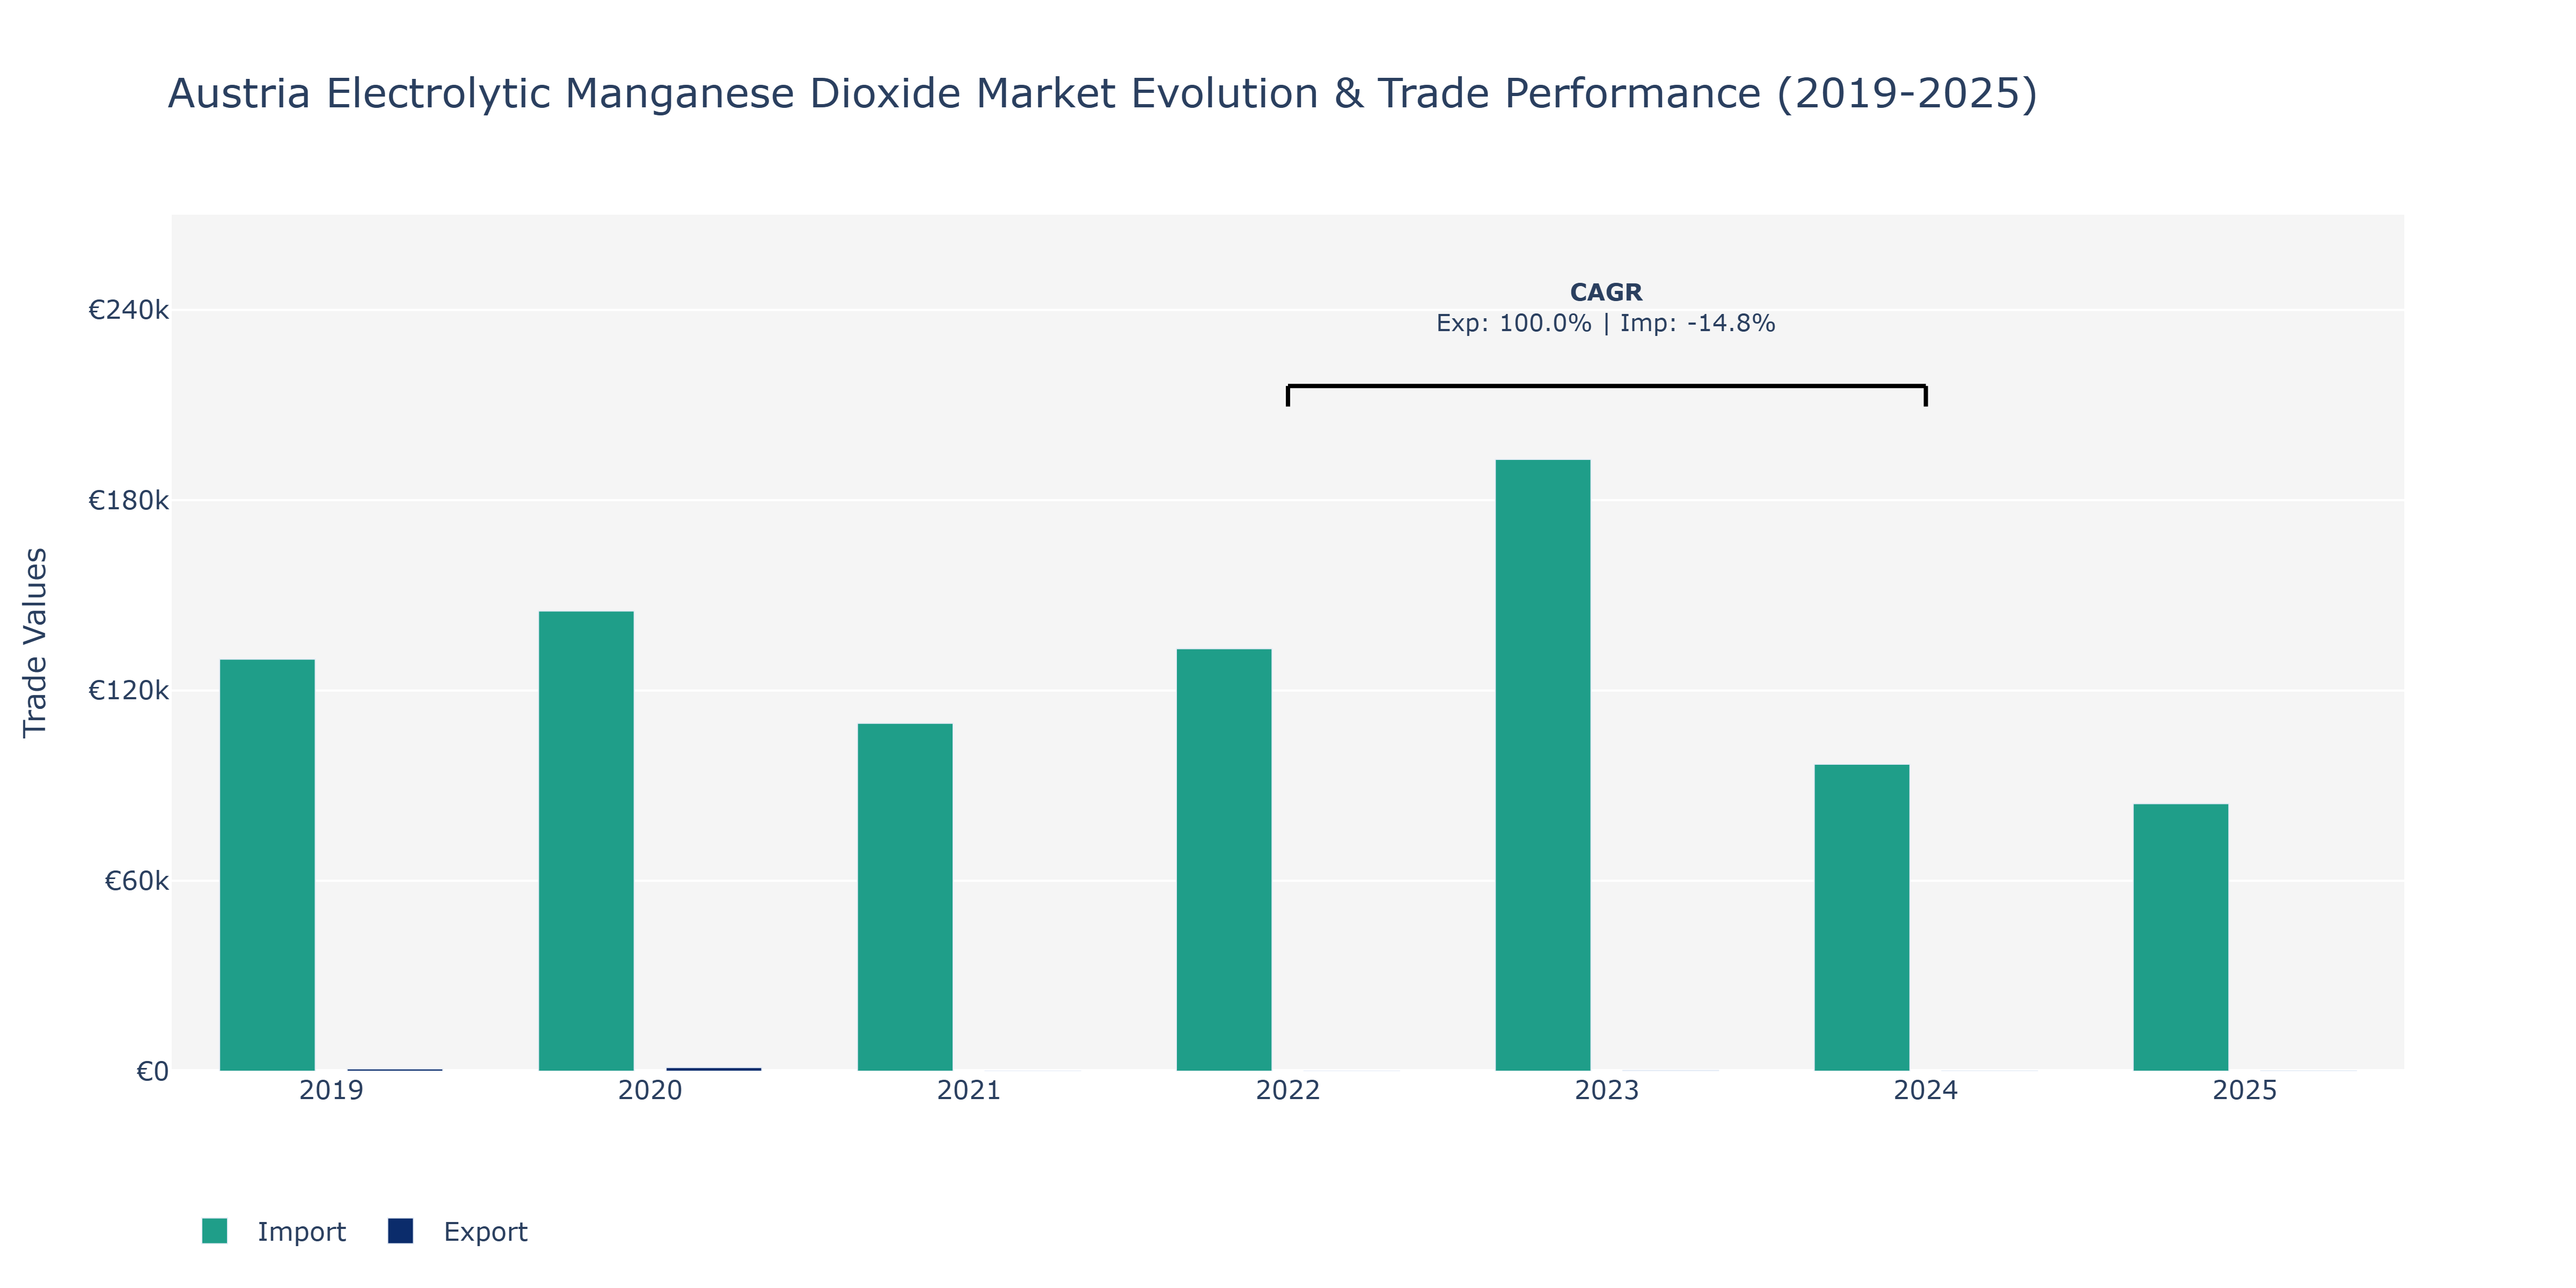
The Austria Electrolytic Manganese Dioxide Market saw dynamic shifts in Exports and Imports from 2019 to 2025. Exports surged from €710 million in 2019 to €1.13 billion in 2020, a substantial increase attributed to heightened demand or expanded market access. However, a sharp decline to €48 million in 2021 indicates potential supply chain disruptions or shifts in consumer preferences impacting outbound shipments. Imports followed a fluctuating trajectory, peaking at €192.9 million in 2023 before dropping to €84.3 million in 2025. This decline from peak levels may reflect evolving trade policies, global economic conditions, or changes in domestic production. The contrasting trends in Exports and Imports underscore the market's sensitivity to external factors, necessitating agile strategies and robust risk management practices to navigate uncertainties and capitalize on emerging opportunities in the Austria Electrolytic Manganese Dioxide Market.
Key Highlights of the Report:
- Austria Electrolytic Manganese Dioxide Market Outlook
- Market Size of Austria Electrolytic Manganese Dioxide Market, 2025
- Forecast of Austria Electrolytic Manganese Dioxide Market, 2032
- Historical Data and Forecast of Austria Electrolytic Manganese Dioxide Revenues & Volume for the Period 2022-2032F
- Austria Electrolytic Manganese Dioxide Market Trend Evolution
- Austria Electrolytic Manganese Dioxide Market Drivers and Challenges
- Austria Electrolytic Manganese Dioxide Price Trends
- Austria Electrolytic Manganese Dioxide Porter`s Five Forces
- Austria Electrolytic Manganese Dioxide Industry Life Cycle
- Historical Data and Forecast of Austria Electrolytic Manganese Dioxide Market Revenues & Volume By Application for the Period 2022-2032F
- Historical Data and Forecast of Austria Electrolytic Manganese Dioxide Market Revenues & Volume By Batteries for the Period 2022-2032F
- Historical Data and Forecast of Austria Electrolytic Manganese Dioxide Market Revenues & Volume By Water Treatment for the Period 2022-2032F
- Historical Data and Forecast of Austria Electrolytic Manganese Dioxide Market Revenues & Volume By Others for the Period 2022-2032F
- Austria Electrolytic Manganese Dioxide Import Export Trade Statistics
- Market Opportunity Assessment By Application
- Austria Electrolytic Manganese Dioxide Top Companies Market Share
- Austria Electrolytic Manganese Dioxide Competitive Benchmarking By Technical and Operational Parameters
- Austria Electrolytic Manganese Dioxide Company Profiles
- Austria Electrolytic Manganese Dioxide Key Strategic Recommendations
Frequently Asked Questions About the Market Study (FAQs):
6Wresearch actively monitors the Austria Electrolytic Manganese Dioxide Market and publishes its comprehensive annual report, highlighting emerging trends, growth drivers, revenue analysis, and forecast outlook. Our insights help businesses to make data-backed strategic decisions with ongoing market dynamics. Our analysts track relevent industries related to the Austria Electrolytic Manganese Dioxide Market, allowing our clients with actionable intelligence and reliable forecasts tailored to emerging regional needs.
Yes, we provide customisation as per your requirements. To learn more, feel free to contact us on sales@6wresearch.com
1 Executive Summary |
2 Introduction |
2.1 Key Highlights of the Report |
2.2 Report Description |
2.3 Market Scope & Segmentation |
2.4 Research Methodology |
2.5 Assumptions |
3 Austria Electrolytic Manganese Dioxide Market Overview |
3.1 Austria Country Macro Economic Indicators |
3.2 Austria Electrolytic Manganese Dioxide Market Revenues & Volume, 2022 & 2032F |
3.3 Austria Electrolytic Manganese Dioxide Market - Industry Life Cycle |
3.4 Austria Electrolytic Manganese Dioxide Market - Porter's Five Forces |
3.5 Austria Electrolytic Manganese Dioxide Market Revenues & Volume Share, By Application, 2022 & 2032F |
4 Austria Electrolytic Manganese Dioxide Market Dynamics |
4.1 Impact Analysis |
4.2 Market Drivers |
4.2.1 Increasing demand for batteries in automotive and electronics industries |
4.2.2 Growing focus on renewable energy storage solutions |
4.2.3 Technological advancements in electrolytic manganese dioxide production processes |
4.3 Market Restraints |
4.3.1 Fluctuating raw material prices |
4.3.2 Stringent environmental regulations impacting production processes |
4.3.3 Intense competition from alternative battery technologies |
5 Austria Electrolytic Manganese Dioxide Market Trends |
6 Austria Electrolytic Manganese Dioxide Market Segmentations |
6.1 Austria Electrolytic Manganese Dioxide Market, By Application |
6.1.1 Overview and Analysis |
6.1.2 Austria Electrolytic Manganese Dioxide Market Revenues & Volume, By Batteries, 2022-2032F |
6.1.3 Austria Electrolytic Manganese Dioxide Market Revenues & Volume, By Water Treatment, 2022-2032F |
6.1.4 Austria Electrolytic Manganese Dioxide Market Revenues & Volume, By Others, 2022-2032F |
7 Austria Electrolytic Manganese Dioxide Market Import-Export Trade Statistics |
7.1 Austria Electrolytic Manganese Dioxide Market Export to Major Countries |
7.2 Austria Electrolytic Manganese Dioxide Market Imports from Major Countries |
8 Austria Electrolytic Manganese Dioxide Market Key Performance Indicators |
8.1 Average selling price of electrolytic manganese dioxide |
8.2 Percentage of market share held by key manufacturers |
8.3 Research and development investment in electrolytic manganese dioxide technologies |
9 Austria Electrolytic Manganese Dioxide Market - Opportunity Assessment |
9.1 Austria Electrolytic Manganese Dioxide Market Opportunity Assessment, By Application, 2022 & 2032F |
10 Austria Electrolytic Manganese Dioxide Market - Competitive Landscape |
10.1 Austria Electrolytic Manganese Dioxide Market Revenue Share, By Companies, 2025 |
10.2 Austria Electrolytic Manganese Dioxide Market Competitive Benchmarking, By Operating and Technical Parameters |
11 Company Profiles |
12 Recommendations | 13 Disclaimer |
Export potential assessment - trade Analytics for 2030
Export potential enables firms to identify high-growth global markets with greater confidence by combining advanced trade intelligence with a structured quantitative methodology. The framework analyzes emerging demand trends and country-level import patterns while integrating macroeconomic and trade datasets such as GDP and population forecasts, bilateral import–export flows, tariff structures, elasticity differentials between developed and developing economies, geographic distance, and import demand projections. Using weighted trade values from 2020–2024 as the base period to project country-to-country export potential for 2030, these inputs are operationalized through calculated drivers such as gravity model parameters, tariff impact factors, and projected GDP per-capita growth. Through an analysis of hidden potentials, demand hotspots, and market conditions that are most favorable to success, this method enables firms to focus on target countries, maximize returns, and global expansion with data, backed by accuracy.
By factoring in the projected importer demand gap that is currently unmet and could be potential opportunity, it identifies the potential for the Exporter (Country) among 190 countries, against the general trade analysis, which identifies the biggest importer or exporter.
To discover high-growth global markets and optimize your business strategy:
Click Here
Pricing
- Single User License$ 1,995
- Department License$ 2,400
- Site License$ 3,120
- Global License$ 3,795

Search
Thought Leadership and Analyst Meet


Our Clients
Latest Reports
- Philippines Polyhydroxybutyrate-co-Hydroxyvalerate Market (2026-2032) | Trends, Insights, Challenges, Restraints, Competition, Size, Value, Forecast, Pricing, Share, Outlook, Revenue, Investment Opportunities, Strategy, Drivers, Demand, Growth, segmentation, Analysis, Companies
- Peru Polyhydroxybutyrate-co-Hydroxyvalerate Market (2026-2032) | Growth, Demand, Challenges, Share, Trends, Analysis, Pricing, Investment Opportunities, Drivers, Value, Forecast, Competition, Size, Companies, Insights, Outlook, Restraints, segmentation, Revenue, Strategy
- Pakistan Polyhydroxybutyrate-co-Hydroxyvalerate Market (2026-2032) | Restraints, segmentation, Pricing, Forecast, Share, Strategy, Competition, Trends, Insights, Drivers, Challenges, Growth, Revenue, Outlook, Value, Investment Opportunities, Companies, Size, Analysis, Demand
- Oman Polyhydroxybutyrate-co-Hydroxyvalerate Market (2026-2032) | Drivers, segmentation, Insights, Competition, Pricing, Outlook, Size, Revenue, Challenges, Forecast, Analysis, Growth, Value, Share, Trends, Investment Opportunities, Strategy, Restraints, Companies, Demand
- Nigeria Polyhydroxybutyrate-co-Hydroxyvalerate Market (2026-2032) | Value, Investment Opportunities, Analysis, Revenue, Restraints, Pricing, Outlook, Competition, Demand, Growth, Forecast, Companies, Trends, Challenges, segmentation, Drivers, Insights, Share, Size, Strategy
- Nepal Polyhydroxybutyrate-co-Hydroxyvalerate Market (2026-2032) | Insights, Analysis, Drivers, Share, Revenue, Demand, segmentation, Investment Opportunities, Competition, Forecast, Growth, Pricing, Companies, Strategy, Trends, Restraints, Challenges, Outlook, Size, Value
- Myanmar Polyhydroxybutyrate-co-Hydroxyvalerate Market (2026-2032) | Outlook, Revenue, Strategy, Restraints, Drivers, segmentation, Share, Forecast, Competition, Insights, Growth, Pricing, Size, Demand, Value, Companies, Trends, Challenges, Investment Opportunities, Analysis
- Morocco Polyhydroxybutyrate-co-Hydroxyvalerate Market (2026-2032) | Outlook, Investment Opportunities, Restraints, Strategy, Forecast, Challenges, Drivers, Growth, Companies, segmentation, Trends, Size, Competition, Revenue, Demand, Insights, Share, Analysis, Value, Pricing
- Mexico Polyhydroxybutyrate-co-Hydroxyvalerate Market (2026-2032) | Size, Drivers, Outlook, Share, Strategy, Growth, Pricing, Challenges, Companies, Demand, Value, Investment Opportunities, Restraints, Trends, Forecast, segmentation, Analysis, Insights, Competition, Revenue
- Malaysia Polyhydroxybutyrate-co-Hydroxyvalerate Market (2026-2032) | Share, segmentation, Size, Companies, Analysis, Insights, Forecast, Value, Revenue, Drivers, Restraints, Challenges, Investment Opportunities, Trends, Competition, Strategy, Demand, Growth, Outlook, Pricing
Industry Events and Analyst Meet

HIMTEX 2026

India Refining Summit 2026

India EV Show 2026

EV tech India Expo 2026

Auto Tech Asia 2026
Whitepaper
- Middle East & Africa Commercial Security Market Click here to view more.
- Middle East & Africa Fire Safety Systems & Equipment Market Click here to view more.
- GCC Drone Market Click here to view more.
- Middle East Lighting Fixture Market Click here to view more.
- GCC Physical & Perimeter Security Market Click here to view more.
6WResearch In News
- Doha a strategic location for EV manufacturing hub: IPA Qatar
- Demand for luxury TVs surging in the GCC, says Samsung
- Empowering Growth: The Thriving Journey of Bangladesh’s Cable Industry
- Demand for luxury TVs surging in the GCC, says Samsung
- Video call with a traditional healer? Once unthinkable, it’s now common in South Africa
- Intelligent Buildings To Smooth GCC’s Path To Net Zero