Austria Interconnects and Passive Components Market (2026-2032) | Revenue, Value, Analysis, Share, Growth, Segmentation, Forecast, Outlook, Companies, Trends, Size & Industry
Market Forecast By Product Type (Passive Components, Interconnects), By Application (Consumer Electronics, Data Processing, Telecommunication, Military & Aerospace, Automotive, Industrial, Healthcare) And Competitive Landscape
| Product Code: ETC5588640 | Publication Date: Nov 2023 | Updated Date: Mar 2026 | Product Type: Market Research Report | |
| Publisher: 6Wresearch | Author: Ravi Bhandari | No. of Pages: 60 | No. of Figures: 30 | No. of Tables: 5 |
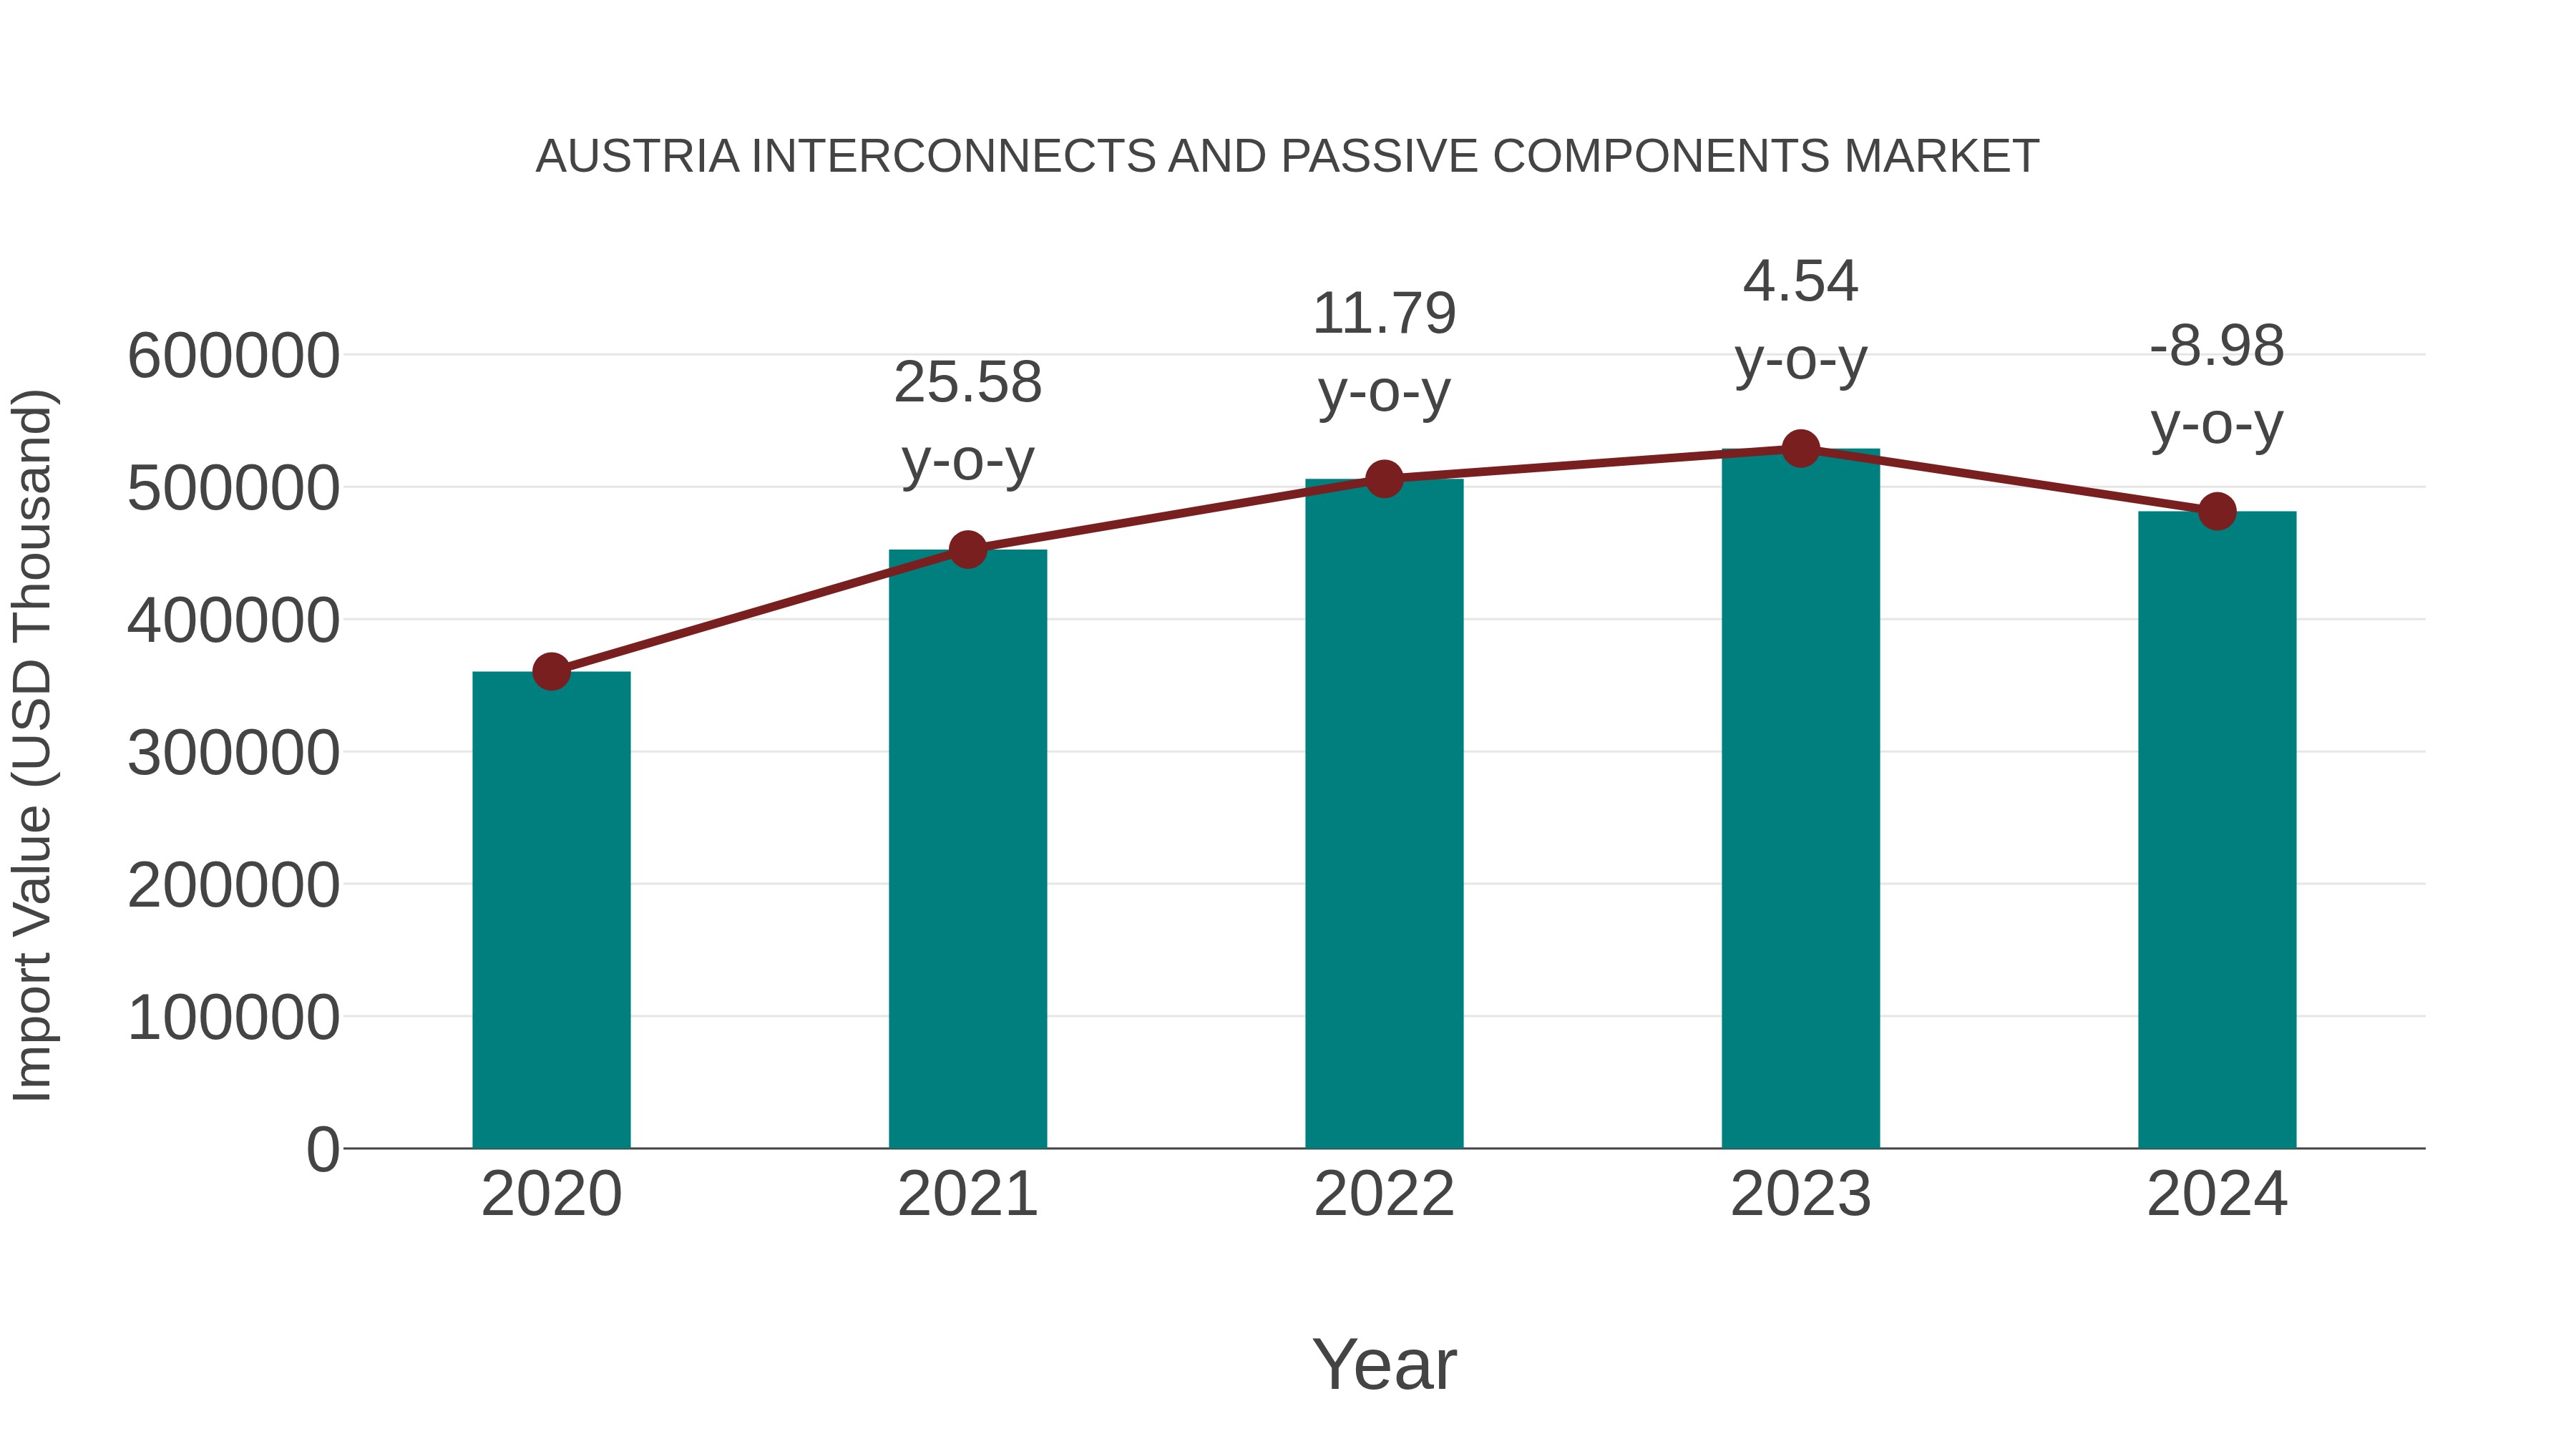
Austria Interconnects and Passive Components Market: Import Trend Analysis
The Austria interconnects and passive components market witnessed a steady increase in imports from 2020 to 2024, with a Compound Annual Growth Rate (CAGR) of 7.51%. Despite a slight decline in the year-on-year growth rate of -8.98% in 2023-2024, the overall trend indicated a positive trajectory in import volumes during the specified period.
Austria Interconnects and Passive Components Market Overview
Austria`s interconnects and passive components market is growing, with applications in electronics, telecommunications, and industrial sectors. These components are essential for building reliable and efficient electronic systems, supporting connectivity and signal transmission.
Drivers of the market
The interconnects and passive components market is experiencing growth due to the increasing demand for reliable and efficient connectivity solutions in electronic devices. With the rise of consumer electronics, telecommunications, and automotive sectors, the need for high-quality interconnects and passive components is becoming critical. Innovations in miniaturization and performance enhancement are driving the development of advanced components, supporting the rapid evolution of electronic technology and contributing to market growth.
Challenges of the market
In the interconnects and passive components market, manufacturers face challenges related to supply chain disruptions and fluctuating demand driven by evolving technology trends. Ensuring product reliability and performance is crucial for customer satisfaction, particularly in high-stakes applications. Additionally, competition from emerging technologies necessitates continuous innovation and adaptation.
Government Policy of the market
In Austria, the interconnects and passive components market is shaped by government regulations that prioritize quality and safety in electronic manufacturing. The government supports innovation in the electronics sector through funding and research grants, fostering collaboration between industry and academic institutions. Regulatory frameworks ensure compliance with international standards, enhancing the competitiveness of Austrian manufacturers in the global market. Public initiatives also promote sustainable practices in production, encouraging the use of eco-friendly materials and processes in the development of interconnects and passive components.
Key Highlights of the Report:
- Austria Interconnects and Passive Components Market Outlook
- Market Size of Austria Interconnects and Passive Components Market, 2025
- Forecast of Austria Interconnects and Passive Components Market, 2032
- Historical Data and Forecast of Austria Interconnects and Passive Components Revenues & Volume for the Period 2022-2032F
- Austria Interconnects and Passive Components Market Trend Evolution
- Austria Interconnects and Passive Components Market Drivers and Challenges
- Austria Interconnects and Passive Components Price Trends
- Austria Interconnects and Passive Components Porter`s Five Forces
- Austria Interconnects and Passive Components Industry Life Cycle
- Historical Data and Forecast of Austria Interconnects and Passive Components Market Revenues & Volume By Product Type for the Period 2022-2032F
- Historical Data and Forecast of Austria Interconnects and Passive Components Market Revenues & Volume By Passive Components for the Period 2022-2032F
- Historical Data and Forecast of Austria Interconnects and Passive Components Market Revenues & Volume By Interconnects for the Period 2022-2032F
- Historical Data and Forecast of Austria Interconnects and Passive Components Market Revenues & Volume By Application for the Period 2022-2032F
- Historical Data and Forecast of Austria Interconnects and Passive Components Market Revenues & Volume By Consumer Electronics for the Period 2022-2032F
- Historical Data and Forecast of Austria Interconnects and Passive Components Market Revenues & Volume By Data Processing for the Period 2022-2032F
- Historical Data and Forecast of Austria Interconnects and Passive Components Market Revenues & Volume By Telecommunication for the Period 2022-2032F
- Historical Data and Forecast of Austria Interconnects and Passive Components Market Revenues & Volume By Military & Aerospace for the Period 2022-2032F
- Historical Data and Forecast of Austria Interconnects and Passive Components Market Revenues & Volume By Automotive for the Period 2022-2032F
- Historical Data and Forecast of Austria Interconnects and Passive Components Market Revenues & Volume By Industrial for the Period 2022-2032F
- Historical Data and Forecast of Austria Interconnects and Passive Components Market Revenues & Volume By Healthcare for the Period 2022-2032F
- Austria Interconnects and Passive Components Import Export Trade Statistics
- Market Opportunity Assessment By Product Type
- Market Opportunity Assessment By Application
- Austria Interconnects and Passive Components Top Companies Market Share
- Austria Interconnects and Passive Components Competitive Benchmarking By Technical and Operational Parameters
- Austria Interconnects and Passive Components Company Profiles
- Austria Interconnects and Passive Components Key Strategic Recommendations
Austria Interconnects and Passive Components Market (2026-2032): FAQs
6Wresearch actively monitors the Austria Interconnects and Passive Components Market and publishes its comprehensive annual report, highlighting emerging trends, growth drivers, revenue analysis, and forecast outlook. Our insights help businesses to make data-backed strategic decisions with ongoing market dynamics. Our analysts track relevent industries related to the Austria Interconnects and Passive Components Market, allowing our clients with actionable intelligence and reliable forecasts tailored to emerging regional needs.
Yes, we provide customisation as per your requirements. To learn more, feel free to contact us on sales@6wresearch.com
1 Executive Summary |
2 Introduction |
2.1 Key Highlights of the Report |
2.2 Report Description |
2.3 Market Scope & Segmentation |
2.4 Research Methodology |
2.5 Assumptions |
3 Austria Interconnects and Passive Components? Market Overview |
3.1 Austria Country Macro Economic Indicators |
3.2 Austria Interconnects and Passive Components? Market Revenues & Volume, 2022 & 2032F |
3.3 Austria Interconnects and Passive Components? Market - Industry Life Cycle |
3.4 Austria Interconnects and Passive Components? Market - Porter's Five Forces |
3.5 Austria Interconnects and Passive Components? Market Revenues & Volume Share, By Product Type, 2022 & 2032F |
3.6 Austria Interconnects and Passive Components? Market Revenues & Volume Share, By Application, 2022 & 2032F |
4 Austria Interconnects and Passive Components? Market Dynamics |
4.1 Impact Analysis |
4.2 Market Drivers |
4.2.1 Growing demand for high-speed data connectivity solutions |
4.2.2 Increasing adoption of IoT devices and smart technologies |
4.2.3 Technological advancements in the electronics industry |
4.3 Market Restraints |
4.3.1 Volatile raw material prices impacting manufacturing costs |
4.3.2 Intense competition from international players |
4.3.3 Regulatory challenges related to environmental standards and compliance |
5 Austria Interconnects and Passive Components? Market Trends |
6 Austria Interconnects and Passive Components? Market Segmentations |
6.1 Austria Interconnects and Passive Components? Market, By Product Type |
6.1.1 Overview and Analysis |
6.1.2 Austria Interconnects and Passive Components? Market Revenues & Volume, By Passive Components, 2022-2032F |
6.1.3 Austria Interconnects and Passive Components? Market Revenues & Volume, By Interconnects, 2022-2032F |
6.2 Austria Interconnects and Passive Components? Market, By Application |
6.2.1 Overview and Analysis |
6.2.2 Austria Interconnects and Passive Components? Market Revenues & Volume, By Consumer Electronics, 2022-2032F |
6.2.3 Austria Interconnects and Passive Components? Market Revenues & Volume, By Data Processing, 2022-2032F |
6.2.4 Austria Interconnects and Passive Components? Market Revenues & Volume, By Telecommunication, 2022-2032F |
6.2.5 Austria Interconnects and Passive Components? Market Revenues & Volume, By Military & Aerospace, 2022-2032F |
6.2.6 Austria Interconnects and Passive Components? Market Revenues & Volume, By Automotive, 2022-2032F |
6.2.7 Austria Interconnects and Passive Components? Market Revenues & Volume, By Industrial, 2022-2032F |
7 Austria Interconnects and Passive Components? Market Import-Export Trade Statistics |
7.1 Austria Interconnects and Passive Components? Market Export to Major Countries |
7.2 Austria Interconnects and Passive Components? Market Imports from Major Countries |
8 Austria Interconnects and Passive Components? Market Key Performance Indicators |
8.1 Average lead time for product development and launch |
8.2 Rate of new product introductions in the market |
8.3 Percentage of revenue from innovative product lines |
8.4 Customer satisfaction score for product quality and performance |
8.5 Number of strategic partnerships and collaborations established |
9 Austria Interconnects and Passive Components? Market - Opportunity Assessment |
9.1 Austria Interconnects and Passive Components? Market Opportunity Assessment, By Product Type, 2022 & 2032F |
9.2 Austria Interconnects and Passive Components? Market Opportunity Assessment, By Application, 2022 & 2032F |
10 Austria Interconnects and Passive Components? Market - Competitive Landscape |
10.1 Austria Interconnects and Passive Components? Market Revenue Share, By Companies, 2025 |
10.2 Austria Interconnects and Passive Components? Market Competitive Benchmarking, By Operating and Technical Parameters |
11 Company Profiles |
12 Recommendations | 13 Disclaimer |
Export potential assessment - trade Analytics for 2030
Export potential enables firms to identify high-growth global markets with greater confidence by combining advanced trade intelligence with a structured quantitative methodology. The framework analyzes emerging demand trends and country-level import patterns while integrating macroeconomic and trade datasets such as GDP and population forecasts, bilateral import–export flows, tariff structures, elasticity differentials between developed and developing economies, geographic distance, and import demand projections. Using weighted trade values from 2020–2024 as the base period to project country-to-country export potential for 2030, these inputs are operationalized through calculated drivers such as gravity model parameters, tariff impact factors, and projected GDP per-capita growth. Through an analysis of hidden potentials, demand hotspots, and market conditions that are most favorable to success, this method enables firms to focus on target countries, maximize returns, and global expansion with data, backed by accuracy.
By factoring in the projected importer demand gap that is currently unmet and could be potential opportunity, it identifies the potential for the Exporter (Country) among 190 countries, against the general trade analysis, which identifies the biggest importer or exporter.
To discover high-growth global markets and optimize your business strategy:
Click Here
Pricing
- Single User License$ 1,995
- Department License$ 2,400
- Site License$ 3,120
- Global License$ 3,795

Search
Thought Leadership and Analyst Meet


Our Clients
Latest Reports
- Canada Cloud CFD Market (2026-2032) | Size & Revenue, Industry, Growth, Competitive Landscape, Forecast, Segmentation, Value, Outlook, Trends, Share, Analysis, Companies
- Taiwan Food Delivery Platform Market (2026-2032) | Companies, Outlook, Analysis, Trends, Value, Revenue, Segmentation, Share, Forecast, Competitive Landscape, Growth, Size & Forecast
- United Kingdom (UK) Long-term Care Insurance Market (2026-2032) | Growth, Share, Consumer Insights, Drivers, Opportunities, Competition, Pricing Analysis, Segments, Restraints, Companies, Competitive, Value, Outlook, Size, Demand, Analysis, Challenges, Strategic Insights, Investment Trends, Revenue, Trends, Supply, Forecast
- United Kingdom (UK) Long Term Care Market (2026-2032) | Companies, Outlook, Analysis, Trends, Value, Revenue, Segmentation, Share, Forecast, Competitive Landscape, Growth, Size & Forecast
- Iraq Insulation and Waterproofing Market (2026-2032) | Outlook, Drivers, Growth, Size, Share, Industry, Revenue, Trends, Demand, Competitive, Strategic Insights, Opportunities, Segments, Companies, Challenges, Strategy, Consumer Insights, Analysis, Investment Trends, Value, Segmentation, Forecast, Restraints
- India Switchgear Market Outlook (2026-2032) | Size, Share, Trends, Growth, Revenue, Forecast, Analysis, Value, Outlook
- Pakistan Contraceptive Implants Market (2025-2031) | Demand, Growth, Size, Share, Industry, Pricing Analysis, Competitive, Strategic Insights, Strategy, Consumer Insights, Analysis, Investment Trends, Opportunities, Revenue, Segments, Value, Segmentation, Supply, Forecast, Restraints, Outlook, Competition, Drivers, Trends, Companies, Challenges
- Sri Lanka Packaging Market (2026-2032) | Outlook, Competition, Drivers, Trends, Demand, Pricing Analysis, Competitive, Strategic Insights, Companies, Challenges, Strategy, Consumer Insights, Analysis, Investment Trends, Opportunities, Growth, Size, Share, Industry, Revenue, Segments, Value, Segmentation, Supply, Forecast, Restraints
- India Kids Watches Market (2026-2032) | Strategy, Consumer Insights, Analysis, Investment Trends, Opportunities, Growth, Size, Share, Industry, Revenue, Segments, Value, Segmentation, Supply, Forecast, Restraints, Outlook, Competition, Drivers, Trends, Demand, Pricing Analysis, Competitive, Strategic Insights, Companies, Challenges
- Saudi Arabia Core Assurance Service Market (2025-2031) | Strategy, Consumer Insights, Analysis, Investment Trends, Opportunities, Growth, Size, Share, Industry, Revenue, Segments, Value, Segmentation, Supply, Forecast, Restraints, Outlook, Competition, Drivers, Trends, Demand, Pricing Analysis, Competitive, Strategic Insights, Companies, Challenges
Industry Events and Analyst Meet

India EV Show 2026

EV tech India Expo 2026

Auto Tech Asia 2026

Battery Tech India 2026

Smart Production Solutions Guangzhou 2026
Whitepaper
- Middle East & Africa Commercial Security Market Click here to view more.
- Middle East & Africa Fire Safety Systems & Equipment Market Click here to view more.
- GCC Drone Market Click here to view more.
- Middle East Lighting Fixture Market Click here to view more.
- GCC Physical & Perimeter Security Market Click here to view more.
6WResearch In News
- Doha a strategic location for EV manufacturing hub: IPA Qatar
- Demand for luxury TVs surging in the GCC, says Samsung
- Empowering Growth: The Thriving Journey of Bangladesh’s Cable Industry
- Demand for luxury TVs surging in the GCC, says Samsung
- Video call with a traditional healer? Once unthinkable, it’s now common in South Africa
- Intelligent Buildings To Smooth GCC’s Path To Net Zero