Austria Mannequin Head Market (2026-2032) | Share, Competitive Landscape, Trends, Analysis, Companies, Forecast, Segmentation, Growth, Size & Revenue, Industry, Value, Outlook
Market Forecast By Type (Men, Women, Infants & Toddlers), By Application (Hairstyling & Barbering, Makeup Artistry, Wig & Hairpiece Design, Hat & Accessories) And Competitive Landscape
| Product Code: ETC6206171 | Publication Date: Sep 2024 | Updated Date: Apr 2026 | Product Type: Market Research Report | |
| Publisher: 6Wresearch | Author: Dhaval Chaurasia | No. of Pages: 75 | No. of Figures: 35 | No. of Tables: 20 |
Austria Mannequin Head Market Size (2020-2030)
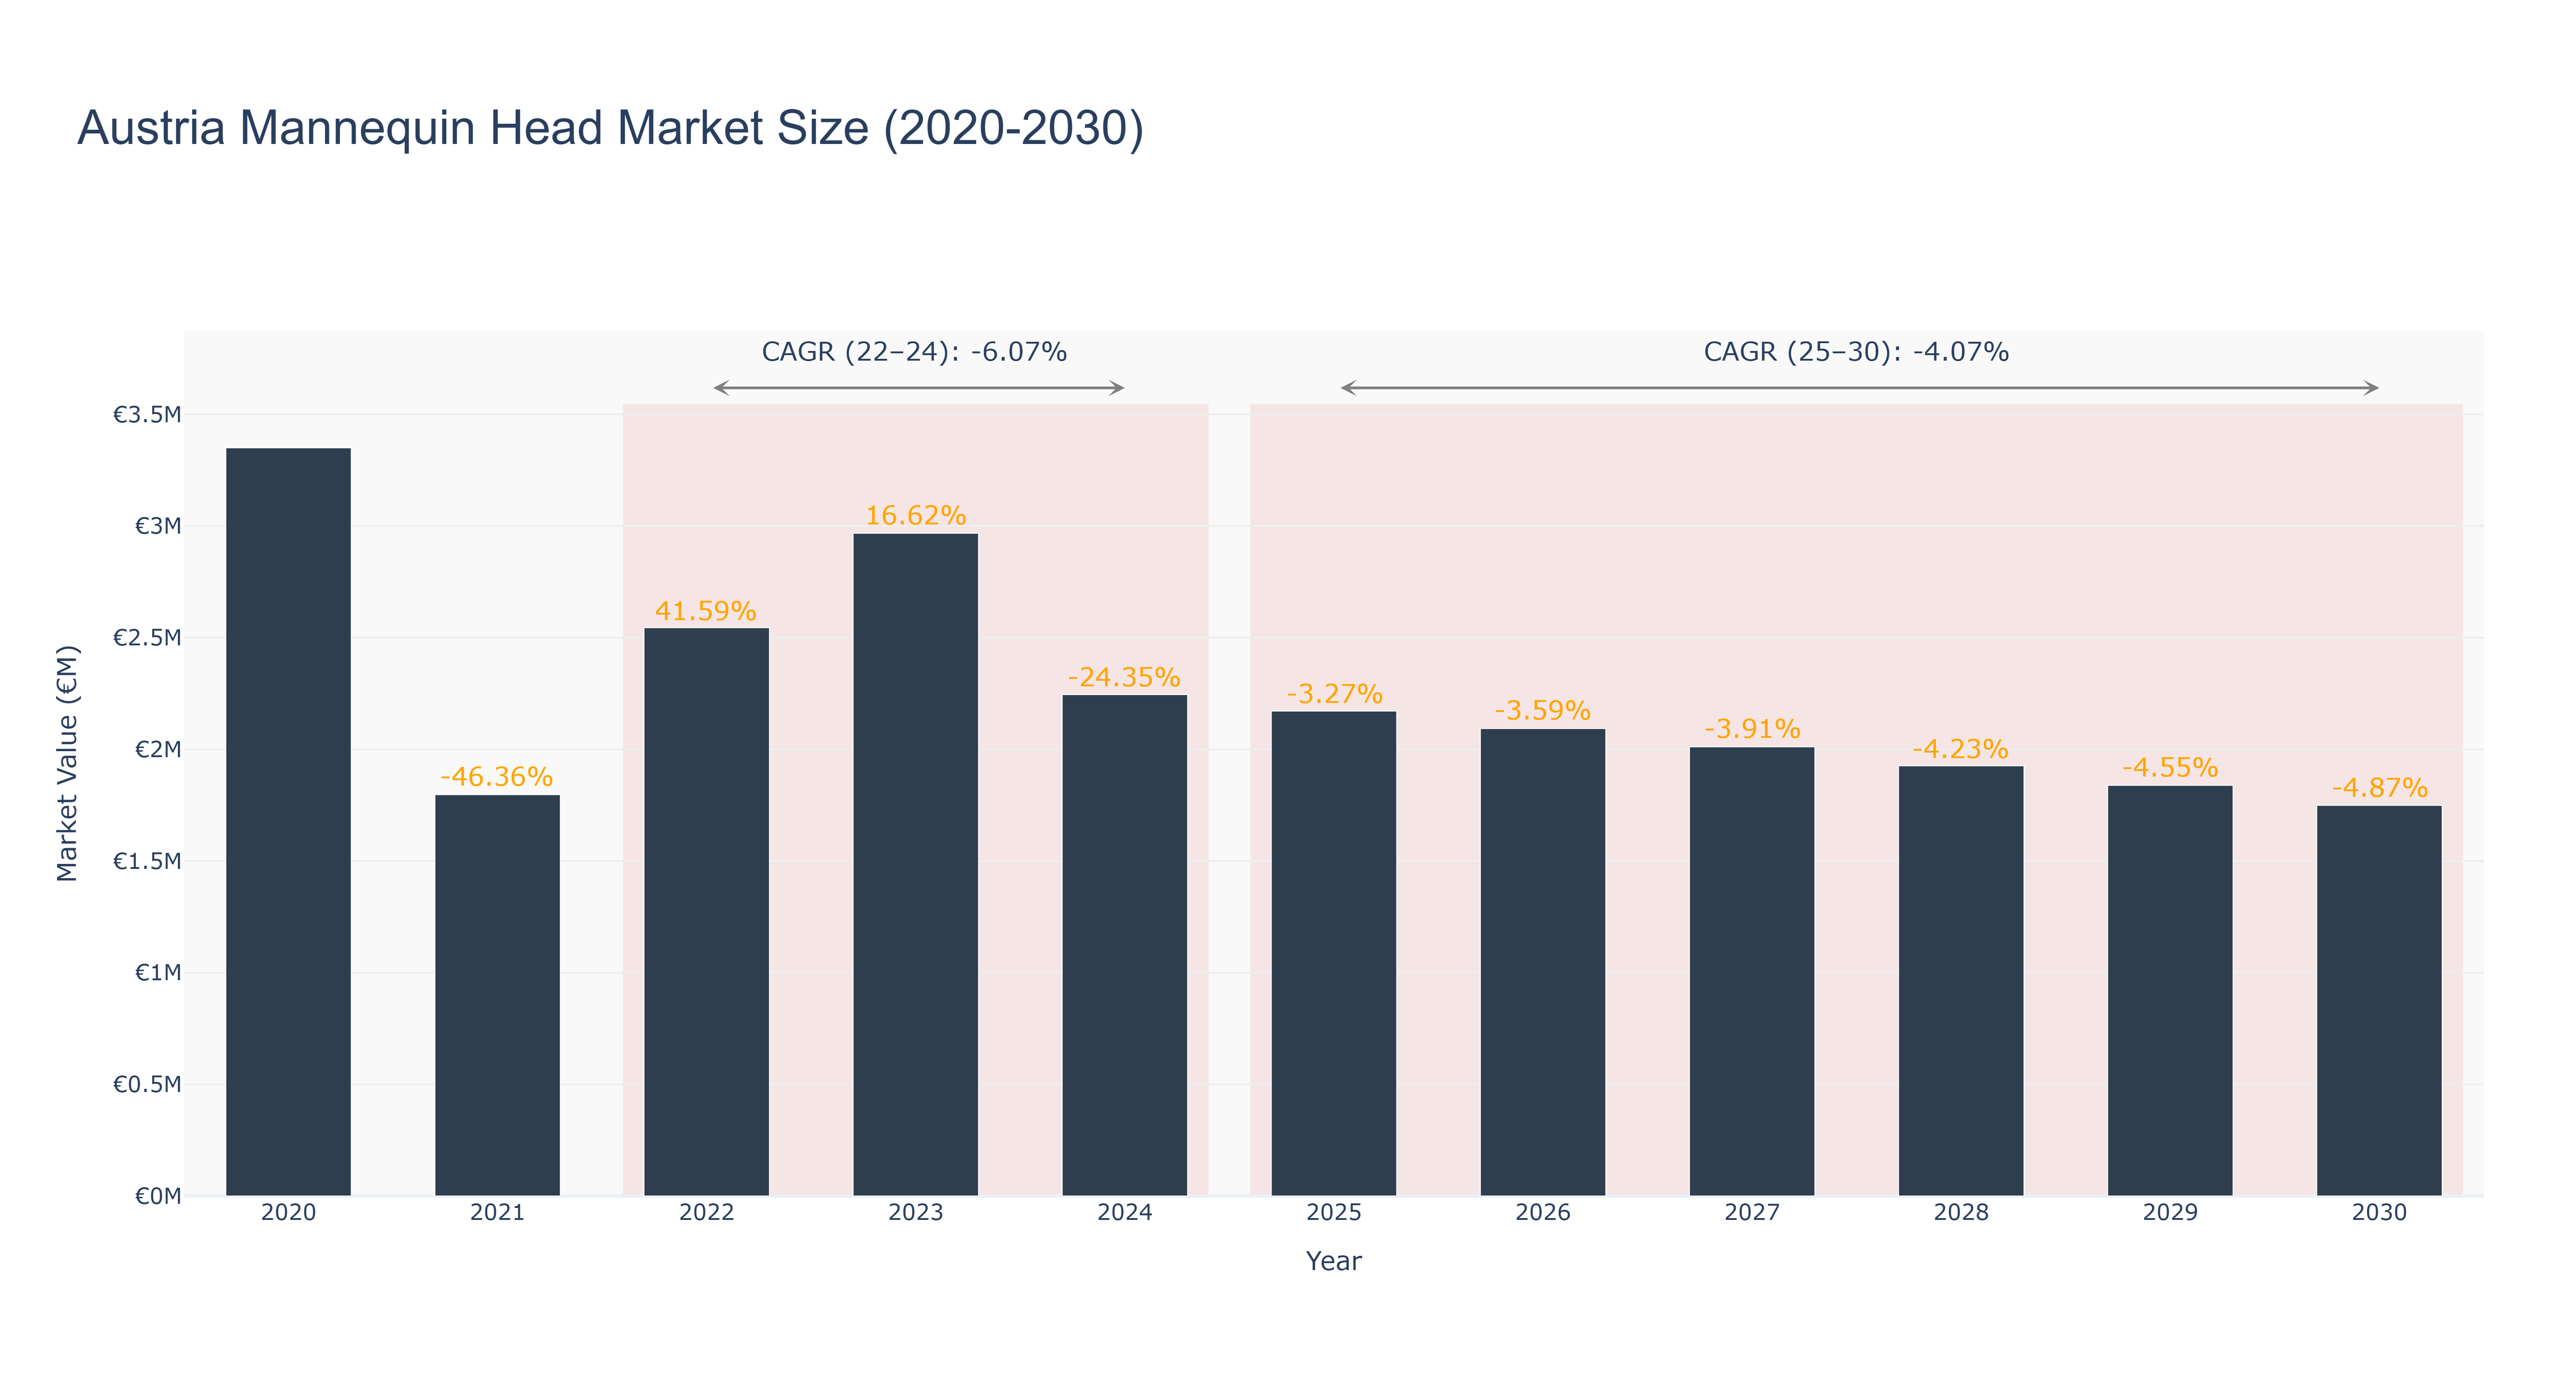
Austria's Mannequin Head Market witnessed a peak market size of €3.35 million in 2020, followed by a steady decline to €2.01 million in 2027. The market is forecasted to further decrease to €1.75 million by 2030, with a CAGR of -4.87% from 2025 to 2030. The market experienced a significant drop in 2021 due to external economic factors, followed by intermittent fluctuations. The CAGR from 2022 to 2024 was -6.07%, reflecting a period of stagnation. Industry drivers such as changing consumer preferences and technological advancements are influencing the market trend. Looking ahead, Austria's Mannequin Head Market is poised for potential revitalization through innovative product designs and enhanced marketing strategies to attract a new wave of consumers, ensuring sustained growth in the coming years.
Austria Mannequin Head Market: Production & Trade Performance (2019-2025)
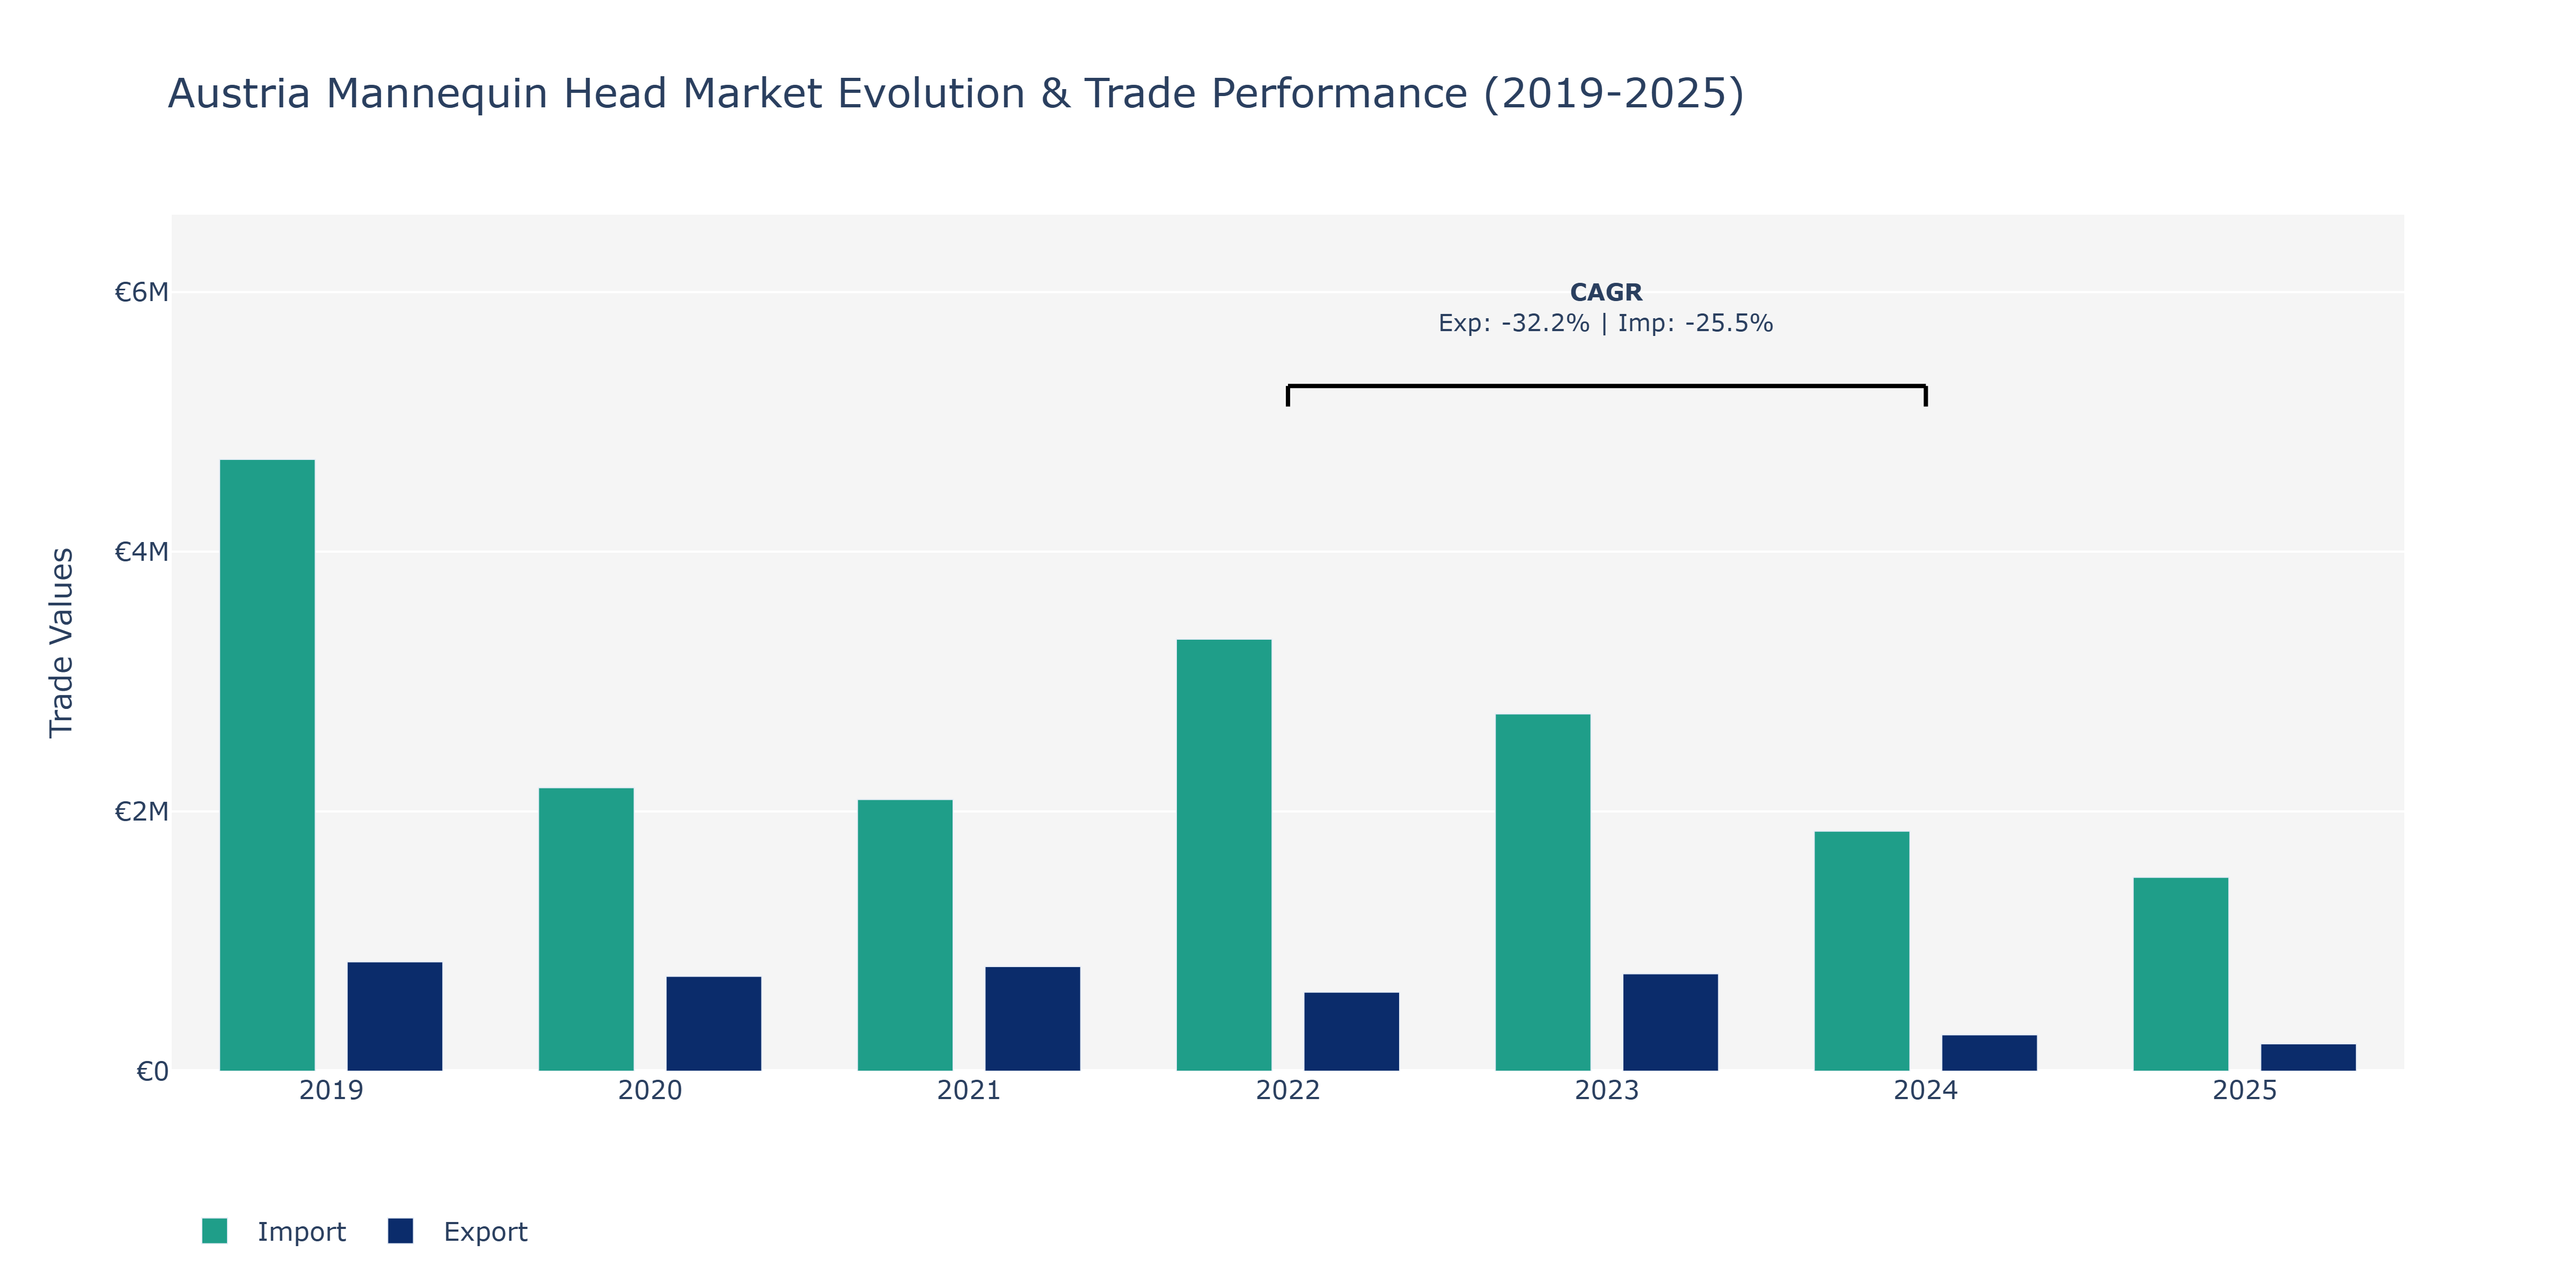
Between 2019 and 2025, Austria's Mannequin Head Market saw notable fluctuations in exports and imports. Exports started at €842.22 thousand in 2019 but experienced a sharp decline to €210.46 thousand in 2025. This significant drop can be attributed to various factors such as changes in consumer preferences, economic conditions, or shifts in global demand for such products. On the other hand, imports began at €4.71 million in 2019, declined to €1.49 million in 2025. The decrease in imports might reflect efforts to reduce dependency on foreign markets, potentially driven by local production initiatives or changes in trade policies. The market's dynamics seem to be evolving, emphasizing the need for industry players to adapt strategies to navigate these fluctuations successfully.
Key Highlights of the Report:
- Austria Mannequin Head Market Outlook
- Market Size of Austria Mannequin Head Market, 2025
- Forecast of Austria Mannequin Head Market, 2032
- Historical Data and Forecast of Austria Mannequin Head Revenues & Volume for the Period 2022-2032F
- Austria Mannequin Head Market Trend Evolution
- Austria Mannequin Head Market Drivers and Challenges
- Austria Mannequin Head Price Trends
- Austria Mannequin Head Porter's Five Forces
- Austria Mannequin Head Industry Life Cycle
- Historical Data and Forecast of Austria Mannequin Head Market Revenues & Volume By Type for the Period 2022-2032F
- Historical Data and Forecast of Austria Mannequin Head Market Revenues & Volume By Men for the Period 2022-2032F
- Historical Data and Forecast of Austria Mannequin Head Market Revenues & Volume By Women for the Period 2022-2032F
- Historical Data and Forecast of Austria Mannequin Head Market Revenues & Volume By Infants & Toddlers for the Period 2022-2032F
- Historical Data and Forecast of Austria Mannequin Head Market Revenues & Volume By Application for the Period 2022-2032F
- Historical Data and Forecast of Austria Mannequin Head Market Revenues & Volume By Hairstyling & Barbering for the Period 2022-2032F
- Historical Data and Forecast of Austria Mannequin Head Market Revenues & Volume By Makeup Artistry for the Period 2022-2032F
- Historical Data and Forecast of Austria Mannequin Head Market Revenues & Volume By Wig & Hairpiece Design for the Period 2022-2032F
- Historical Data and Forecast of Austria Mannequin Head Market Revenues & Volume By Hat & Accessories for the Period 2022-2032F
- Austria Mannequin Head Import Export Trade Statistics
- Market Opportunity Assessment By Type
- Market Opportunity Assessment By Application
- Austria Mannequin Head Top Companies Market Share
- Austria Mannequin Head Competitive Benchmarking By Technical and Operational Parameters
- Austria Mannequin Head Company Profiles
- Austria Mannequin Head Key Strategic Recommendations
Frequently Asked Questions About the Market Study (FAQs):
6Wresearch actively monitors the Austria Mannequin Head Market and publishes its comprehensive annual report, highlighting emerging trends, growth drivers, revenue analysis, and forecast outlook. Our insights help businesses to make data-backed strategic decisions with ongoing market dynamics. Our analysts track relevent industries related to the Austria Mannequin Head Market, allowing our clients with actionable intelligence and reliable forecasts tailored to emerging regional needs.
Yes, we provide customisation as per your requirements. To learn more, feel free to contact us on sales@6wresearch.com
1 Executive Summary |
2 Introduction |
2.1 Key Highlights of the Report |
2.2 Report Description |
2.3 Market Scope & Segmentation |
2.4 Research Methodology |
2.5 Assumptions |
3 Austria Mannequin Head Market Overview |
3.1 Austria Country Macro Economic Indicators |
3.2 Austria Mannequin Head Market Revenues & Volume, 2022 & 2032F |
3.3 Austria Mannequin Head Market - Industry Life Cycle |
3.4 Austria Mannequin Head Market - Porter's Five Forces |
3.5 Austria Mannequin Head Market Revenues & Volume Share, By Type, 2022 & 2032F |
3.6 Austria Mannequin Head Market Revenues & Volume Share, By Application, 2022 & 2032F |
4 Austria Mannequin Head Market Dynamics |
4.1 Impact Analysis |
4.2 Market Drivers |
4.2.1 Increasing demand for mannequin heads in the fashion and retail industry in Austria. |
4.2.2 Growing focus on visual merchandising and product display techniques. |
4.2.3 Rising trend of online shopping leading to higher demand for display mannequin heads. |
4.3 Market Restraints |
4.3.1 High competition from international mannequin head manufacturers. |
4.3.2 Fluctuating raw material prices affecting production costs. |
4.3.3 Challenges in maintaining quality standards and meeting changing customer preferences. |
5 Austria Mannequin Head Market Trends |
6 Austria Mannequin Head Market, By Types |
6.1 Austria Mannequin Head Market, By Type |
6.1.1 Overview and Analysis |
6.1.2 Austria Mannequin Head Market Revenues & Volume, By Type, 2022-2032F |
6.1.3 Austria Mannequin Head Market Revenues & Volume, By Men, 2022-2032F |
6.1.4 Austria Mannequin Head Market Revenues & Volume, By Women, 2022-2032F |
6.1.5 Austria Mannequin Head Market Revenues & Volume, By Infants & Toddlers, 2022-2032F |
6.2 Austria Mannequin Head Market, By Application |
6.2.1 Overview and Analysis |
6.2.2 Austria Mannequin Head Market Revenues & Volume, By Hairstyling & Barbering, 2022-2032F |
6.2.3 Austria Mannequin Head Market Revenues & Volume, By Makeup Artistry, 2022-2032F |
6.2.4 Austria Mannequin Head Market Revenues & Volume, By Wig & Hairpiece Design, 2022-2032F |
6.2.5 Austria Mannequin Head Market Revenues & Volume, By Hat & Accessories, 2022-2032F |
7 Austria Mannequin Head Market Import-Export Trade Statistics |
7.1 Austria Mannequin Head Market Export to Major Countries |
7.2 Austria Mannequin Head Market Imports from Major Countries |
8 Austria Mannequin Head Market Key Performance Indicators |
8.1 Average time taken to launch new mannequin head designs. |
8.2 Percentage of repeat customers indicating satisfaction and loyalty. |
8.3 Number of partnerships with local fashion schools or retailers for promotional activities. |
8.4 Rate of return on investments in marketing campaigns targeting the Austrian market. |
9 Austria Mannequin Head Market - Opportunity Assessment |
9.1 Austria Mannequin Head Market Opportunity Assessment, By Type, 2022 & 2032F |
9.2 Austria Mannequin Head Market Opportunity Assessment, By Application, 2022 & 2032F |
10 Austria Mannequin Head Market - Competitive Landscape |
10.1 Austria Mannequin Head Market Revenue Share, By Companies, 2025 |
10.2 Austria Mannequin Head Market Competitive Benchmarking, By Operating and Technical Parameters |
11 Company Profiles |
12 Recommendations |
13 Disclaimer |
Global Go To Market Strategy - 2030
Export potential enables firms to identify high-growth global markets with greater confidence by combining advanced trade intelligence with a structured quantitative methodology. The framework analyzes emerging demand trends and country-level import patterns while integrating macroeconomic and trade datasets such as GDP and population forecasts, bilateral import–export flows, tariff structures, elasticity differentials between developed and developing economies, geographic distance, and import demand projections. Using weighted trade values from 2020–2024 as the base period to project country-to-country export potential for 2030, these inputs are operationalized through calculated drivers such as gravity model parameters, tariff impact factors, and projected GDP per-capita growth. Through an analysis of hidden potentials, demand hotspots, and market conditions that are most favorable to success, this method enables firms to focus on target countries, maximize returns, and global expansion with data, backed by accuracy.
By factoring in the projected importer demand gap that is currently unmet and could be potential opportunity, it identifies the potential for the Exporter (Country) among 190 countries, against the general trade analysis, which identifies the biggest importer or exporter.
To discover high-growth global markets and optimize your business strategy:
Click Here
Pricing
- Single User License$ 1,995
- Department License$ 2,400
- Site License$ 3,120
- Global License$ 3,795

Leadership Perspectives from Industry Events
Search
Thought Leadership and Analyst Meet


Our Clients
6WResearch In News
- India Air Conditioner Market Set for Strong Rebound in 2026 After Weather-Led Correction and GST-Driven Recovery: 6Wresearch
- ADAS in India: How Automatic Emergency Braking, Blind Spot Detection & Driver Monitoring are Transforming Road Safety
- Doha a strategic location for EV manufacturing hub: IPA Qatar
- Demand for luxury TVs surging in the GCC, says Samsung
- Empowering Growth: The Thriving Journey of Bangladesh’s Cable Industry
- Demand for luxury TVs surging in the GCC, says Samsung
Latest Reports
- Poland Fire Protection Systems Market (2026-2032)
- Cape Verde Portable Hand-Thrown Extinguisher Market (2026-2032)
- Canada Portable Hand-Thrown Extinguisher Market (2026-2032)
- Cameroon Portable Hand-Thrown Extinguisher Market (2026-2032)
- Burundi Portable Hand-Thrown Extinguisher Market (2026-2032)
- Burkina Faso Portable Hand-Thrown Extinguisher Market (2026-2032)
- Bulgaria Portable Hand-Thrown Extinguisher Market (2026-2032)
- Brunei Portable Hand-Thrown Extinguisher Market (2026-2032)
- Botswana Portable Hand-Thrown Extinguisher Market (2026-2032)
- Bosnia and Herzegovina Portable Hand-Thrown Extinguisher Market (2026-2032)
Industry Events and Analyst Meet

HIMTEX 2026

India Refining Summit 2026

India EV Show 2026

EV tech India Expo 2026

Auto Tech Asia 2026
Whitepaper
- Middle East & Africa Commercial Security Market Click here to view more.
- Middle East & Africa Fire Safety Systems & Equipment Market Click here to view more.
- GCC Drone Market Click here to view more.
- Middle East Lighting Fixture Market Click here to view more.
- GCC Physical & Perimeter Security Market Click here to view more.