Austria Protective Clothing Market (2026-2032) | Segmentation, Analysis, Size, Companies, Share, Outlook, Value, Trends, Industry, Growth, Forecast & Revenue
Market Forecast By Material Type (Aramid & Blends, Polyolefins & Blends, Polyamide, Pbi, Uhmw Pe, Cotton Fibers, Laminated Polyesters, Others), By Application (Thermal, Chemical, Mechanical, Biological/radiation, Visibility, Others), By End-use (Oil & Gas, Construction, Manufacturing, Healthcare/medical, Firefighting & Law Enforcement, Mining, Military, Warehouse & Logistics) And Competitive Landscape
| Product Code: ETC5148163 | Publication Date: Nov 2023 | Updated Date: Mar 2026 | Product Type: Market Research Report | |
| Publisher: 6Wresearch | Author: Shubham Padhi | No. of Pages: 60 | No. of Figures: 30 | No. of Tables: 5 |
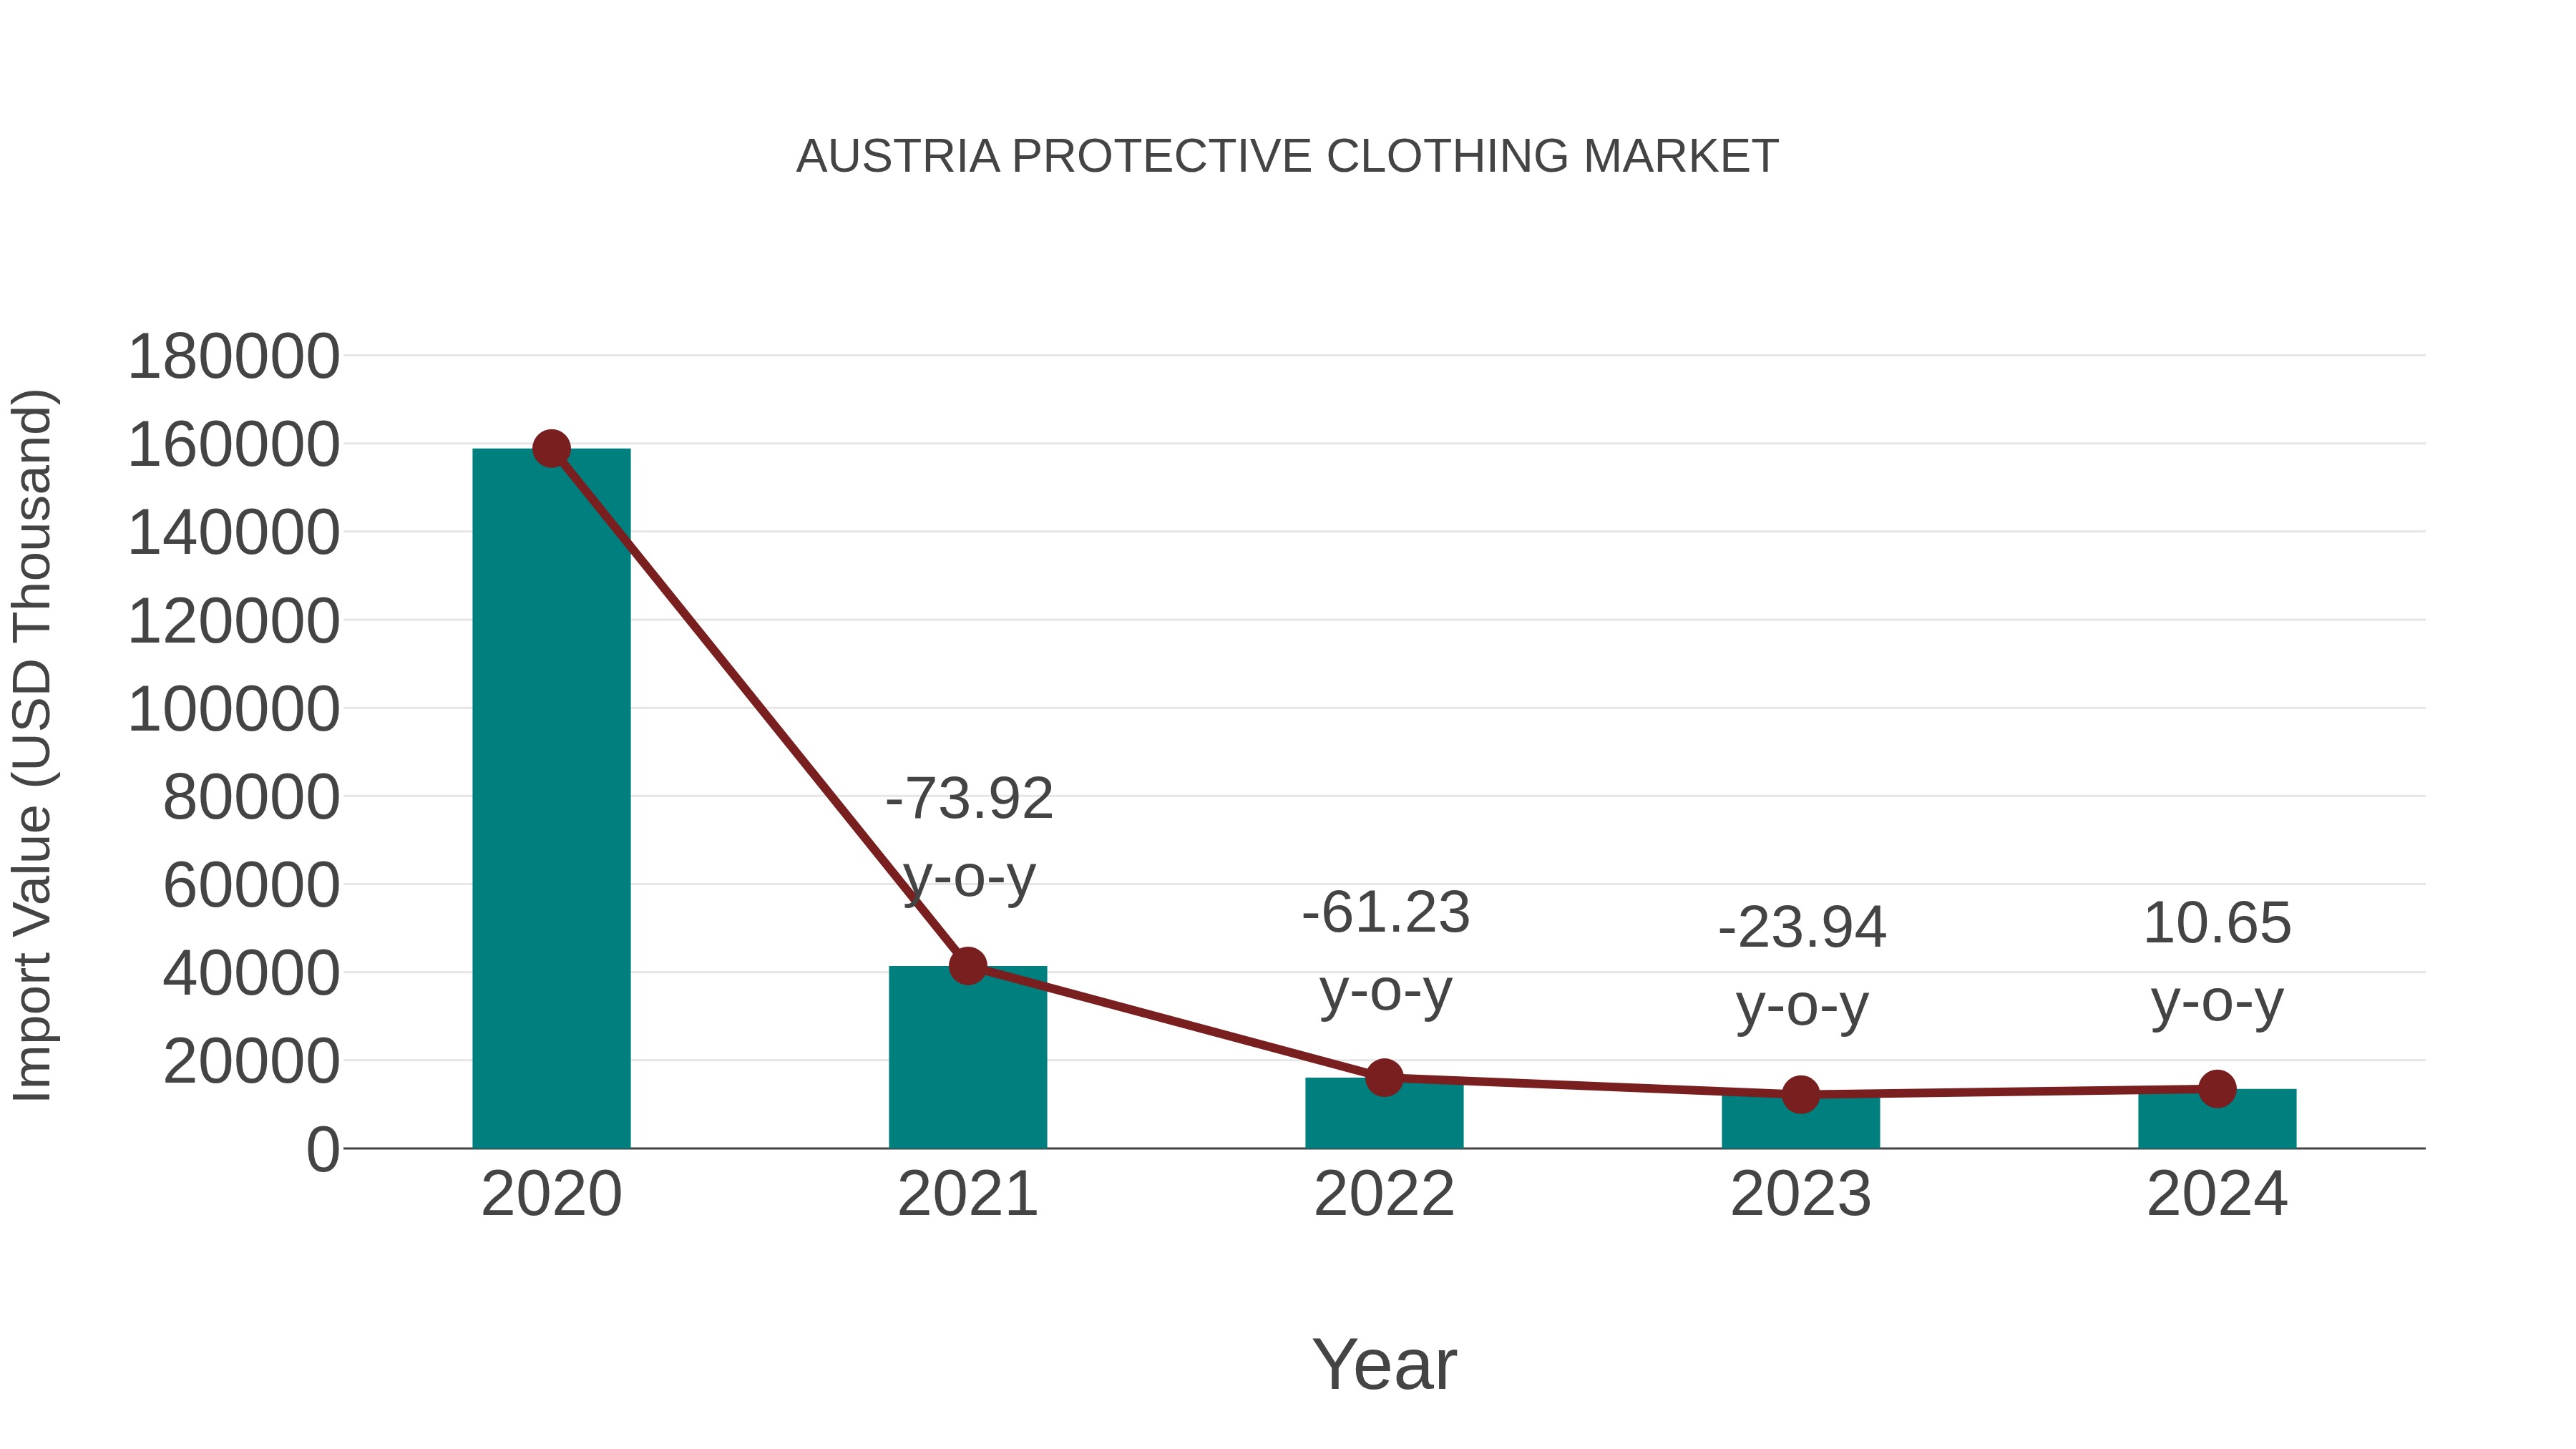
Austria Protective Clothing Market: Import Trend Analysis
In 2024, Austria`s protective clothing market saw a notable increase in imports. The trend indicated a growing reliance on imported protective clothing products, reflecting potential shifts in domestic production or demand dynamics within the industry.
Austria Protective Clothing Market Overview
The protective clothing market in Austria is growing due to increased awareness of workplace safety and stringent regulations governing occupational health and safety. This market includes clothing designed to protect workers from hazards such as chemicals, heat, and mechanical injuries. Key sectors driving demand include manufacturing, healthcare, construction, and emergency services. Technological advancements in materials, such as flame-retardant and high-visibility fabrics, are enhancing the performance and comfort of protective clothing.
Drivers of the market
The protective clothing market in Austria is driven by stringent safety regulations and standards across various industries such as healthcare, manufacturing, and construction. The increasing awareness about workplace safety and the need to protect workers from hazards drive the demand for protective clothing. Additionally, the rising incidents of occupational injuries and the emphasis on worker safety by regulatory bodies further propel market growth. The ongoing COVID-19 pandemic has also significantly increased the demand for protective clothing in the healthcare sector.
Challenges of the market
The protective clothing market in Austria encounters challenges such as stringent safety standards and high production costs. Compliance with rigorous safety and performance standards requires continuous investment in research and development to ensure product efficacy and regulatory approval. The high cost of raw materials, such as specialized fabrics and coatings, also contributes to the overall production costs. Additionally, the market faces competition from low-cost producers in other regions, which puts pressure on local manufacturers to innovate and maintain competitive pricing while ensuring high-quality standards.
Government Policy of the market
The protective clothing market in Austria is influenced by government policies on workplace safety and health regulations. The Austrian Workers Protection Act mandates the use of appropriate protective gear in various industries, thereby driving demand for high-quality protective clothing. Additionally, standards set by the European Committee for Standardization (CEN) ensure that protective clothing meets specific safety and performance criteria, impacting both the design and production processes in the market.
Key Highlights of the Report:
- Austria Protective Clothing Market Outlook
- Market Size of Austria Protective Clothing Market, 2025
- Forecast of Austria Protective Clothing Market, 2032
- Historical Data and Forecast of Austria Protective Clothing Revenues & Volume for the Period 2022-2032F
- Austria Protective Clothing Market Trend Evolution
- Austria Protective Clothing Market Drivers and Challenges
- Austria Protective Clothing Price Trends
- Austria Protective Clothing Porter`s Five Forces
- Austria Protective Clothing Industry Life Cycle
- Historical Data and Forecast of Austria Protective Clothing Market Revenues & Volume By Material Type for the Period 2022-2032F
- Historical Data and Forecast of Austria Protective Clothing Market Revenues & Volume By Aramid & Blends for the Period 2022-2032F
- Historical Data and Forecast of Austria Protective Clothing Market Revenues & Volume By Polyolefins & Blends for the Period 2022-2032F
- Historical Data and Forecast of Austria Protective Clothing Market Revenues & Volume By Polyamide for the Period 2022-2032F
- Historical Data and Forecast of Austria Protective Clothing Market Revenues & Volume By Pbi for the Period 2022-2032F
- Historical Data and Forecast of Austria Protective Clothing Market Revenues & Volume By Uhmw Pe for the Period 2022-2032F
- Historical Data and Forecast of Austria Protective Clothing Market Revenues & Volume By Cotton Fibers for the Period 2022-2032F
- Historical Data and Forecast of Austria Protective Clothing Market Revenues & Volume By Laminated Polyesters for the Period 2022-2032F
- Historical Data and Forecast of Austria Aramid & Blends Protective Clothing Market Revenues & Volume By Others for the Period 2022-2032F
- Historical Data and Forecast of Austria Protective Clothing Market Revenues & Volume By Application for the Period 2022-2032F
- Historical Data and Forecast of Austria Protective Clothing Market Revenues & Volume By Thermal for the Period 2022-2032F
- Historical Data and Forecast of Austria Protective Clothing Market Revenues & Volume By Chemical for the Period 2022-2032F
- Historical Data and Forecast of Austria Protective Clothing Market Revenues & Volume By Mechanical for the Period 2022-2032F
- Historical Data and Forecast of Austria Protective Clothing Market Revenues & Volume By Biological/radiation for the Period 2022-2032F
- Historical Data and Forecast of Austria Protective Clothing Market Revenues & Volume By Visibility for the Period 2022-2032F
- Historical Data and Forecast of Austria Protective Clothing Market Revenues & Volume By Others for the Period 2022-2032F
- Historical Data and Forecast of Austria Protective Clothing Market Revenues & Volume By End-use for the Period 2022-2032F
- Historical Data and Forecast of Austria Protective Clothing Market Revenues & Volume By Oil & Gas for the Period 2022-2032F
- Historical Data and Forecast of Austria Protective Clothing Market Revenues & Volume By Construction for the Period 2022-2032F
- Historical Data and Forecast of Austria Protective Clothing Market Revenues & Volume By Manufacturing for the Period 2022-2032F
- Historical Data and Forecast of Austria Protective Clothing Market Revenues & Volume By Healthcare/medical for the Period 2022-2032F
- Historical Data and Forecast of Austria Protective Clothing Market Revenues & Volume By Firefighting & Law Enforcement for the Period 2022-2032F
- Historical Data and Forecast of Austria Protective Clothing Market Revenues & Volume By Mining for the Period 2022-2032F
- Historical Data and Forecast of Austria Protective Clothing Market Revenues & Volume By Military for the Period 2022-2032F
- Historical Data and Forecast of Austria Protective Clothing Market Revenues & Volume By Warehouse & Logistics for the Period 2022-2032F
- Austria Protective Clothing Import Export Trade Statistics
- Market Opportunity Assessment By Material Type
- Market Opportunity Assessment By Application
- Market Opportunity Assessment By End-use
- Austria Protective Clothing Top Companies Market Share
- Austria Protective Clothing Competitive Benchmarking By Technical and Operational Parameters
- Austria Protective Clothing Company Profiles
- Austria Protective Clothing Key Strategic Recommendations
Austria Protective Clothing Market (2026-2032): FAQs
6Wresearch actively monitors the Austria Protective Clothing Market and publishes its comprehensive annual report, highlighting emerging trends, growth drivers, revenue analysis, and forecast outlook. Our insights help businesses to make data-backed strategic decisions with ongoing market dynamics. Our analysts track relevent industries related to the Austria Protective Clothing Market, allowing our clients with actionable intelligence and reliable forecasts tailored to emerging regional needs.
Yes, we provide customisation as per your requirements. To learn more, feel free to contact us on sales@6wresearch.com
1 Executive Summary |
2 Introduction |
2.1 Key Highlights of the Report |
2.2 Report Description |
2.3 Market Scope & Segmentation |
2.4 Research Methodology |
2.5 Assumptions |
3 Austria Protective Clothing Market Overview |
3.1 Austria Country Macro Economic Indicators |
3.2 Austria Protective Clothing Market Revenues & Volume, 2022 & 2032F |
3.3 Austria Protective Clothing Market - Industry Life Cycle |
3.4 Austria Protective Clothing Market - Porter's Five Forces |
3.5 Austria Protective Clothing Market Revenues & Volume Share, By Material Type, 2022 & 2032F |
3.6 Austria Protective Clothing Market Revenues & Volume Share, By Application, 2022 & 2032F |
3.7 Austria Protective Clothing Market Revenues & Volume Share, By End-use, 2022 & 2032F |
4 Austria Protective Clothing Market Dynamics |
4.1 Impact Analysis |
4.2 Market Drivers |
4.2.1 Increasing awareness about workplace safety regulations |
4.2.2 Rising demand for protective clothing in industries like construction, manufacturing, and healthcare |
4.2.3 Technological advancements leading to innovative and more protective clothing materials |
4.3 Market Restraints |
4.3.1 High initial costs associated with purchasing protective clothing |
4.3.2 Limited availability of specialized protective clothing for certain niche industries |
4.3.3 Challenges related to proper fitting and comfort of protective clothing leading to reduced adoption rates |
5 Austria Protective Clothing Market Trends |
6 Austria Protective Clothing Market Segmentations |
6.1 Austria Protective Clothing Market, By Material Type |
6.1.1 Overview and Analysis |
6.1.2 Austria Protective Clothing Market Revenues & Volume, By Aramid & Blends, 2022-2032F |
6.1.3 Austria Protective Clothing Market Revenues & Volume, By Polyolefins & Blends, 2022-2032F |
6.1.4 Austria Protective Clothing Market Revenues & Volume, By Polyamide, 2022-2032F |
6.1.5 Austria Protective Clothing Market Revenues & Volume, By Pbi, 2022-2032F |
6.1.6 Austria Protective Clothing Market Revenues & Volume, By Uhmw Pe, 2022-2032F |
6.1.7 Austria Protective Clothing Market Revenues & Volume, By Cotton Fibers, 2022-2032F |
6.1.9 Austria Protective Clothing Market Revenues & Volume, By Others, 2022-2032F |
6.1.10 Austria Protective Clothing Market Revenues & Volume, By Others, 2022-2032F |
6.2 Austria Protective Clothing Market, By Application |
6.2.1 Overview and Analysis |
6.2.2 Austria Protective Clothing Market Revenues & Volume, By Thermal, 2022-2032F |
6.2.3 Austria Protective Clothing Market Revenues & Volume, By Chemical, 2022-2032F |
6.2.4 Austria Protective Clothing Market Revenues & Volume, By Mechanical, 2022-2032F |
6.2.5 Austria Protective Clothing Market Revenues & Volume, By Biological/radiation, 2022-2032F |
6.2.6 Austria Protective Clothing Market Revenues & Volume, By Visibility, 2022-2032F |
6.2.7 Austria Protective Clothing Market Revenues & Volume, By Others, 2022-2032F |
6.3 Austria Protective Clothing Market, By End-use |
6.3.1 Overview and Analysis |
6.3.2 Austria Protective Clothing Market Revenues & Volume, By Oil & Gas, 2022-2032F |
6.3.3 Austria Protective Clothing Market Revenues & Volume, By Construction, 2022-2032F |
6.3.4 Austria Protective Clothing Market Revenues & Volume, By Manufacturing, 2022-2032F |
6.3.5 Austria Protective Clothing Market Revenues & Volume, By Healthcare/medical, 2022-2032F |
6.3.6 Austria Protective Clothing Market Revenues & Volume, By Firefighting & Law Enforcement, 2022-2032F |
6.3.7 Austria Protective Clothing Market Revenues & Volume, By Mining, 2022-2032F |
6.3.8 Austria Protective Clothing Market Revenues & Volume, By Warehouse & Logistics, 2022-2032F |
6.3.9 Austria Protective Clothing Market Revenues & Volume, By Warehouse & Logistics, 2022-2032F |
6.3.10 Austria Protective Clothing Market Revenues & Volume, By Others, 2022-2032F |
7 Austria Protective Clothing Market Import-Export Trade Statistics |
7.1 Austria Protective Clothing Market Export to Major Countries |
7.2 Austria Protective Clothing Market Imports from Major Countries |
8 Austria Protective Clothing Market Key Performance Indicators |
8.1 Percentage of companies compliant with safety regulations regarding protective clothing |
8.2 Adoption rate of new technologies in protective clothing manufacturing |
8.3 Number of workplace accidents reduced due to the use of protective clothing |
9 Austria Protective Clothing Market - Opportunity Assessment |
9.1 Austria Protective Clothing Market Opportunity Assessment, By Material Type, 2022 & 2032F |
9.2 Austria Protective Clothing Market Opportunity Assessment, By Application, 2022 & 2032F |
9.3 Austria Protective Clothing Market Opportunity Assessment, By End-use, 2022 & 2032F |
10 Austria Protective Clothing Market - Competitive Landscape |
10.1 Austria Protective Clothing Market Revenue Share, By Companies, 2025 |
10.2 Austria Protective Clothing Market Competitive Benchmarking, By Operating and Technical Parameters |
11 Company Profiles |
12 Recommendations | 13 Disclaimer |
Export potential assessment - trade Analytics for 2030
Export potential enables firms to identify high-growth global markets with greater confidence by combining advanced trade intelligence with a structured quantitative methodology. The framework analyzes emerging demand trends and country-level import patterns while integrating macroeconomic and trade datasets such as GDP and population forecasts, bilateral import–export flows, tariff structures, elasticity differentials between developed and developing economies, geographic distance, and import demand projections. Using weighted trade values from 2020–2024 as the base period to project country-to-country export potential for 2030, these inputs are operationalized through calculated drivers such as gravity model parameters, tariff impact factors, and projected GDP per-capita growth. Through an analysis of hidden potentials, demand hotspots, and market conditions that are most favorable to success, this method enables firms to focus on target countries, maximize returns, and global expansion with data, backed by accuracy.
By factoring in the projected importer demand gap that is currently unmet and could be potential opportunity, it identifies the potential for the Exporter (Country) among 190 countries, against the general trade analysis, which identifies the biggest importer or exporter.
To discover high-growth global markets and optimize your business strategy:
Click Here
Pricing
- Single User License$ 1,995
- Department License$ 2,400
- Site License$ 3,120
- Global License$ 3,795

Search
Thought Leadership and Analyst Meet


Our Clients
Latest Reports
- India Ultrasonic Smart Water Meter Market (2026-2032) | Outlook, Competition, Drivers, Trends, Demand, Competitive, Strategic Insights, Companies, Challenges, Strategy, Consumer Insights, Analysis, Opportunities, Growth, Size, Share, Industry, Revenue, Segments, Value, Segmentation, Supply, Forecast, Restraints,
- India Electromagnetic Bulk Flow Meter Market (2026-2032) | Analysis, Challenges, Strategic Insights, Supply, Forecast, Growth, Share, Consumer Insights, Competitive, Value, Outlook, Size & Demand,
- India Battery Powered Bulk Flow Meter Market (2026-2032) | Outlook, Analysis, Competitive Landscape, Growth, Size, Trends, Value, Revenue, Companies, Segmentation, Share & Forecast
- Bosnia and Herzegovina Fuel-Efficient Winglets Market (2026-2032) | Growth, Competition, Strategy, Restraints, Trends, Challenges, segmentation, Value, Outlook, Investment Opportunities, Analysis, Revenue, Companies, Insights, Pricing, Size, Drivers, Demand, Share, Forecast
- Canada Cloud CFD Market (2026-2032) | Size & Revenue, Industry, Growth, Competitive Landscape, Forecast, Segmentation, Value, Outlook, Trends, Share, Analysis, Companies
- Taiwan Food Delivery Platform Market (2026-2032) | Companies, Outlook, Analysis, Trends, Value, Revenue, Segmentation, Share, Forecast, Competitive Landscape, Growth, Size & Forecast
- United Kingdom (UK) Long-term Care Insurance Market (2026-2032) | Growth, Share, Consumer Insights, Drivers, Opportunities, Competition, Pricing Analysis, Segments, Restraints, Companies, Competitive, Value, Outlook, Size, Demand, Analysis, Challenges, Strategic Insights, Investment Trends, Revenue, Trends, Supply, Forecast
- United Kingdom (UK) Long Term Care Market (2026-2032) | Companies, Outlook, Analysis, Trends, Value, Revenue, Segmentation, Share, Forecast, Competitive Landscape, Growth, Size & Forecast
- Iraq Insulation and Waterproofing Market (2026-2032) | Outlook, Drivers, Growth, Size, Share, Industry, Revenue, Trends, Demand, Competitive, Strategic Insights, Opportunities, Segments, Companies, Challenges, Strategy, Consumer Insights, Analysis, Investment Trends, Value, Segmentation, Forecast, Restraints
- India Switchgear Market Outlook (2026-2032) | Size, Share, Trends, Growth, Revenue, Forecast, Analysis, Value, Outlook
Industry Events and Analyst Meet

HIMTEX 2026

India Refining Summit 2026

India EV Show 2026

EV tech India Expo 2026

Auto Tech Asia 2026
Whitepaper
- Middle East & Africa Commercial Security Market Click here to view more.
- Middle East & Africa Fire Safety Systems & Equipment Market Click here to view more.
- GCC Drone Market Click here to view more.
- Middle East Lighting Fixture Market Click here to view more.
- GCC Physical & Perimeter Security Market Click here to view more.
6WResearch In News
- Doha a strategic location for EV manufacturing hub: IPA Qatar
- Demand for luxury TVs surging in the GCC, says Samsung
- Empowering Growth: The Thriving Journey of Bangladesh’s Cable Industry
- Demand for luxury TVs surging in the GCC, says Samsung
- Video call with a traditional healer? Once unthinkable, it’s now common in South Africa
- Intelligent Buildings To Smooth GCC’s Path To Net Zero