Austria Spunbond Market (2026-2032) | Forecast, Industry, Segmentation, Analysis, Value, Size & Revenue, Outlook, Companies, Trends, Growth, Competitive Landscape, Share
Market Forecast By Type (Fine Denier PET, Nylon, Nylon Raw Material, Adipic Acid, Caprolactam), By Application (Automotive, Filtration, Rubber Belting/Hoses, Rubber Transfer Molding, Embroidery/Apparel), By Composites (Carpet/Rugs, Agriculture, Electrical and Electronics, Textile, Home Furnishing, Tapes/Adhesives) And Competitive Landscape
| Product Code: ETC6213452 | Publication Date: Sep 2024 | Updated Date: Feb 2026 | Product Type: Market Research Report | |
| Publisher: 6Wresearch | Author: Summon Dutta | No. of Pages: 75 | No. of Figures: 35 | No. of Tables: 20 |
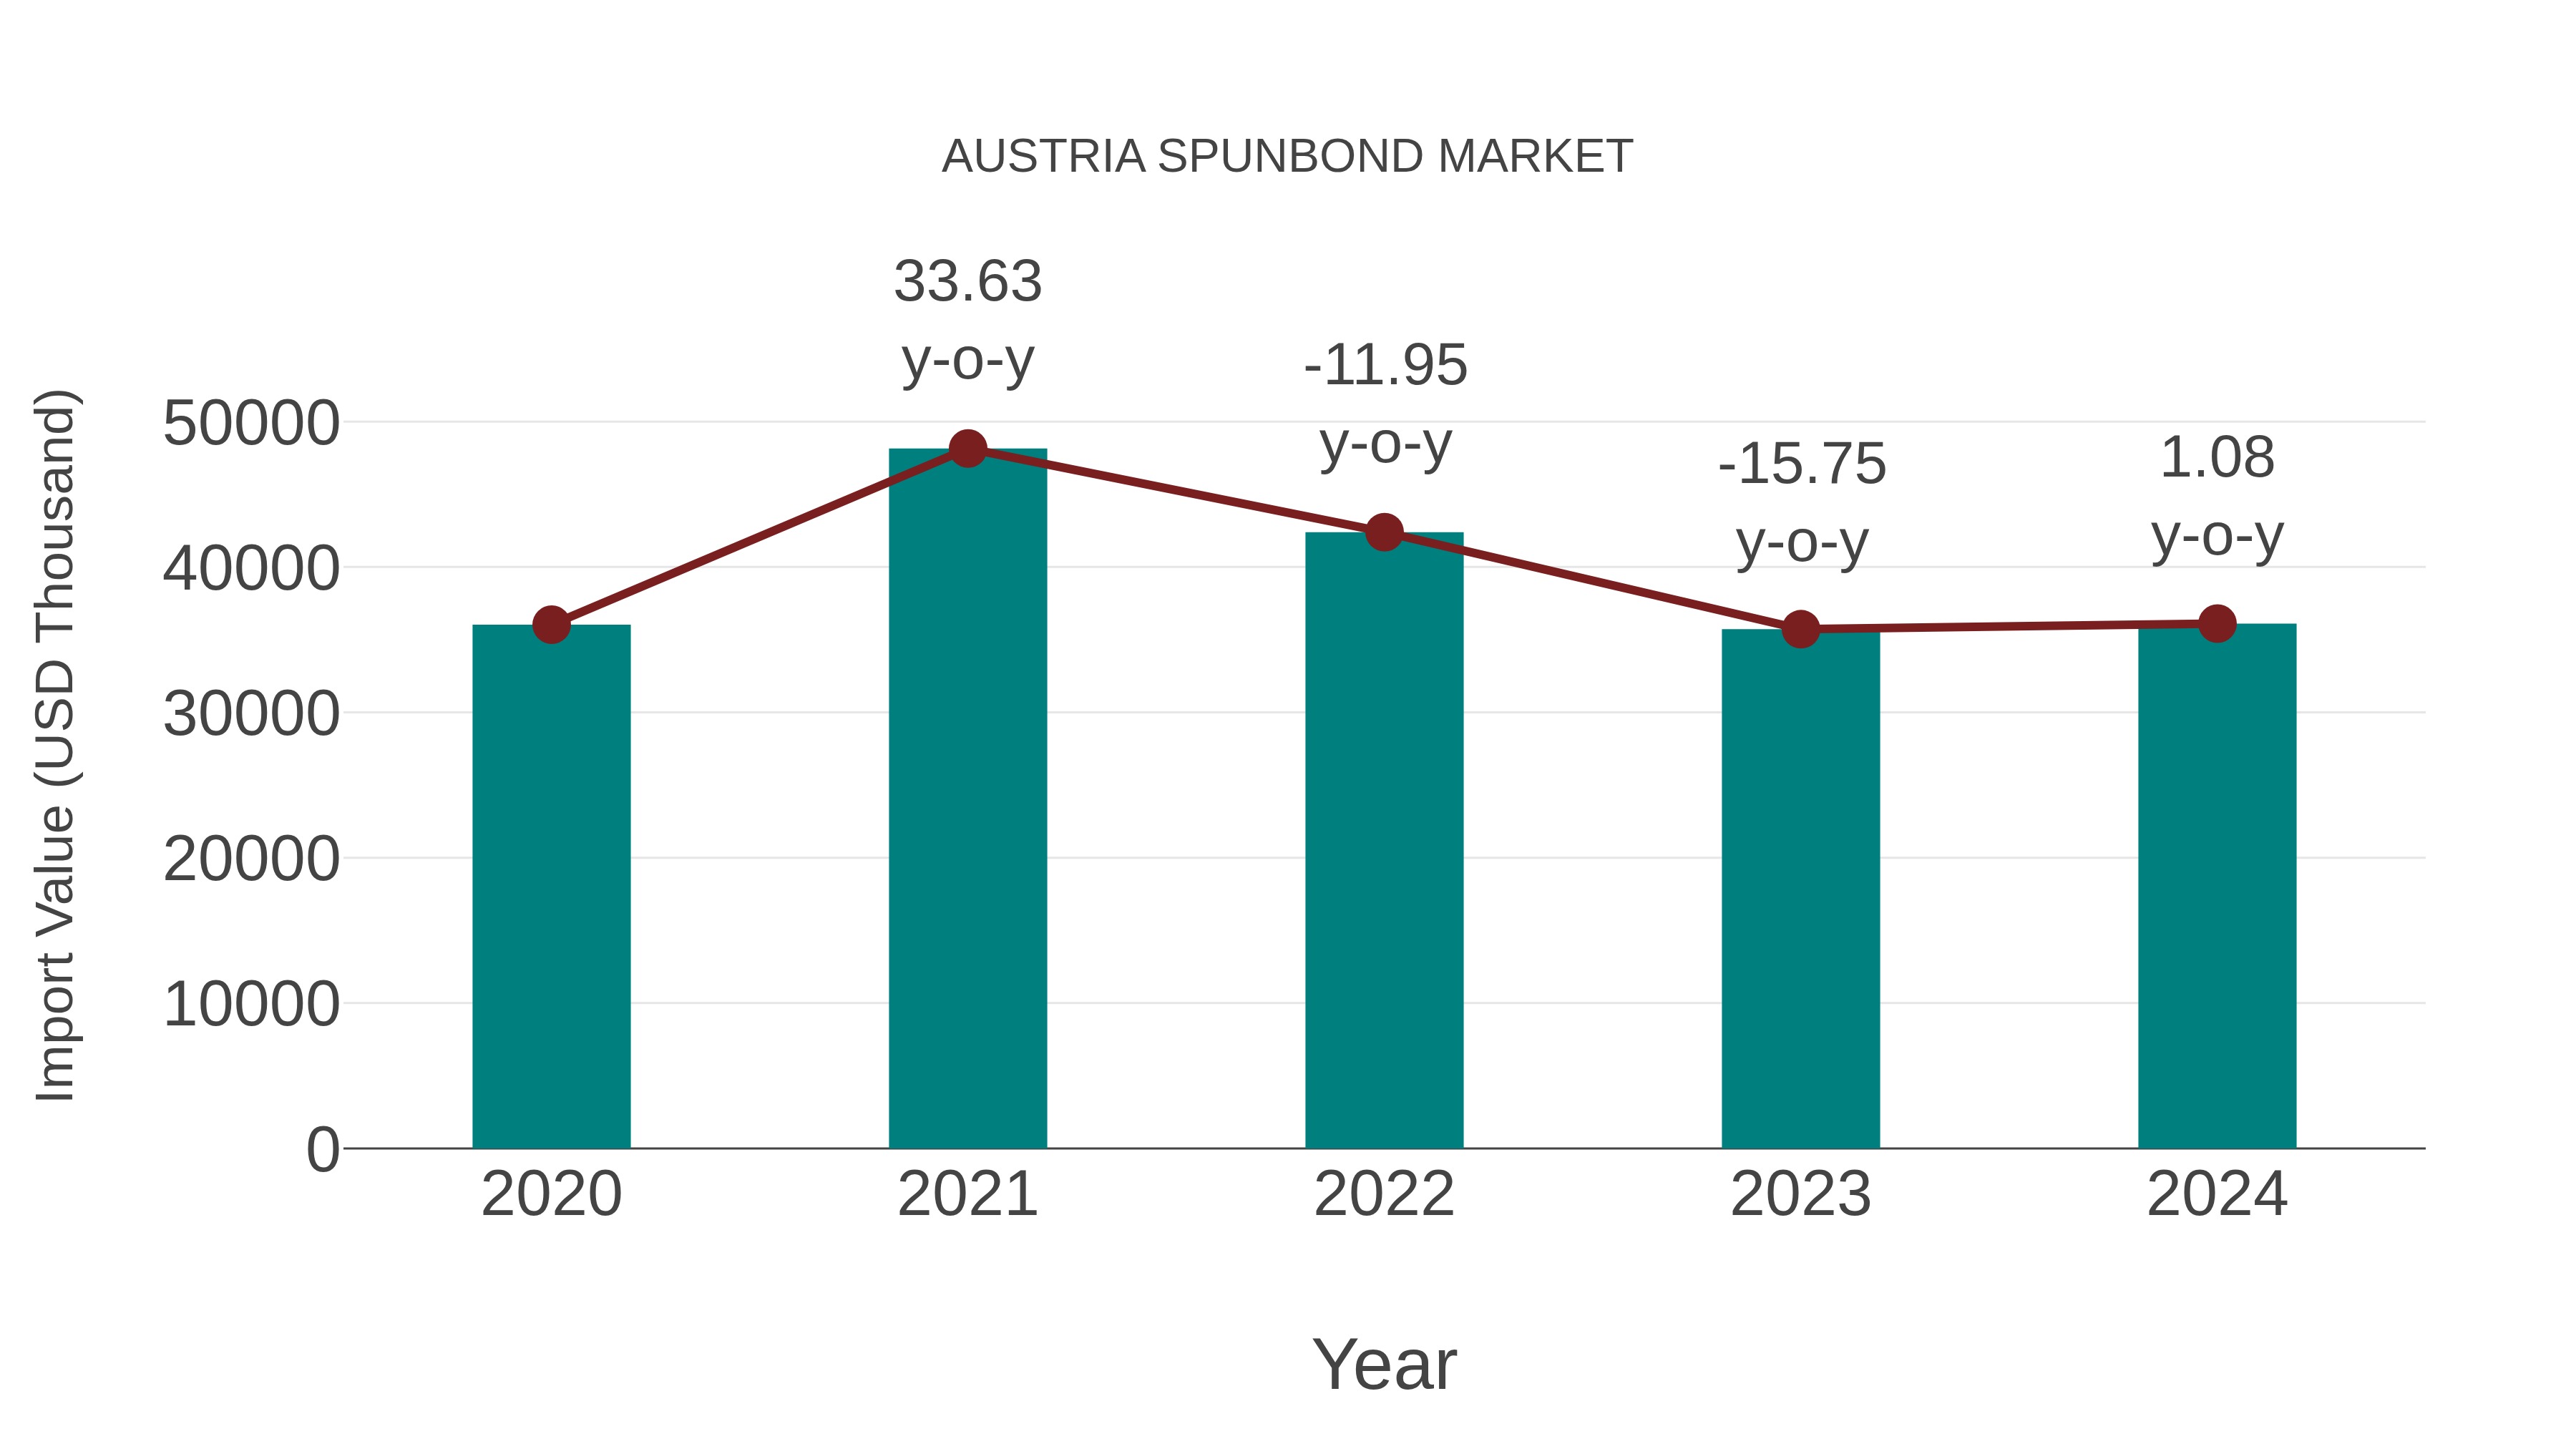
Austria Spunbond Market: Import Trend Analysis
In 2024, Austria`s spunbond market saw a consistent upward trend in imports. The data indicated a steady increase in imported spunbond materials, reflecting a growing demand within the Austrian market for these products.
Key Highlights of the Report:
- Austria Spunbond Market Outlook
- Market Size of Austria Spunbond Market, 2025
- Forecast of Austria Spunbond Market, 2032
- Historical Data and Forecast of Austria Spunbond Revenues & Volume for the Period 2022-2032F
- Austria Spunbond Market Trend Evolution
- Austria Spunbond Market Drivers and Challenges
- Austria Spunbond Price Trends
- Austria Spunbond Porter's Five Forces
- Austria Spunbond Industry Life Cycle
- Historical Data and Forecast of Austria Spunbond Market Revenues & Volume By Type for the Period 2022-2032F
- Historical Data and Forecast of Austria Spunbond Market Revenues & Volume By Fine Denier PET for the Period 2022-2032F
- Historical Data and Forecast of Austria Spunbond Market Revenues & Volume By Nylon for the Period 2022-2032F
- Historical Data and Forecast of Austria Spunbond Market Revenues & Volume By Nylon Raw Material for the Period 2022-2032F
- Historical Data and Forecast of Austria Spunbond Market Revenues & Volume By Adipic Acid for the Period 2022-2032F
- Historical Data and Forecast of Austria Spunbond Market Revenues & Volume By Caprolactam for the Period 2022-2032F
- Historical Data and Forecast of Austria Spunbond Market Revenues & Volume By Application for the Period 2022-2032F
- Historical Data and Forecast of Austria Spunbond Market Revenues & Volume By Automotive for the Period 2022-2032F
- Historical Data and Forecast of Austria Spunbond Market Revenues & Volume By Filtration for the Period 2022-2032F
- Historical Data and Forecast of Austria Spunbond Market Revenues & Volume By Rubber Belting/Hoses for the Period 2022-2032F
- Historical Data and Forecast of Austria Spunbond Market Revenues & Volume By Rubber Transfer Molding for the Period 2022-2032F
- Historical Data and Forecast of Austria Spunbond Market Revenues & Volume By Embroidery/Apparel for the Period 2022-2032F
- Historical Data and Forecast of Austria Spunbond Market Revenues & Volume By Composites for the Period 2022-2032F
- Historical Data and Forecast of Austria Spunbond Market Revenues & Volume By Carpet/Rugs for the Period 2022-2032F
- Historical Data and Forecast of Austria Spunbond Market Revenues & Volume By Agriculture for the Period 2022-2032F
- Historical Data and Forecast of Austria Spunbond Market Revenues & Volume By Electrical and Electronics for the Period 2022-2032F
- Historical Data and Forecast of Austria Spunbond Market Revenues & Volume By Textile for the Period 2022-2032F
- Historical Data and Forecast of Austria Spunbond Market Revenues & Volume By Home Furnishing for the Period 2022-2032F
- Historical Data and Forecast of Austria Spunbond Market Revenues & Volume By Tapes/Adhesives for the Period 2022-2032F
- Austria Spunbond Import Export Trade Statistics
- Market Opportunity Assessment By Type
- Market Opportunity Assessment By Application
- Market Opportunity Assessment By Composites
- Austria Spunbond Top Companies Market Share
- Austria Spunbond Competitive Benchmarking By Technical and Operational Parameters
- Austria Spunbond Company Profiles
- Austria Spunbond Key Strategic Recommendations
Frequently Asked Questions About the Market Study (FAQs):
6Wresearch actively monitors the Austria Spunbond Market and publishes its comprehensive annual report, highlighting emerging trends, growth drivers, revenue analysis, and forecast outlook. Our insights help businesses to make data-backed strategic decisions with ongoing market dynamics. Our analysts track relevent industries related to the Austria Spunbond Market, allowing our clients with actionable intelligence and reliable forecasts tailored to emerging regional needs.
Yes, we provide customisation as per your requirements. To learn more, feel free to contact us on sales@6wresearch.com
1 Executive Summary |
2 Introduction |
2.1 Key Highlights of the Report |
2.2 Report Description |
2.3 Market Scope & Segmentation |
2.4 Research Methodology |
2.5 Assumptions |
3 Austria Spunbond Market Overview |
3.1 Austria Country Macro Economic Indicators |
3.2 Austria Spunbond Market Revenues & Volume, 2022 & 2032F |
3.3 Austria Spunbond Market - Industry Life Cycle |
3.4 Austria Spunbond Market - Porter's Five Forces |
3.5 Austria Spunbond Market Revenues & Volume Share, By Type, 2022 & 2032F |
3.6 Austria Spunbond Market Revenues & Volume Share, By Application, 2022 & 2032F |
3.7 Austria Spunbond Market Revenues & Volume Share, By Composites, 2022 & 2032F |
4 Austria Spunbond Market Dynamics |
4.1 Impact Analysis |
4.2 Market Drivers |
4.2.1 Growing demand for nonwoven fabrics in various industries such as healthcare, agriculture, and automotive, which fuels the demand for spunbond products. |
4.2.2 Increasing focus on sustainable and eco-friendly materials, with spunbond being considered a more environmentally friendly option compared to traditional materials. |
4.2.3 Technological advancements leading to enhanced product quality and performance, making spunbond materials more attractive to consumers. |
4.3 Market Restraints |
4.3.1 Fluctuating raw material prices, particularly in the petrochemical industry, which can impact production costs and pricing of spunbond products. |
4.3.2 Intense competition from other nonwoven technologies and alternative materials, posing a challenge to market penetration and growth. |
4.3.3 Regulatory challenges related to environmental standards and certifications, which can increase compliance costs for manufacturers in the spunbond market. |
5 Austria Spunbond Market Trends |
6 Austria Spunbond Market, By Types |
6.1 Austria Spunbond Market, By Type |
6.1.1 Overview and Analysis |
6.1.2 Austria Spunbond Market Revenues & Volume, By Type, 2022-2032F |
6.1.3 Austria Spunbond Market Revenues & Volume, By Fine Denier PET, 2022-2032F |
6.1.4 Austria Spunbond Market Revenues & Volume, By Nylon, 2022-2032F |
6.1.5 Austria Spunbond Market Revenues & Volume, By Nylon Raw Material, 2022-2032F |
6.1.6 Austria Spunbond Market Revenues & Volume, By Adipic Acid, 2022-2032F |
6.1.7 Austria Spunbond Market Revenues & Volume, By Caprolactam, 2022-2032F |
6.2 Austria Spunbond Market, By Application |
6.2.1 Overview and Analysis |
6.2.2 Austria Spunbond Market Revenues & Volume, By Automotive, 2022-2032F |
6.2.3 Austria Spunbond Market Revenues & Volume, By Filtration, 2022-2032F |
6.2.4 Austria Spunbond Market Revenues & Volume, By Rubber Belting/Hoses, 2022-2032F |
6.2.5 Austria Spunbond Market Revenues & Volume, By Rubber Transfer Molding, 2022-2032F |
6.2.6 Austria Spunbond Market Revenues & Volume, By Embroidery/Apparel, 2022-2032F |
6.3 Austria Spunbond Market, By Composites |
6.3.1 Overview and Analysis |
6.3.2 Austria Spunbond Market Revenues & Volume, By Carpet/Rugs, 2022-2032F |
6.3.3 Austria Spunbond Market Revenues & Volume, By Agriculture, 2022-2032F |
6.3.4 Austria Spunbond Market Revenues & Volume, By Electrical and Electronics, 2022-2032F |
6.3.5 Austria Spunbond Market Revenues & Volume, By Textile, 2022-2032F |
6.3.6 Austria Spunbond Market Revenues & Volume, By Home Furnishing, 2022-2032F |
6.3.7 Austria Spunbond Market Revenues & Volume, By Tapes/Adhesives, 2022-2032F |
7 Austria Spunbond Market Import-Export Trade Statistics |
7.1 Austria Spunbond Market Export to Major Countries |
7.2 Austria Spunbond Market Imports from Major Countries |
8 Austria Spunbond Market Key Performance Indicators |
8.1 Percentage of recycled materials used in spunbond production, indicating the level of sustainability and environmental friendliness of the products. |
8.2 Production efficiency metrics such as energy consumption per unit produced, showcasing operational effectiveness and cost management in the manufacturing process. |
8.3 Research and development investment as a percentage of revenue, reflecting the focus on innovation and product development to stay competitive in the market. |
9 Austria Spunbond Market - Opportunity Assessment |
9.1 Austria Spunbond Market Opportunity Assessment, By Type, 2022 & 2032F |
9.2 Austria Spunbond Market Opportunity Assessment, By Application, 2022 & 2032F |
9.3 Austria Spunbond Market Opportunity Assessment, By Composites, 2022 & 2032F |
10 Austria Spunbond Market - Competitive Landscape |
10.1 Austria Spunbond Market Revenue Share, By Companies, 2025 |
10.2 Austria Spunbond Market Competitive Benchmarking, By Operating and Technical Parameters |
11 Company Profiles |
12 Recommendations |
13 Disclaimer |
Export potential assessment - trade Analytics for 2030
Export potential enables firms to identify high-growth global markets with greater confidence by combining advanced trade intelligence with a structured quantitative methodology. The framework analyzes emerging demand trends and country-level import patterns while integrating macroeconomic and trade datasets such as GDP and population forecasts, bilateral import–export flows, tariff structures, elasticity differentials between developed and developing economies, geographic distance, and import demand projections. Using weighted trade values from 2020–2024 as the base period to project country-to-country export potential for 2030, these inputs are operationalized through calculated drivers such as gravity model parameters, tariff impact factors, and projected GDP per-capita growth. Through an analysis of hidden potentials, demand hotspots, and market conditions that are most favorable to success, this method enables firms to focus on target countries, maximize returns, and global expansion with data, backed by accuracy.
By factoring in the projected importer demand gap that is currently unmet and could be potential opportunity, it identifies the potential for the Exporter (Country) among 190 countries, against the general trade analysis, which identifies the biggest importer or exporter.
To discover high-growth global markets and optimize your business strategy:
Click Here
Pricing
- Single User License$ 1,995
- Department License$ 2,400
- Site License$ 3,120
- Global License$ 3,795

Search
Thought Leadership and Analyst Meet


Our Clients
Latest Reports
- Philippines Polyhydroxybutyrate-co-Hydroxyvalerate Market (2026-2032) | Trends, Insights, Challenges, Restraints, Competition, Size, Value, Forecast, Pricing, Share, Outlook, Revenue, Investment Opportunities, Strategy, Drivers, Demand, Growth, segmentation, Analysis, Companies
- Peru Polyhydroxybutyrate-co-Hydroxyvalerate Market (2026-2032) | Growth, Demand, Challenges, Share, Trends, Analysis, Pricing, Investment Opportunities, Drivers, Value, Forecast, Competition, Size, Companies, Insights, Outlook, Restraints, segmentation, Revenue, Strategy
- Pakistan Polyhydroxybutyrate-co-Hydroxyvalerate Market (2026-2032) | Restraints, segmentation, Pricing, Forecast, Share, Strategy, Competition, Trends, Insights, Drivers, Challenges, Growth, Revenue, Outlook, Value, Investment Opportunities, Companies, Size, Analysis, Demand
- Oman Polyhydroxybutyrate-co-Hydroxyvalerate Market (2026-2032) | Drivers, segmentation, Insights, Competition, Pricing, Outlook, Size, Revenue, Challenges, Forecast, Analysis, Growth, Value, Share, Trends, Investment Opportunities, Strategy, Restraints, Companies, Demand
- Nigeria Polyhydroxybutyrate-co-Hydroxyvalerate Market (2026-2032) | Value, Investment Opportunities, Analysis, Revenue, Restraints, Pricing, Outlook, Competition, Demand, Growth, Forecast, Companies, Trends, Challenges, segmentation, Drivers, Insights, Share, Size, Strategy
- Nepal Polyhydroxybutyrate-co-Hydroxyvalerate Market (2026-2032) | Insights, Analysis, Drivers, Share, Revenue, Demand, segmentation, Investment Opportunities, Competition, Forecast, Growth, Pricing, Companies, Strategy, Trends, Restraints, Challenges, Outlook, Size, Value
- Myanmar Polyhydroxybutyrate-co-Hydroxyvalerate Market (2026-2032) | Outlook, Revenue, Strategy, Restraints, Drivers, segmentation, Share, Forecast, Competition, Insights, Growth, Pricing, Size, Demand, Value, Companies, Trends, Challenges, Investment Opportunities, Analysis
- Morocco Polyhydroxybutyrate-co-Hydroxyvalerate Market (2026-2032) | Outlook, Investment Opportunities, Restraints, Strategy, Forecast, Challenges, Drivers, Growth, Companies, segmentation, Trends, Size, Competition, Revenue, Demand, Insights, Share, Analysis, Value, Pricing
- Mexico Polyhydroxybutyrate-co-Hydroxyvalerate Market (2026-2032) | Size, Drivers, Outlook, Share, Strategy, Growth, Pricing, Challenges, Companies, Demand, Value, Investment Opportunities, Restraints, Trends, Forecast, segmentation, Analysis, Insights, Competition, Revenue
- Malaysia Polyhydroxybutyrate-co-Hydroxyvalerate Market (2026-2032) | Share, segmentation, Size, Companies, Analysis, Insights, Forecast, Value, Revenue, Drivers, Restraints, Challenges, Investment Opportunities, Trends, Competition, Strategy, Demand, Growth, Outlook, Pricing
Industry Events and Analyst Meet

HIMTEX 2026

India Refining Summit 2026

India EV Show 2026

EV tech India Expo 2026

Auto Tech Asia 2026
Whitepaper
- Middle East & Africa Commercial Security Market Click here to view more.
- Middle East & Africa Fire Safety Systems & Equipment Market Click here to view more.
- GCC Drone Market Click here to view more.
- Middle East Lighting Fixture Market Click here to view more.
- GCC Physical & Perimeter Security Market Click here to view more.
6WResearch In News
- Doha a strategic location for EV manufacturing hub: IPA Qatar
- Demand for luxury TVs surging in the GCC, says Samsung
- Empowering Growth: The Thriving Journey of Bangladesh’s Cable Industry
- Demand for luxury TVs surging in the GCC, says Samsung
- Video call with a traditional healer? Once unthinkable, it’s now common in South Africa
- Intelligent Buildings To Smooth GCC’s Path To Net Zero