Belgium Action Figures Market (2026-2032) | Forecast, Companies, Segmentation, Competitive Landscape, Size & Revenue, Trends, Analysis, Industry, Share, Value, Outlook, Growth
Market Forecast By Type (Superheroes, Anime Characters, Movie Characters), By Distribution Channel (Online, Offline), By End Users (Up to 8 years, 9-15 years, 15 years and Above) And Competitive Landscape
| Product Code: ETC6346302 | Publication Date: Sep 2024 | Updated Date: Apr 2026 | Product Type: Market Research Report | |
| Publisher: 6Wresearch | Author: Sumit Sagar | No. of Pages: 75 | No. of Figures: 35 | No. of Tables: 20 |
Belgium Action Figures Market Size (2020-2030)
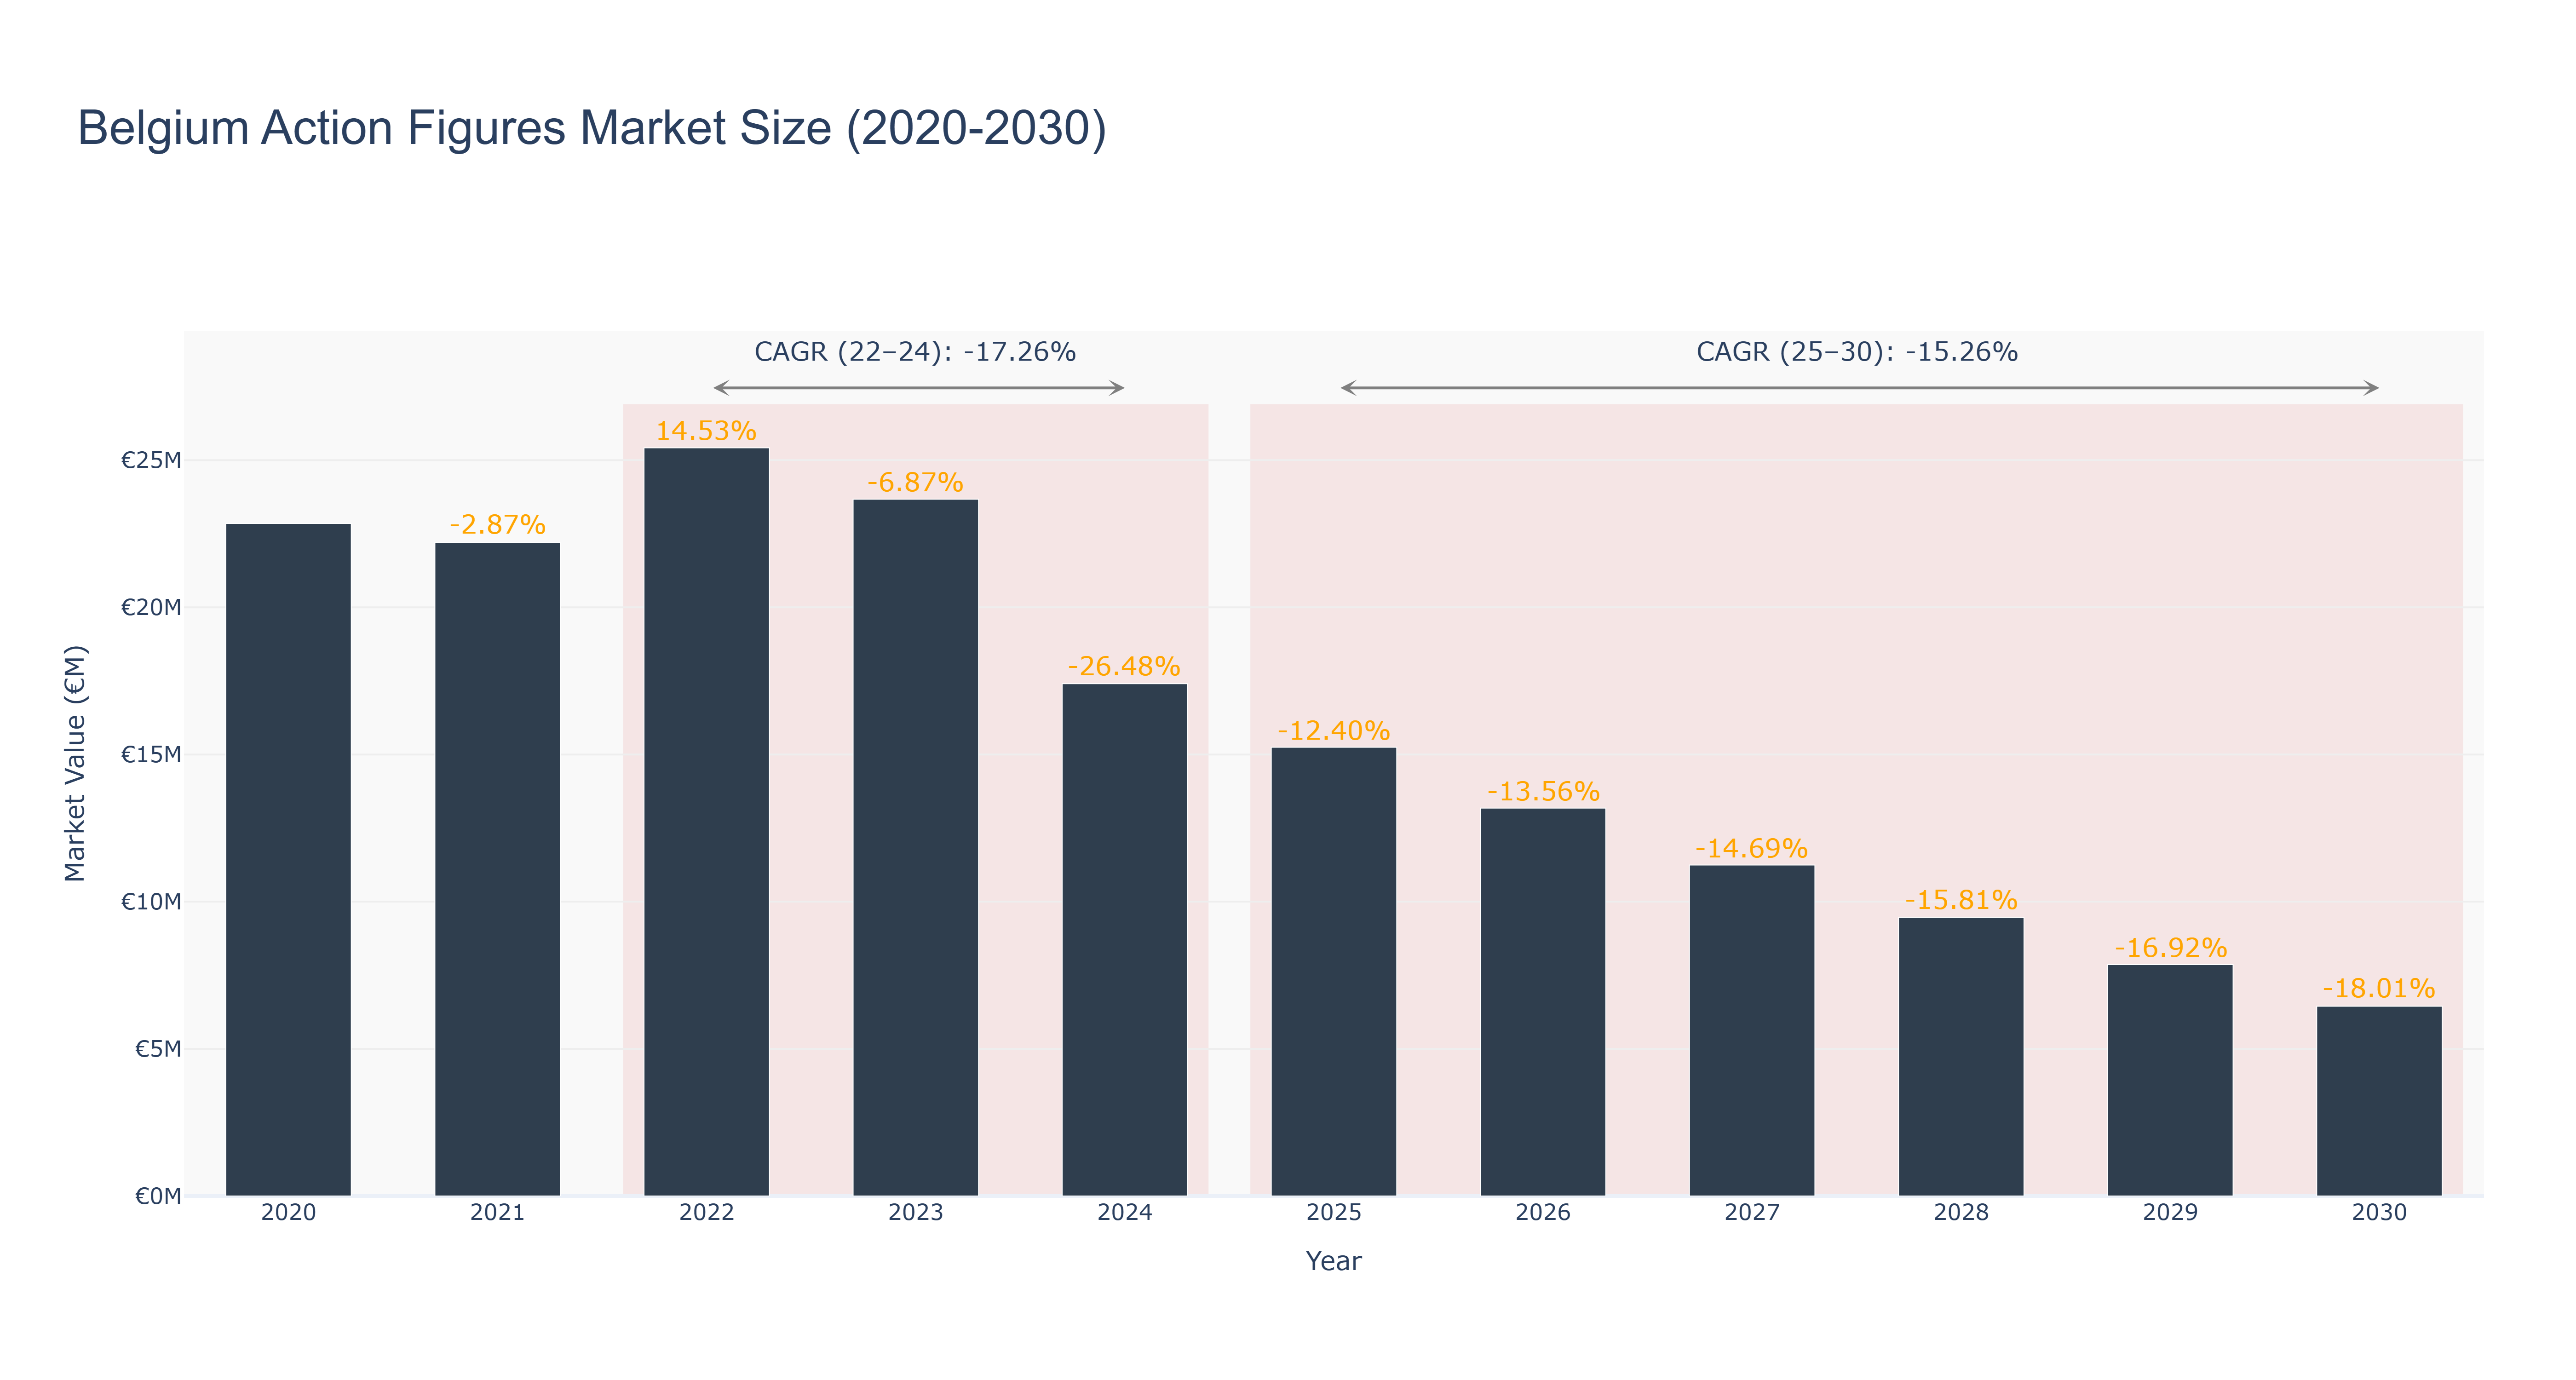
Belgium Action Figures Market has witnessed fluctuations in market size over the years. The peak market size was €25.42 million in 2022, followed by a decline to €6.45 million in 2030. The actual market size decreased from €22.85 million in 2020 to €17.40 million in 2024. The forecasted market size is expected to continue shrinking, with a CAGR of -15.26% from 2025 to 2030. The market faced challenges due to changing consumer preferences, economic uncertainties, and increased competition. Looking ahead, the market is focusing on digital transformation initiatives to enhance customer engagement and expand product offerings. Collaborations with popular entertainment franchises and the introduction of eco-friendly action figures are anticipated to drive growth in the future.
Belgium Action Figures Market: Production & Trade Performance (2019-2025)
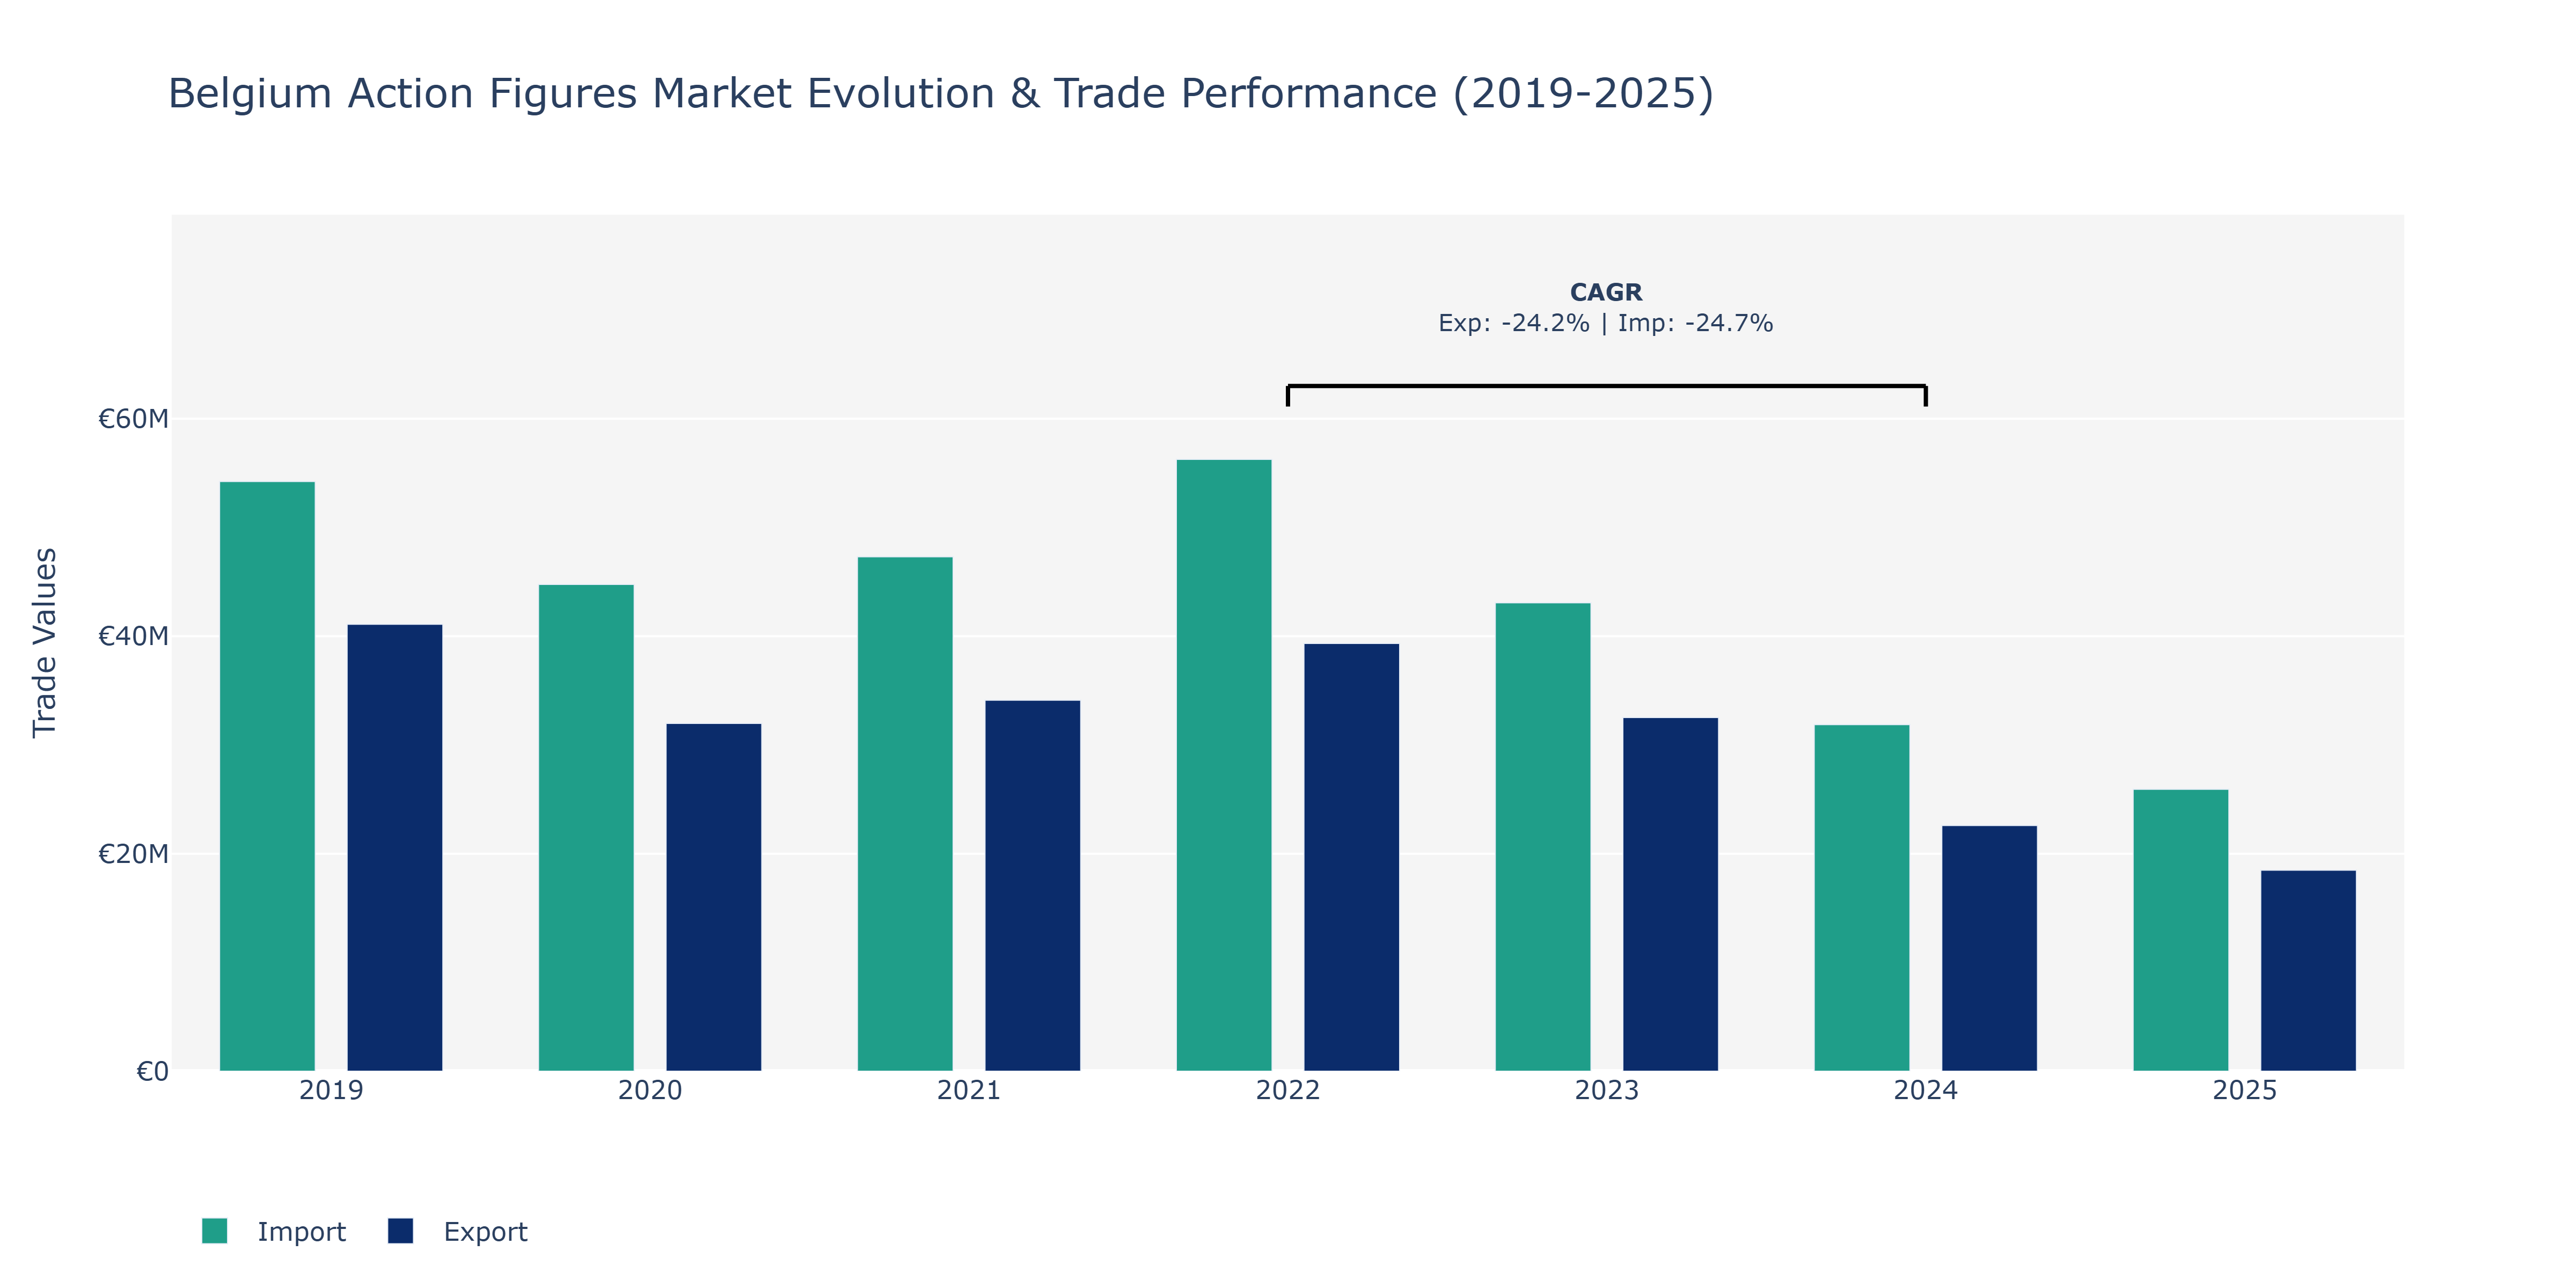
The Belgium Action Figures Market experienced fluctuations in both Exports and Imports from 2019 to 2025. Exports started at €41.1 million in 2019, decreased to €31.98 million in 2020, saw a slight increase in 2021 to €34.11 million, before peaking in 2022 at €39.33 million. Subsequently, a notable decline occurred in 2023 and 2024, dropping to €22.59 million and €18.48 million, respectively. Similarly, Imports followed a comparable trend. Beginning at €54.22 million in 2019, the value decreased to €44.76 million in 2020, rose to €47.31 million in 2021, peaked in 2022 at €56.26 million, and exhibited a decline to €25.92 million in 2025. The decline in both Exports and Imports from 2022 to 2024 can be attributed to various factors such as changes in consumer preferences, global economic conditions affecting disposable income, and disruptions in supply chains due to the pandemic. Future market strategies for Belgium's action figures industry may involve diversifying export markets and optimizing import channels to mitigate such fluctuations and sustain growth.
Key Highlights of the Report:
- Belgium Action Figures Market Outlook
- Market Size of Belgium Action Figures Market, 2025
- Forecast of Belgium Action Figures Market, 2032
- Historical Data and Forecast of Belgium Action Figures Revenues & Volume for the Period 2022 - 2032
- Belgium Action Figures Market Trend Evolution
- Belgium Action Figures Market Drivers and Challenges
- Belgium Action Figures Price Trends
- Belgium Action Figures Porter's Five Forces
- Belgium Action Figures Industry Life Cycle
- Historical Data and Forecast of Belgium Action Figures Market Revenues & Volume By Type for the Period 2022 - 2032
- Historical Data and Forecast of Belgium Action Figures Market Revenues & Volume By Superheroes for the Period 2022 - 2032
- Historical Data and Forecast of Belgium Action Figures Market Revenues & Volume By Anime Characters for the Period 2022 - 2032
- Historical Data and Forecast of Belgium Action Figures Market Revenues & Volume By Movie Characters for the Period 2022 - 2032
- Historical Data and Forecast of Belgium Action Figures Market Revenues & Volume By Distribution Channel for the Period 2022 - 2032
- Historical Data and Forecast of Belgium Action Figures Market Revenues & Volume By Online for the Period 2022 - 2032
- Historical Data and Forecast of Belgium Action Figures Market Revenues & Volume By Offline for the Period 2022 - 2032
- Historical Data and Forecast of Belgium Action Figures Market Revenues & Volume By End Users for the Period 2022 - 2032
- Historical Data and Forecast of Belgium Action Figures Market Revenues & Volume By Up to 8 years for the Period 2022 - 2032
- Historical Data and Forecast of Belgium Action Figures Market Revenues & Volume By 9-15 years for the Period 2022 - 2032
- Historical Data and Forecast of Belgium Action Figures Market Revenues & Volume By 15 years and Above for the Period 2022 - 2032
- Belgium Action Figures Import Export Trade Statistics
- Market Opportunity Assessment By Type
- Market Opportunity Assessment By Distribution Channel
- Market Opportunity Assessment By End Users
- Belgium Action Figures Top Companies Market Share
- Belgium Action Figures Competitive Benchmarking By Technical and Operational Parameters
- Belgium Action Figures Company Profiles
- Belgium Action Figures Key Strategic Recommendations
Frequently Asked Questions About the Market Study (FAQs):
6Wresearch actively monitors the Belgium Action Figures Market and publishes its comprehensive annual report, highlighting emerging trends, growth drivers, revenue analysis, and forecast outlook. Our insights help businesses to make data-backed strategic decisions with ongoing market dynamics. Our analysts track relevent industries related to the Belgium Action Figures Market, allowing our clients with actionable intelligence and reliable forecasts tailored to emerging regional needs.
Yes, we provide customisation as per your requirements. To learn more, feel free to contact us on sales@6wresearch.com
1 Executive Summary |
2 Introduction |
2.1 Key Highlights of the Report |
2.2 Report Description |
2.3 Market Scope & Segmentation |
2.4 Research Methodology |
2.5 Assumptions |
3 Belgium Action Figures Market Overview |
3.1 Belgium Country Macro Economic Indicators |
3.2 Belgium Action Figures Market Revenues & Volume, 2022 & 2032F |
3.3 Belgium Action Figures Market - Industry Life Cycle |
3.4 Belgium Action Figures Market - Porter's Five Forces |
3.5 Belgium Action Figures Market Revenues & Volume Share, By Type, 2022 & 2032F |
3.6 Belgium Action Figures Market Revenues & Volume Share, By Distribution Channel, 2022 & 2032F |
3.7 Belgium Action Figures Market Revenues & Volume Share, By End Users, 2022 & 2032F |
4 Belgium Action Figures Market Dynamics |
4.1 Impact Analysis |
4.2 Market Drivers |
4.2.1 Growing popularity of action figures among collectors and enthusiasts in Belgium |
4.2.2 Increasing demand for licensed merchandise and collectibles in the market |
4.2.3 Rising trend of nostalgia-driven purchases, especially among adults |
4.3 Market Restraints |
4.3.1 Competition from other collectible items such as trading cards, Funko Pops, and model kits |
4.3.2 Economic uncertainty impacting consumer spending on non-essential items |
5 Belgium Action Figures Market Trends |
6 Belgium Action Figures Market, By Types |
6.1 Belgium Action Figures Market, By Type |
6.1.1 Overview and Analysis |
6.1.2 Belgium Action Figures Market Revenues & Volume, By Type, 2022 - 2032F |
6.1.3 Belgium Action Figures Market Revenues & Volume, By Superheroes, 2022 - 2032F |
6.1.4 Belgium Action Figures Market Revenues & Volume, By Anime Characters, 2022 - 2032F |
6.1.5 Belgium Action Figures Market Revenues & Volume, By Movie Characters, 2022 - 2032F |
6.2 Belgium Action Figures Market, By Distribution Channel |
6.2.1 Overview and Analysis |
6.2.2 Belgium Action Figures Market Revenues & Volume, By Online, 2022 - 2032F |
6.2.3 Belgium Action Figures Market Revenues & Volume, By Offline, 2022 - 2032F |
6.3 Belgium Action Figures Market, By End Users |
6.3.1 Overview and Analysis |
6.3.2 Belgium Action Figures Market Revenues & Volume, By Up to 8 years, 2022 - 2032F |
6.3.3 Belgium Action Figures Market Revenues & Volume, By 9-15 years, 2022 - 2032F |
6.3.4 Belgium Action Figures Market Revenues & Volume, By 15 years and Above, 2022 - 2032F |
7 Belgium Action Figures Market Import-Export Trade Statistics |
7.1 Belgium Action Figures Market Export to Major Countries |
7.2 Belgium Action Figures Market Imports from Major Countries |
8 Belgium Action Figures Market Key Performance Indicators |
8.1 Social media engagement and following of Belgian action figure retailers and brands |
8.2 Number of exclusive and limited-edition releases in the Belgian market |
8.3 Average time taken to sell out new action figure releases in Belgium |
9 Belgium Action Figures Market - Opportunity Assessment |
9.1 Belgium Action Figures Market Opportunity Assessment, By Type, 2022 & 2032F |
9.2 Belgium Action Figures Market Opportunity Assessment, By Distribution Channel, 2022 & 2032F |
9.3 Belgium Action Figures Market Opportunity Assessment, By End Users, 2022 & 2032F |
10 Belgium Action Figures Market - Competitive Landscape |
10.1 Belgium Action Figures Market Revenue Share, By Companies, 2025 |
10.2 Belgium Action Figures Market Competitive Benchmarking, By Operating and Technical Parameters |
11 Company Profiles |
12 Recommendations |
13 Disclaimer |
Global Go To Market Strategy - 2030
Export potential enables firms to identify high-growth global markets with greater confidence by combining advanced trade intelligence with a structured quantitative methodology. The framework analyzes emerging demand trends and country-level import patterns while integrating macroeconomic and trade datasets such as GDP and population forecasts, bilateral import–export flows, tariff structures, elasticity differentials between developed and developing economies, geographic distance, and import demand projections. Using weighted trade values from 2020–2024 as the base period to project country-to-country export potential for 2030, these inputs are operationalized through calculated drivers such as gravity model parameters, tariff impact factors, and projected GDP per-capita growth. Through an analysis of hidden potentials, demand hotspots, and market conditions that are most favorable to success, this method enables firms to focus on target countries, maximize returns, and global expansion with data, backed by accuracy.
By factoring in the projected importer demand gap that is currently unmet and could be potential opportunity, it identifies the potential for the Exporter (Country) among 190 countries, against the general trade analysis, which identifies the biggest importer or exporter.
To discover high-growth global markets and optimize your business strategy:
Click Here
Pricing
- Single User License$ 1,995
- Department License$ 2,400
- Site License$ 3,120
- Global License$ 3,795

Leadership Perspectives from Industry Events
Search
Thought Leadership and Analyst Meet


Our Clients
6WResearch In News
- Doha a strategic location for EV manufacturing hub: IPA Qatar
- Demand for luxury TVs surging in the GCC, says Samsung
- Empowering Growth: The Thriving Journey of Bangladesh’s Cable Industry
- Demand for luxury TVs surging in the GCC, says Samsung
- Video call with a traditional healer? Once unthinkable, it’s now common in South Africa
- Intelligent Buildings To Smooth GCC’s Path To Net Zero
Latest Reports
- Poland Fire Protection Systems Market (2026-2032)
- Cape Verde Portable Hand-Thrown Extinguisher Market (2026-2032)
- Canada Portable Hand-Thrown Extinguisher Market (2026-2032)
- Cameroon Portable Hand-Thrown Extinguisher Market (2026-2032)
- Burundi Portable Hand-Thrown Extinguisher Market (2026-2032)
- Burkina Faso Portable Hand-Thrown Extinguisher Market (2026-2032)
- Bulgaria Portable Hand-Thrown Extinguisher Market (2026-2032)
- Brunei Portable Hand-Thrown Extinguisher Market (2026-2032)
- Botswana Portable Hand-Thrown Extinguisher Market (2026-2032)
- Bosnia and Herzegovina Portable Hand-Thrown Extinguisher Market (2026-2032)
Industry Events and Analyst Meet

HIMTEX 2026

India Refining Summit 2026

India EV Show 2026

EV tech India Expo 2026

Auto Tech Asia 2026
Whitepaper
- Middle East & Africa Commercial Security Market Click here to view more.
- Middle East & Africa Fire Safety Systems & Equipment Market Click here to view more.
- GCC Drone Market Click here to view more.
- Middle East Lighting Fixture Market Click here to view more.
- GCC Physical & Perimeter Security Market Click here to view more.